Vantor is the Colorado-based intelligence offshoot of Maxar. It was formed last year after Maxar, a once-publicly traded satellite manufacturer and constellation operator, was split into two firms.
Vantor publishes satellite imagery from constellations that were built and launched between the late 1990s and as recently as February of last year.
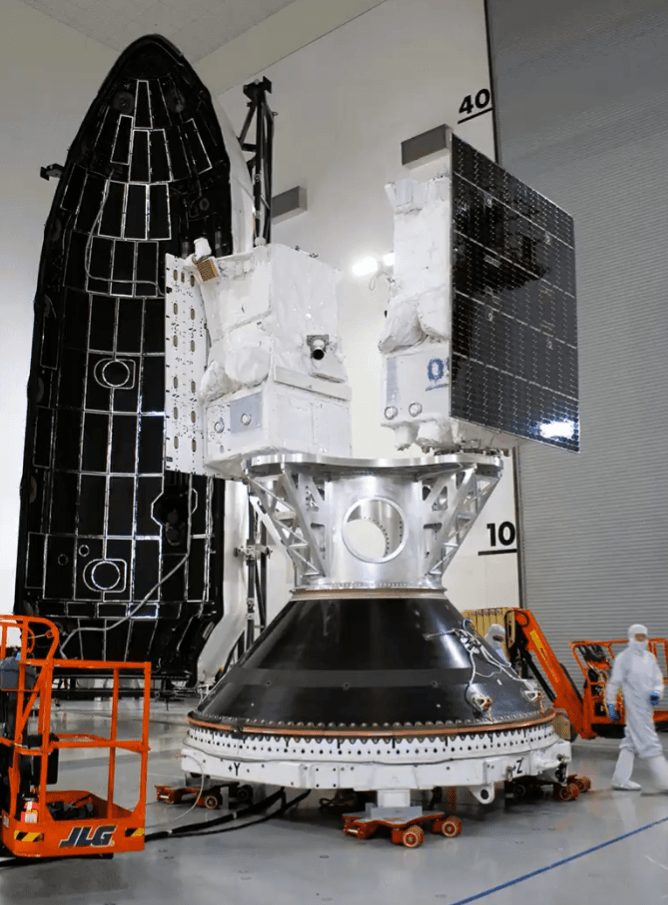
These are their WorldView Legion 3 and 4 satellites as they were being prepared for launch in August of 2024.
In 2023, I covered the open S3 bucket of Maxar's satellite feeds. Early this year, Vantor set up a brand new S3 bucket. Its purpose is to share imagery from disaster-struck parts of the globe. The imagery can often be captured and appear in the bucket within a two-hour time window.
In this post, I'll explore Vantor's new open S3 bucket.
My Workstation
I'm using a 5.7 GHz AMD Ryzen 9 9950X CPU. It has 16 cores and 32 threads and 1.2 MB of L1, 16 MB of L2 and 64 MB of L3 cache. It has a liquid cooler attached and is housed in a spacious, full-sized Cooler Master HAF 700 computer case.
The system has 96 GB of DDR5 RAM clocked at 4,800 MT/s and a 5th-generation, Crucial T700 4 TB NVMe M.2 SSD which can read at speeds up to 12,400 MB/s. There is a heatsink on the SSD to help keep its temperature down. This is my system's C drive.
The system is powered by a 1,200-watt, fully modular Corsair Power Supply and is sat on an ASRock X870E Nova 90 Motherboard.
I'm running Ubuntu 24 LTS via Microsoft's Ubuntu for Windows on Windows 11 Pro. In case you're wondering why I don't run a Linux-based desktop as my primary work environment, I'm still using an Nvidia GTX 1080 GPU which has better driver support on Windows and ArcGIS Pro only supports Windows natively.
Installing Prerequisites
I'll use the AWS CLI and jq in this post.
$ sudo apt update
$ sudo apt install \
    awscli \
    jq
I'll use DuckDB, along with its H3, JSON, Lindel, Parquet and Spatial extensions in this post.
$ cd ~
$ wget -c https://github.com/duckdb/duckdb/releases/download/v1.5.4/duckdb_cli-linux-amd64.zip
$ unzip -j duckdb_cli-linux-amd64.zip
$ chmod +x duckdb
$ ~/duckdb
INSTALL h3 FROM community;
INSTALL lindel FROM community;
INSTALL json;
INSTALL parquet;
INSTALL spatial;
I'll set up DuckDB to load every installed extension each time it launches.
$ vi ~/.duckdbrc
.timer on
.width 180
LOAD h3;
LOAD lindel;
LOAD json;
LOAD parquet;
LOAD spatial;
The maps in this post were rendered with QGIS version 4.0.3. QGIS is a desktop application that runs on Windows, macOS and Linux. The application has grown in popularity in recent years and has ~15M application launches from users all around the world each month.
The administrative boundaries and populated places data was sourced from Natural Earth. The constellation details were sourced from GCAT.
Vantor's Constellations
These are the details of Vantor's satellite constellations both past and present.
$ ~/duckdb
SELECT   Name,
         JCAT,
         Manufacturer,
         Owner,
         LDate,
         Launch_Tag,
         Bus,
         Shape,
         DryMass,
         Length,
         Diameter,
         Span,
         TotMass,
         OpOrbit,
         Apogee,
         Inc,
         Perigee,
         Status
FROM     'gcat/satcat.parquet'
WHERE    (   NAME ILIKE 'WorldView%'
          OR NAME ILIKE 'GeoEye%'
          OR NAME ILIKE 'IKONOS%'
          OR NAME ILIKE 'QuickBird%')
ORDER BY Launch_Tag,
         Name;
┌────────────────────┬─────────┬──────────────┬─────────┬─────────────┬────────────┬──────────┬──────────────────┬─────────┬────────┬──────────┬───────┬─────────┬─────────┬────────┬───────┬─────────┬────────────────────┐
│        Name        │  JCAT   │ Manufacturer │  Owner  │    LDate    │ Launch_Tag │   Bus    │      Shape       │ DryMass │ Length │ Diameter │ Span  │ TotMass │ OpOrbit │ Apogee │  Inc  │ Perigee │       Status       │
│      varchar       │ varchar │   varchar    │ varchar │   varchar   │  varchar   │ varchar  │     varchar      │ varchar │ float  │  float   │ float │  float  │ varchar │ int32  │ float │ varchar │      varchar       │
├────────────────────┼─────────┼──────────────┼─────────┼─────────────┼────────────┼──────────┼──────────────────┼─────────┼────────┼──────────┼───────┼─────────┼─────────┼────────┼───────┼─────────┼────────────────────┤
│ Ikonos             │ S25919  │ LMMS         │ SIMG    │ 1999 Sep 24 │ 1999-051   │ LM-900   │ Box + Pan        │ 688     │    2.0 │      1.5 │   2.0 │   726.0 │ LEO/S   │    682 │ 98.19 │ 677     │ In orbit           │
│ QuickBird 1        │ S26617  │ BALL         │ EWAT    │ 2000 Nov 20 │ 2000-074   │ BCP-2000 │ Box + 2 Pan      │ 900     │    2.5 │      1.0 │   3.0 │  2365.0 │ LLEO/I  │    614 │ 65.78 │ 81      │ Reentered attached │
│ QuickBird 2        │ S26953  │ BALL         │ EWAT    │ 2001 Oct 18 │ 2001-047   │ BCP-2000 │ Box + 2 Pan      │ 996     │    3.0 │      1.6 │   5.2 │  1028.0 │ LLEO/S  │    465 │ 97.22 │ 461     │ Reentered          │
│ WorldView-1        │ S32060  │ BALL         │ DGLO    │ 2007 Sep 18 │ 2007-041   │ BCP-5000 │ Box + 2 Pan      │ 2000    │    3.6 │      2.5 │   7.1 │  2500.0 │ LLEO/S  │    494 │  97.5 │ 493     │ In orbit           │
│ GeoEye-1           │ S33331  │ GDG          │ GEYE    │ 2008 Sep  6 │ 2008-042   │ SA-200HP │ Hex Cyl + Pan    │ 1779    │    4.4 │      2.7 │   5.0 │  1923.0 │ LEO/S   │    686 │ 98.13 │ 671     │ In orbit           │
│ WorldView-2        │ S35946  │ BALL         │ DGLO    │ 2009 Oct  8 │ 2009-055   │ BCP-5000 │ Hex Cyl + 2 Pan  │ 2200    │    4.3 │      2.5 │   7.1 │  2615.0 │ LEO/S   │    769 │ 98.58 │ 765     │ In orbit           │
│ WorldView-3        │ S40115  │ BALL         │ DGLO    │ 2014 Aug 13 │ 2014-048   │ BCP-5000 │ Hex cyl+2 panels │ 2200    │    4.3 │      2.5 │   7.1 │  2615.0 │ LEO/S   │    614 │ 97.99 │ 612     │ In orbit           │
│ WorldView-4        │ S41848  │ LMSS         │ DGLO    │ 2016 Nov 11 │ 2016-067   │ LM-900   │ Cyl+5 pan        │ 2000    │    5.3 │      2.5 │   7.9 │  2087.0 │ LEO/S   │    613 │ 97.97 │ 610     │ Reentered          │
│ WorldView Legion 1 │ S59625  │ MAXSI        │ MAXARI  │ 2024 May  2 │ 2024-081   │ Legion   │ Box + panel      │ 630     │    3.0 │      2.0 │   5.0 │   700.0 │ LLEO/S  │    520 │ 97.58 │ 514     │ In orbit           │
│ WorldView Legion 2 │ S59626  │ MAXSI        │ MAXARI  │ 2024 May  2 │ 2024-081   │ Legion   │ Box + panel      │ 630     │    3.0 │      2.0 │   5.0 │   700.0 │ LLEO/S  │    520 │ 97.58 │ 514     │ In orbit           │
│ WorldView Legion 3 │ S60452  │ MAXSI        │ MAXARI  │ 2024 Aug 15 │ 2024-146   │ Legion   │ Box + panel      │ 630     │    3.0 │      2.0 │   5.0 │   700.0 │ LLEO/I  │    453 │ 44.99 │ 446     │ In orbit           │
│ WorldView Legion 4 │ S60453  │ MAXSI        │ MAXARI  │ 2024 Aug 15 │ 2024-146   │ Legion   │ Box + panel      │ 630     │    3.0 │      2.0 │   5.0 │   700.0 │ LEO/I   │    704 │ 45.04 │ 699     │ In orbit           │
│ WorldView Legion 5 │ S62900  │ MAXSI        │ MAXARI  │ 2025 Feb  4 │ 2025-025   │ Legion   │ Box + panel      │ 630     │    3.0 │      2.0 │   5.0 │   700.0 │ LEO/I   │    706 │ 45.05 │ 699     │ In orbit           │
│ WorldView Legion 6 │ S62901  │ MAXSI        │ MAXARI  │ 2025 Feb  4 │ 2025-025   │ Legion   │ Box + panel      │ 630     │    3.0 │      2.0 │   5.0 │   700.0 │ LLEO/I  │    452 │ 44.99 │ 446     │ In orbit           │
└────────────────────┴─────────┴──────────────┴─────────┴─────────────┴────────────┴──────────┴──────────────────┴─────────┴────────┴──────────┴───────┴─────────┴─────────┴────────┴───────┴─────────┴────────────────────┘
Vantor's S3 Bucket
I'll list the contents of their S3 bucket into a line-delimited JSON file.
$ aws --no-sign-request \
      --output json \
      s3api \
      list-objects \
      --bucket vantor-opendata \
      --prefix 'events/' \
      --max-items=100000000 \
    | jq -c '.Contents[]' \
    > vantor_s3.json
I'll then clean up and import that data into a DuckDB table.
$ ~/duckdb vantor.duckdb
CREATE OR REPLACE TABLE s3_inventory AS
      SELECT * EXCLUDE(LastModified),
             LastModified: LastModified::TIMESTAMP,
             event:        IF(SPLIT(Key, '/')[2] NOT LIKE '%.%',
                              SPLIT(Key, '/')[2],
                              NULL),
             file_type:    IF(Key LIKE '%.%',
                              SPLIT(Key, '.')[-1],
                              NULL)
      FROM   READ_JSON('vantor_s3.json');
This month has seen the largest number of images added to the bucket so far.
WITH a AS (
    SELECT   year_:  YEAR(LastModified),
             month_: MONTH(LastModified),
             cnt:    COUNT(*)
    FROM     s3_inventory
    WHERE    file_type = 'tif'
    GROUP BY 1, 2
)
PIVOT    a
ON       year_
USING    SUM(cnt)
GROUP BY month_
ORDER BY month_;
┌────────┬────────┐
│ month_ │  2026  │
│ int64  │ int128 │
├────────┼────────┤
│      2 │      9 │
│      5 │     15 │
│      6 │     48 │
└────────┴────────┘
These are the number of GB broken down by file type and event in the bucket as of this writing.
WITH a AS (
    SELECT   event,
             file_type,
             num_bytes: SUM(Size)
    FROM     s3_inventory
    WHERE    event IS NOT NULL
    GROUP BY 1, 2
)
PIVOT    a
ON       file_type
USING    CEIL(SUM(num_bytes) / 1024 ** 3)::INT
GROUP BY event
ORDER BY event;
┌──────────────────────────────────┬───────┬───────┬───────┐
│              event               │  jpg  │ json  │  tif  │
│             varchar              │ int32 │ int32 │ int32 │
├──────────────────────────────────┼───────┼───────┼───────┤
│ DRC-Ebola-May-2026               │     1 │     1 │   359 │
│ Spain-Portugal-Flooding-Feb-2026 │  NULL │     1 │     7 │
│ Typhoon-Gezani-Feb-2026          │     1 │     1 │   163 │
│ Venezuela-Earthquake-Jun-2026    │     1 │     1 │   356 │
└──────────────────────────────────┴───────┴───────┴───────┘
Imagery Footprints
I'll sync all of the assets from the Venezuelan earthquake folder.
$ aws s3 sync \
    --no-sign-request \
    s3://vantor-opendata/events/Venezuela-Earthquake-Jun-2026 \
    Venezuela-Earthquake-Jun-2026/
I'll then build a Parquet file containing the metadata of each image captured.
$ ~/duckdb
COPY (
   SELECT * EXCLUDE(geometry,
                    properties),
          properties.* EXCLUDE (ingestion_datetime,
                                phase,
                                published),
          ingestion: properties.ingestion_datetime::TIMESTAMP,
          geometry:  ST_GeomFromGeoJSON(geometry)
   FROM   'Venezuela-Earthquake-Jun-2026/*00*.json'
) TO 'venezuela.parquet' (
    FORMAT            'PARQUET',
    CODEC             'ZSTD',
    COMPRESSION_LEVEL 22,
    ROW_GROUP_SIZE    15000);
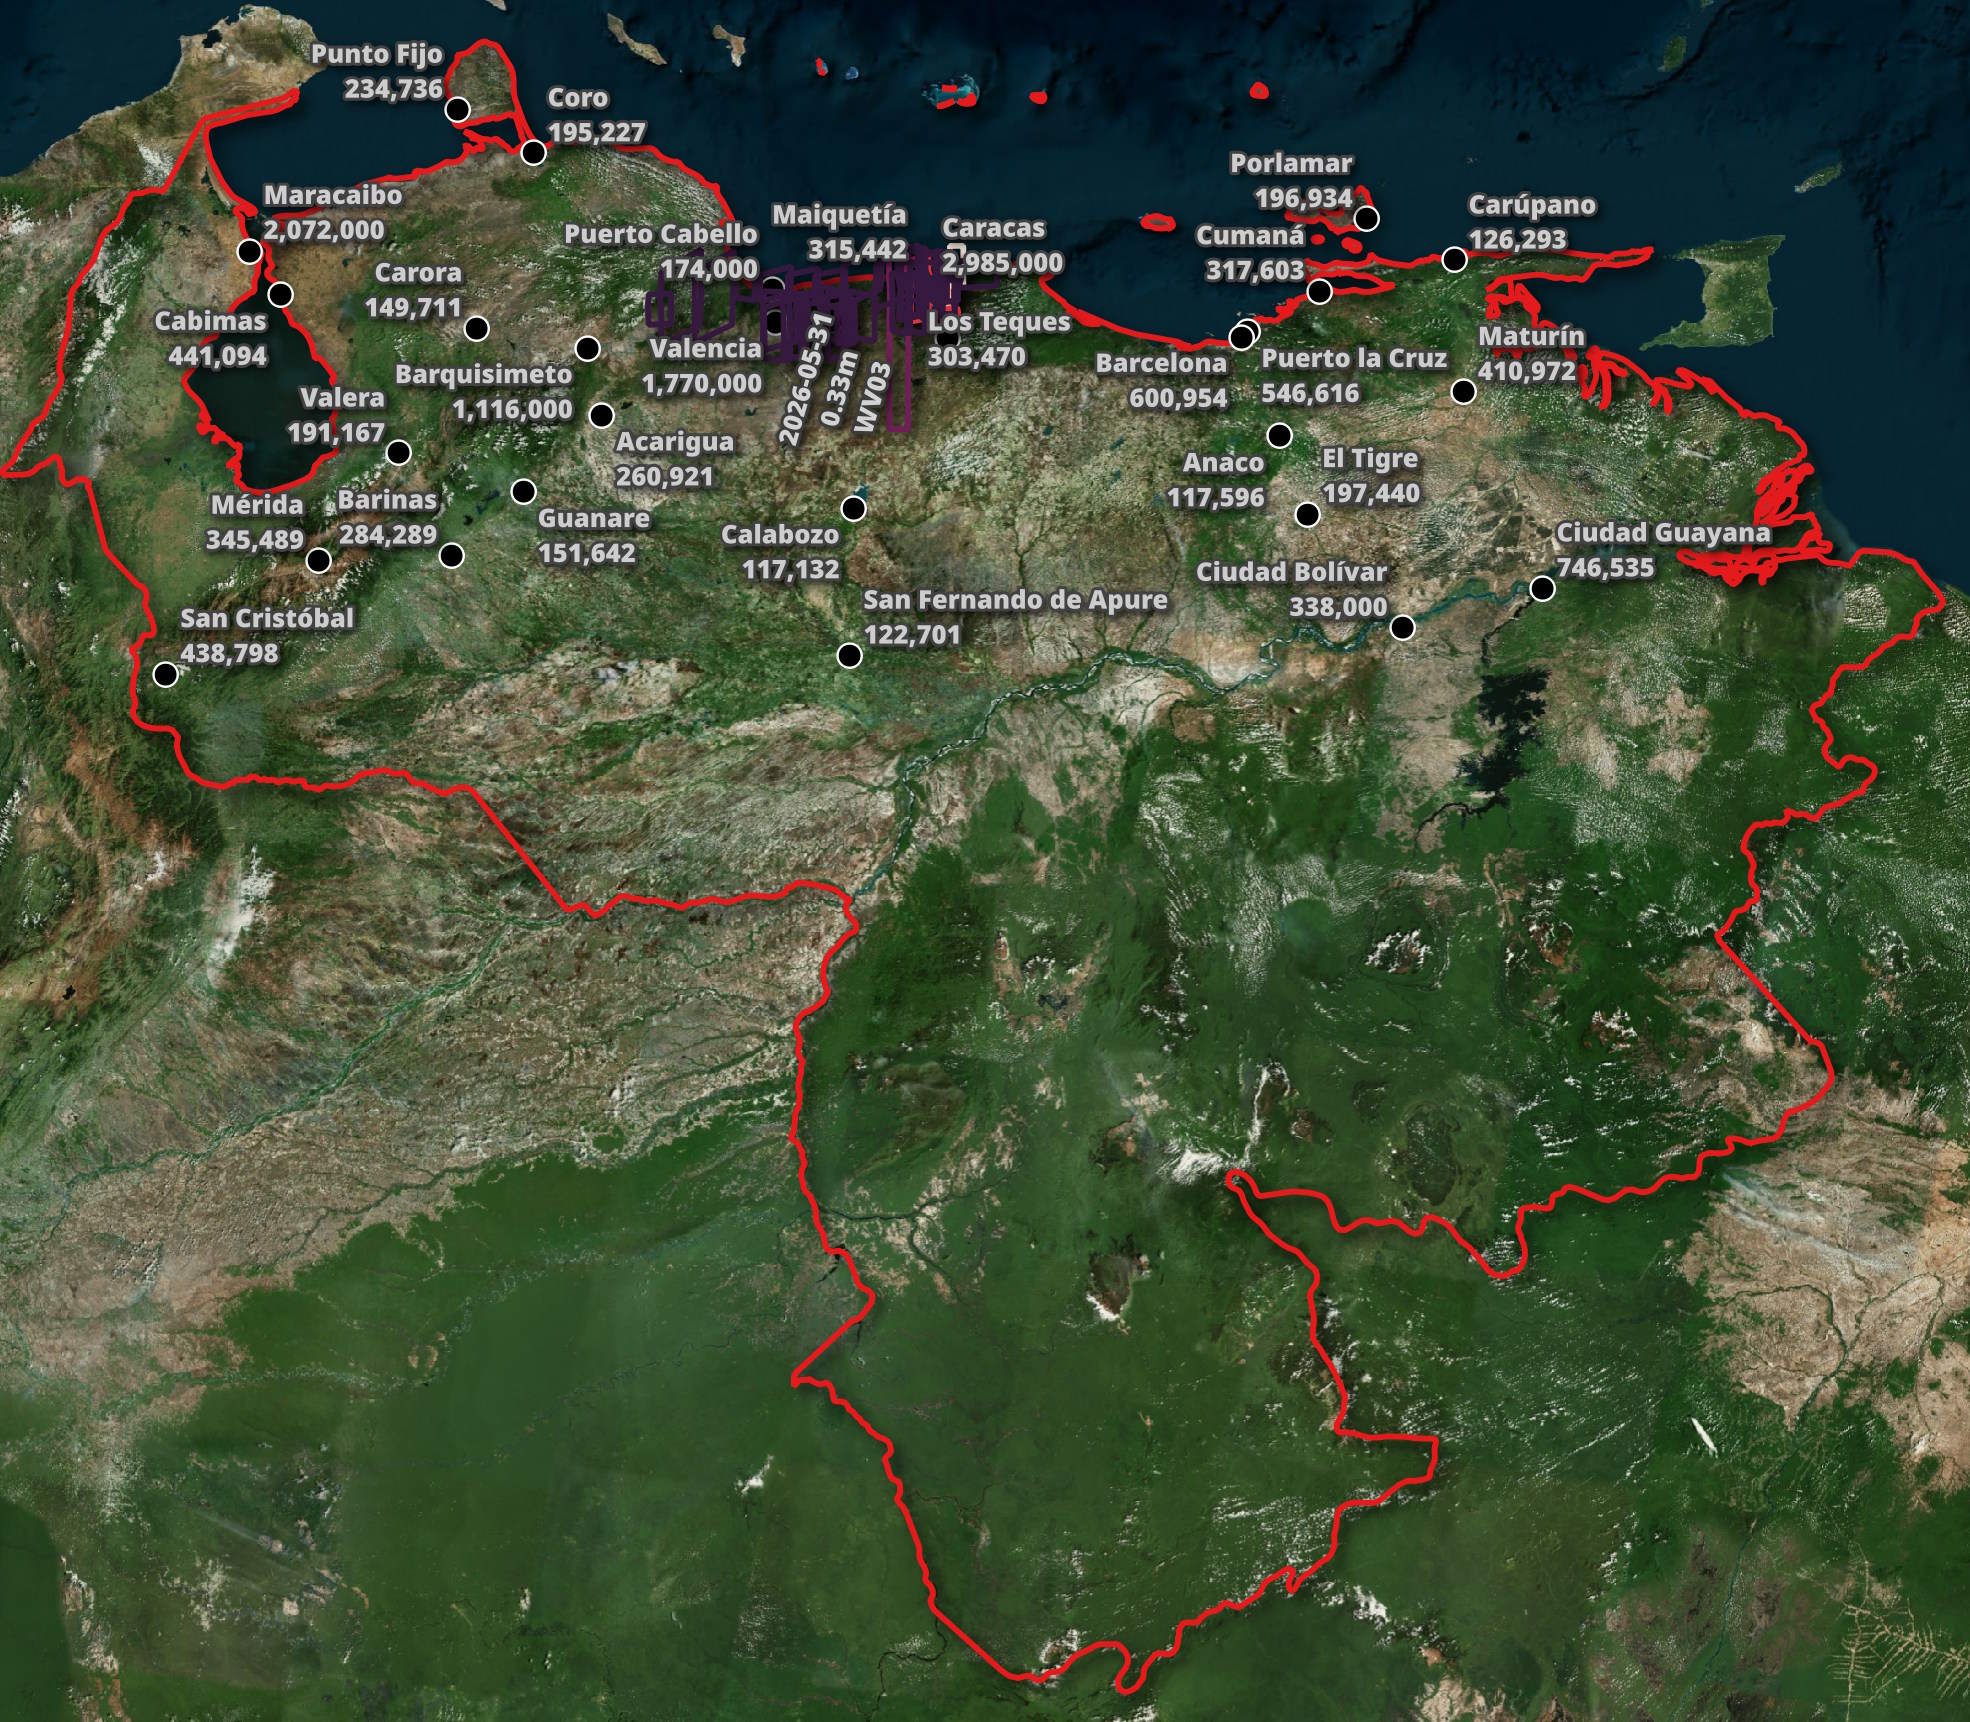
The footprints of the images are mostly within a 100 KM of Caracas. The basemap in this image is from Bing.
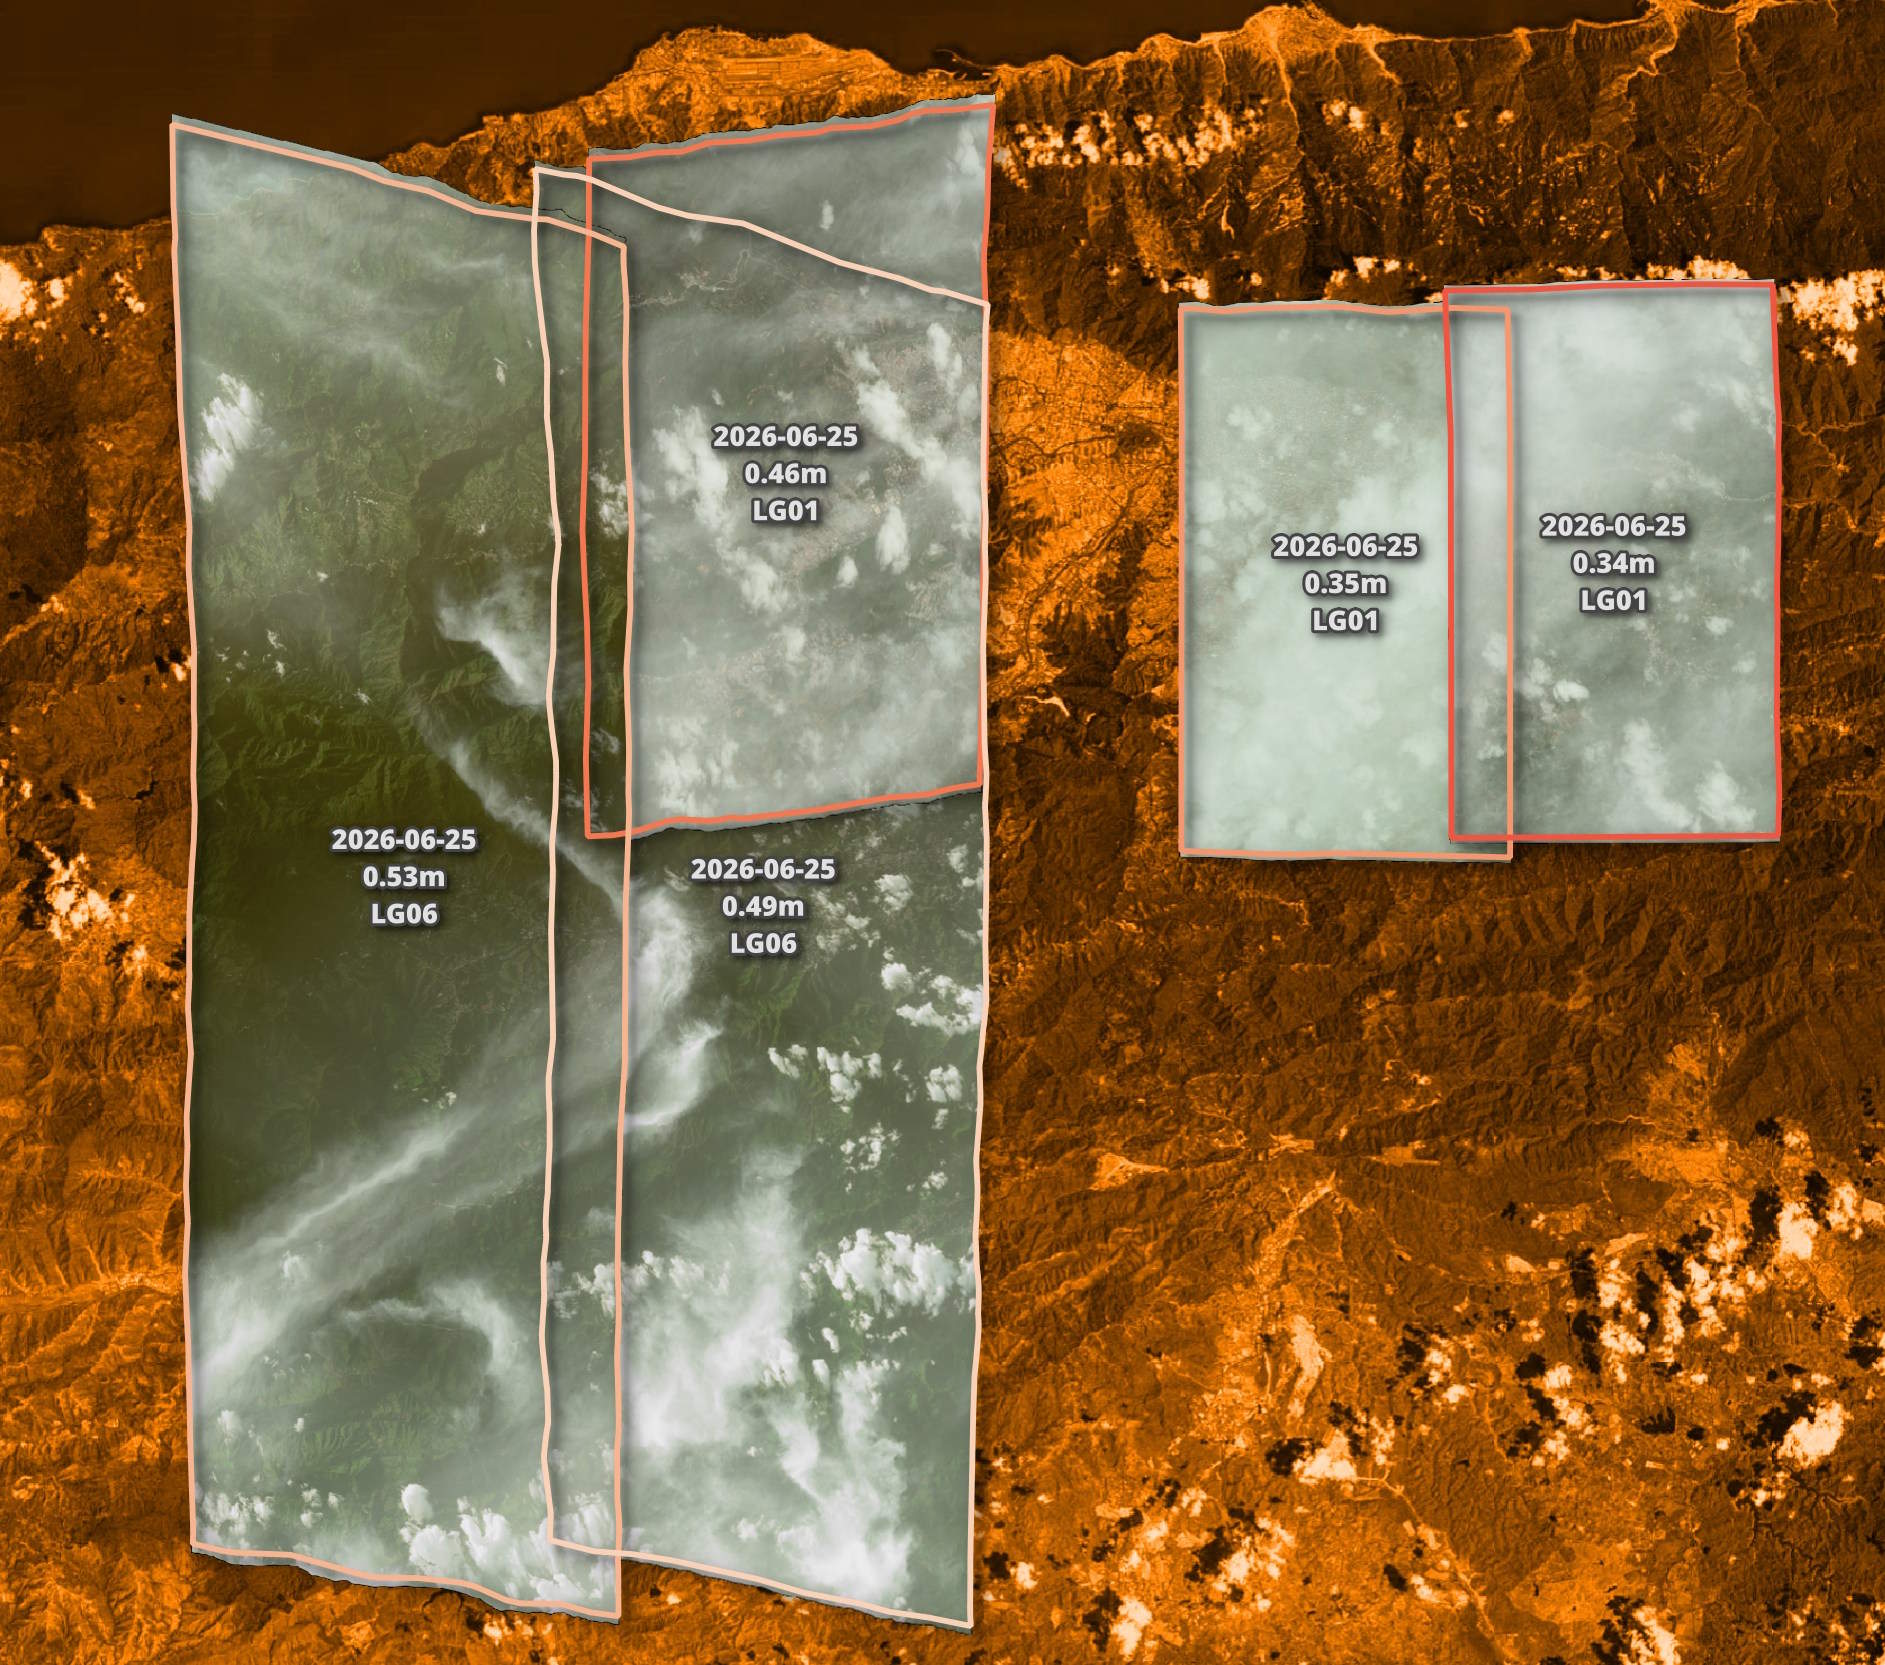
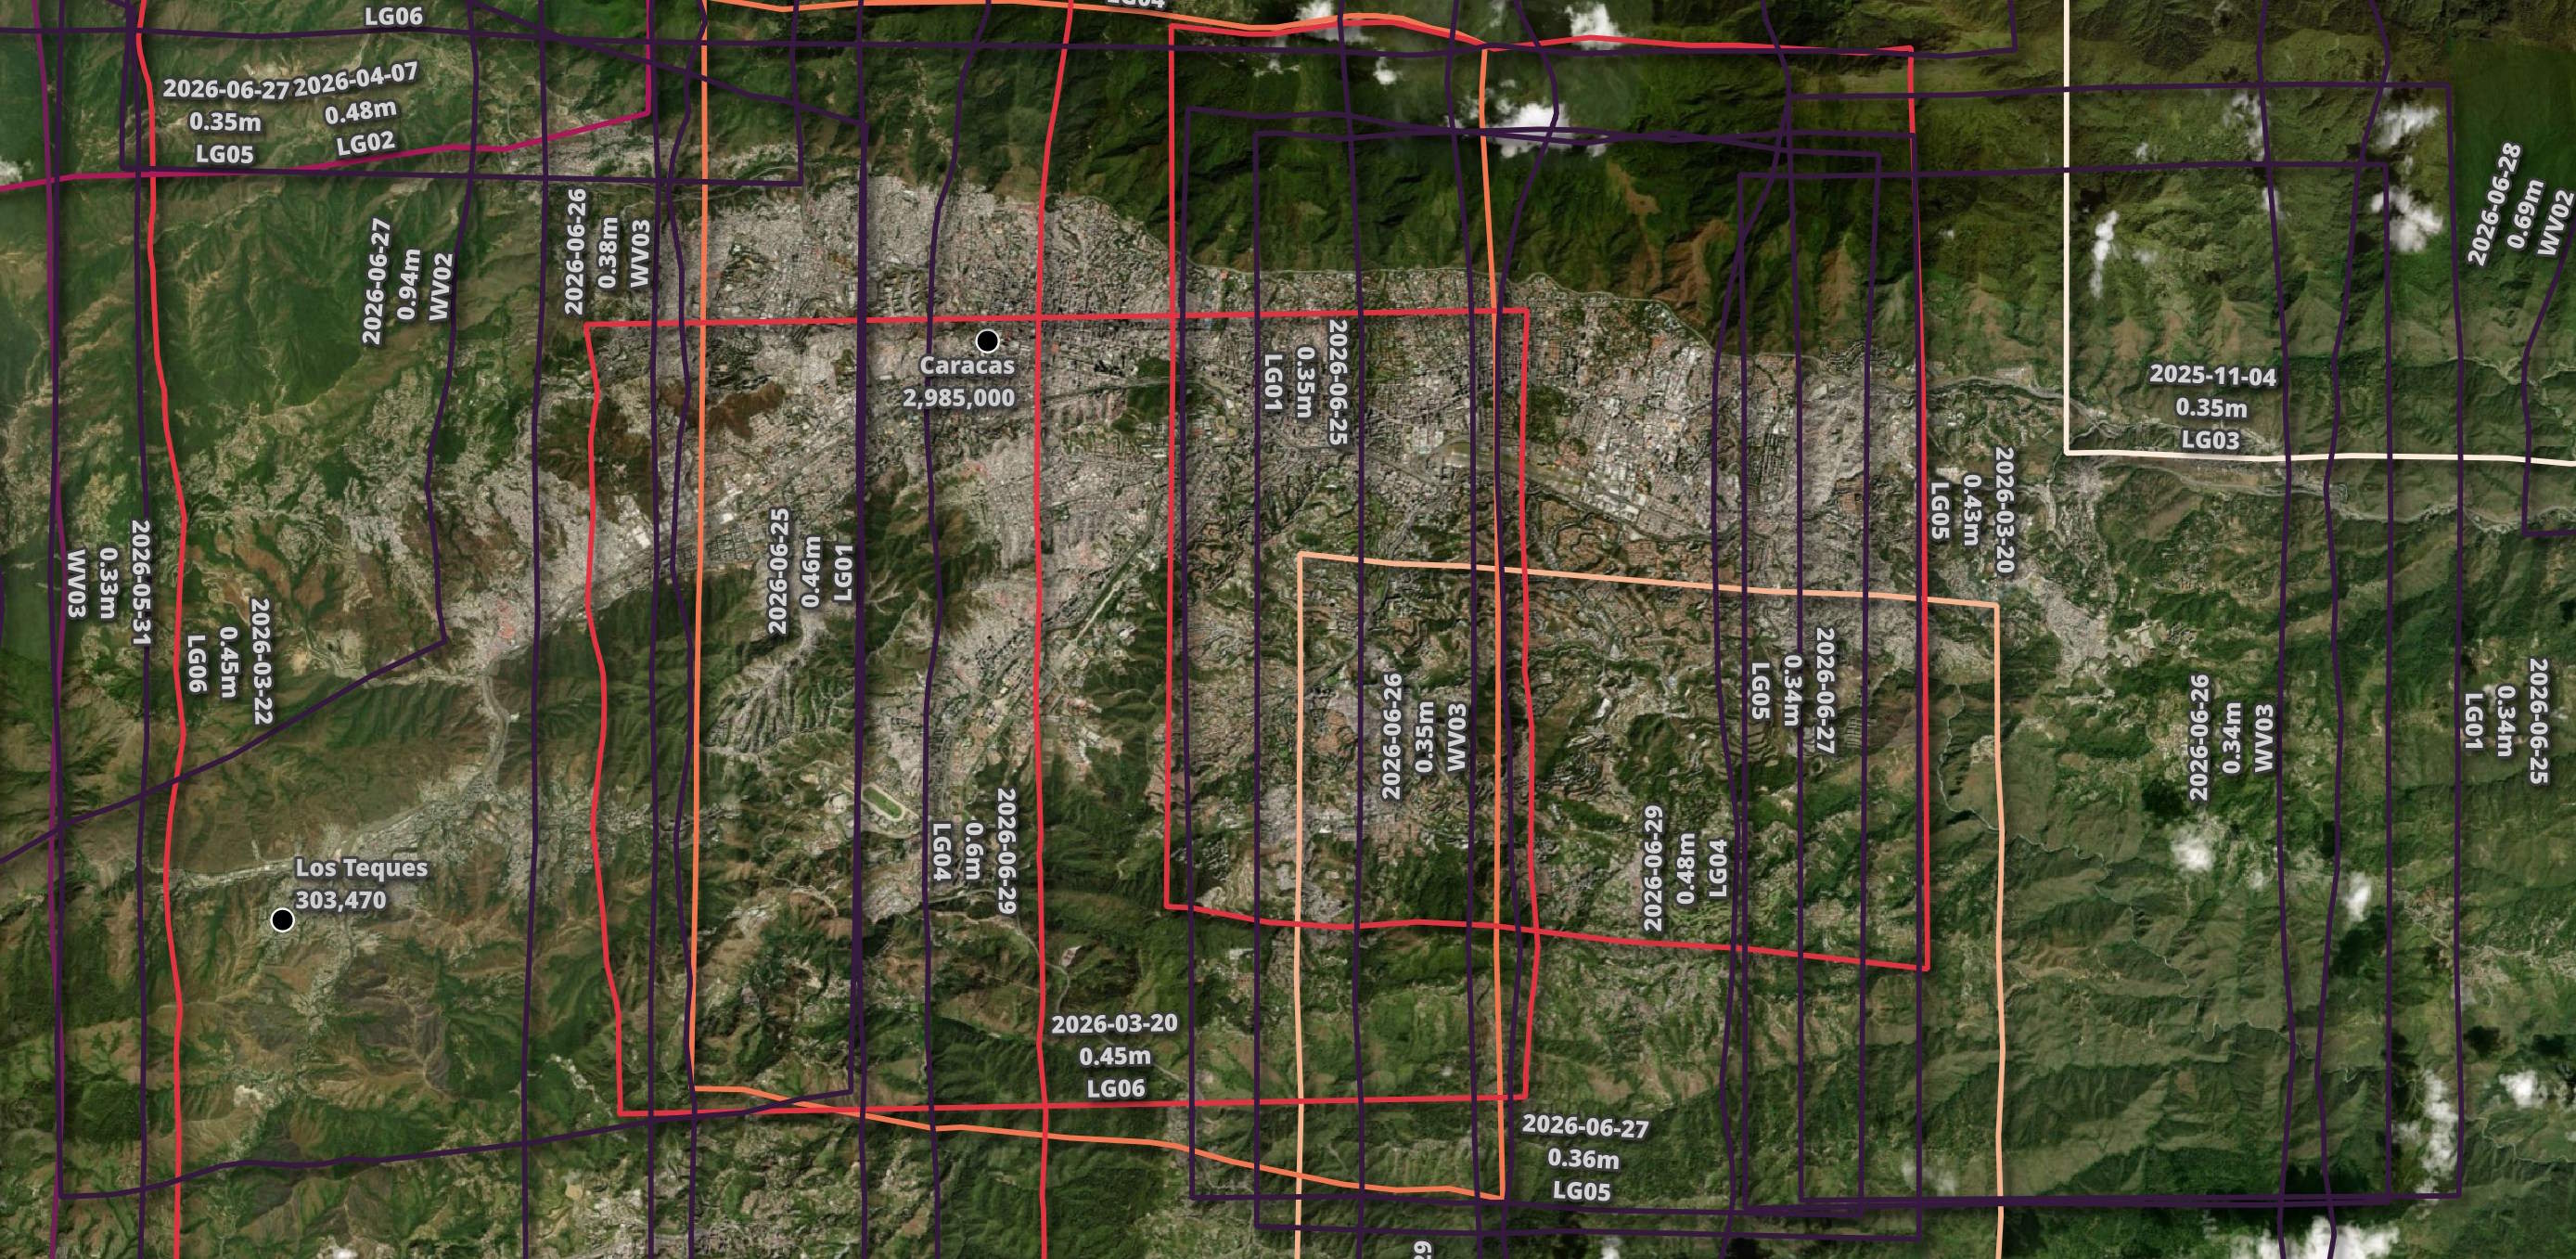
These are the images, surrounded by their footprints and labelled with their date of capture, the satellite used and their resolution. The orange basemap below them is from Bing.
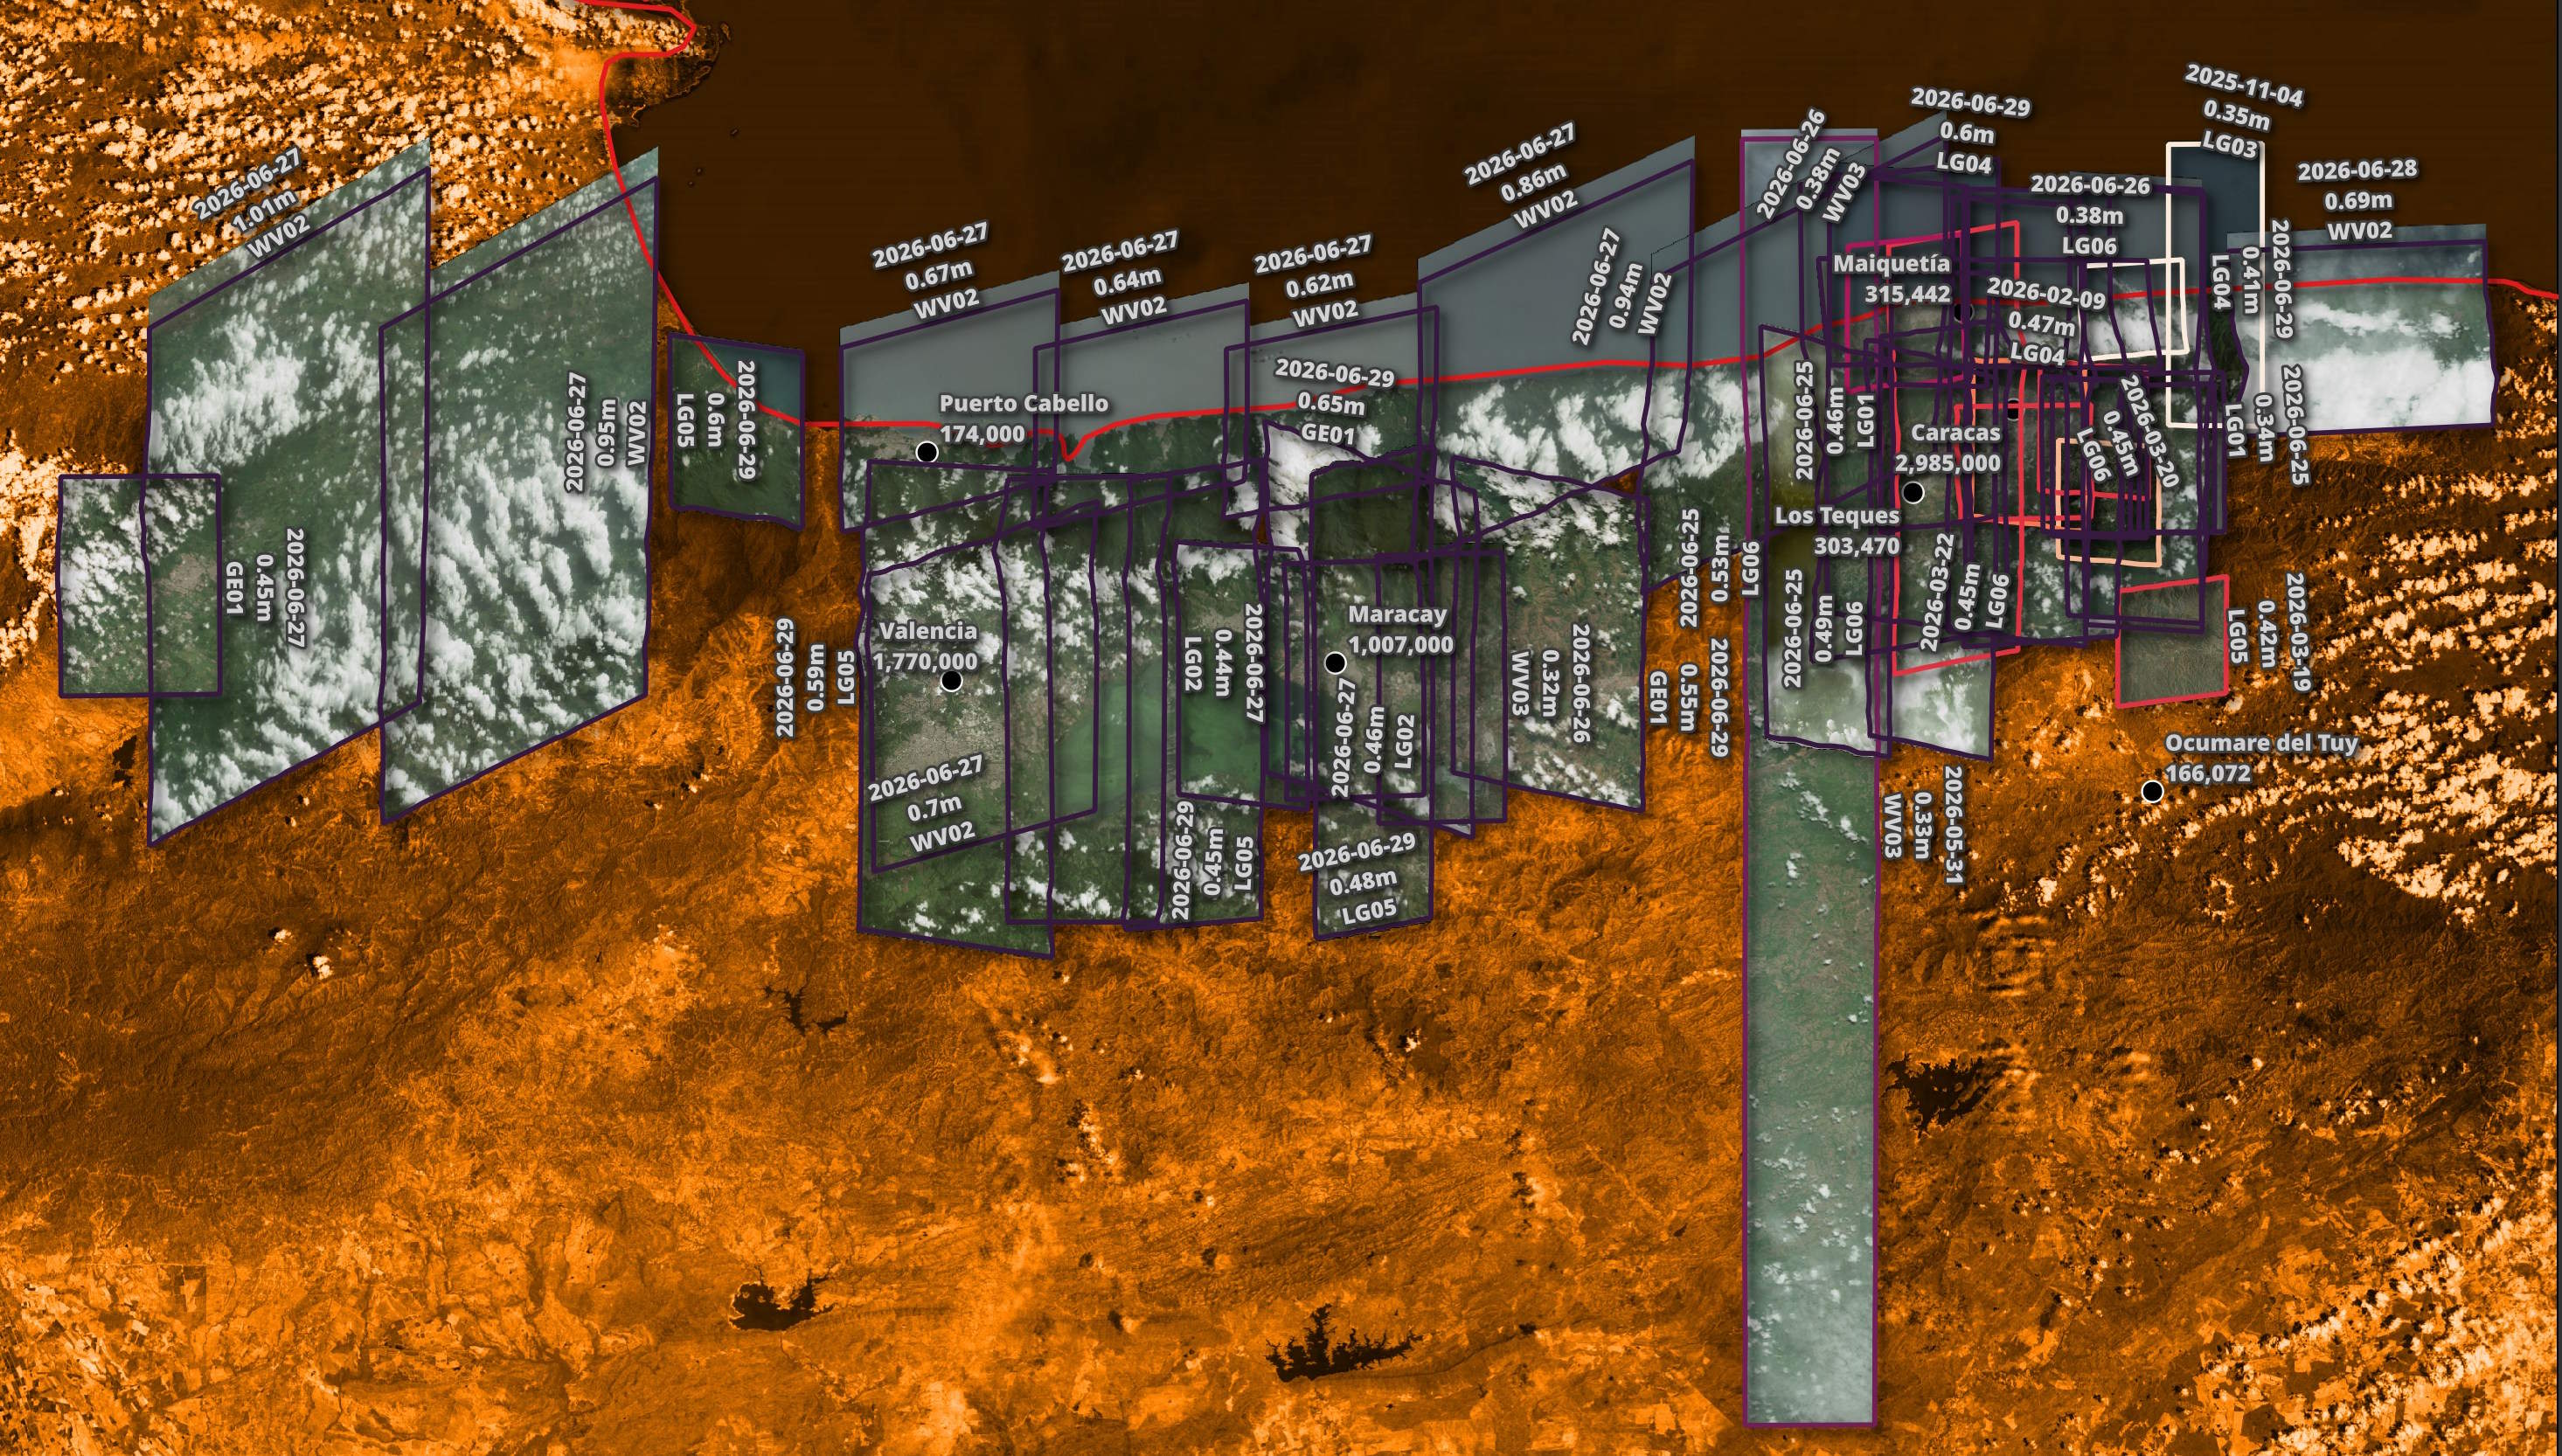
Caracas has a large amount of overlapping imagery. This is both recent as as well as historical imagery going back to November of last year. The basemap in this image is from Bing.
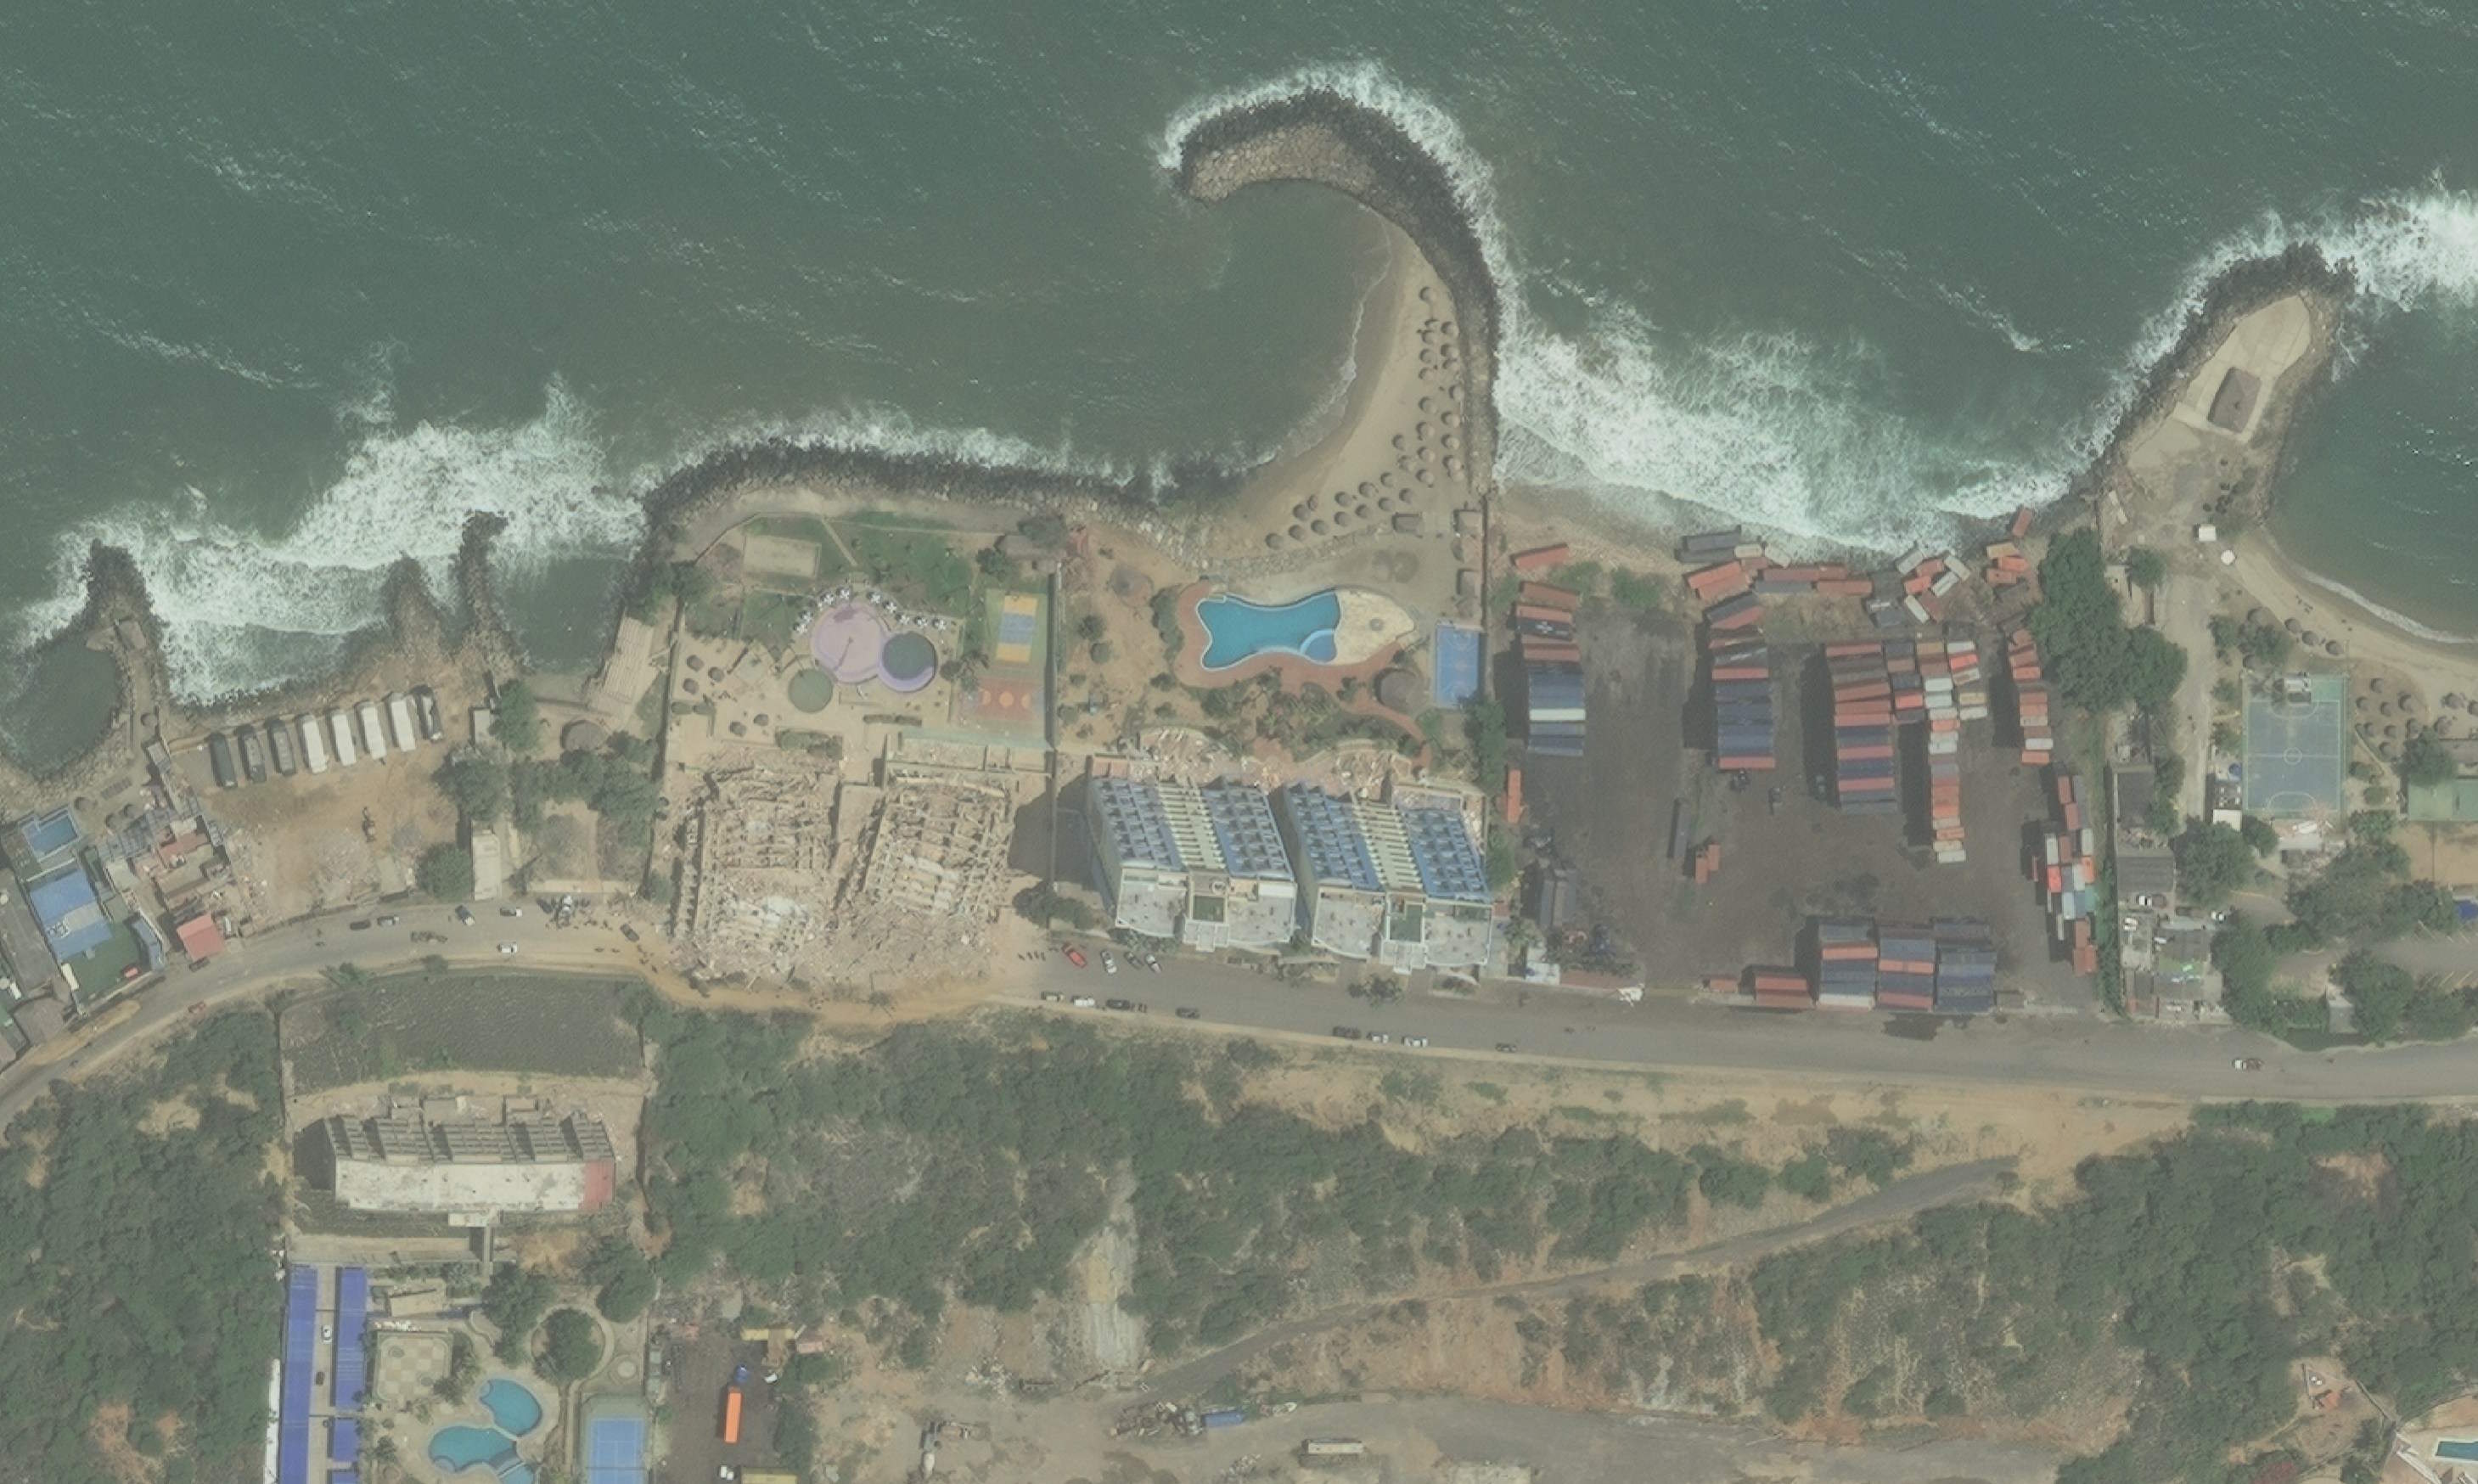
This is Vantor's image of La Guaira, Venezuela, taken on Saturday, showing two buildings that have collapsed and fallen shipping containers.
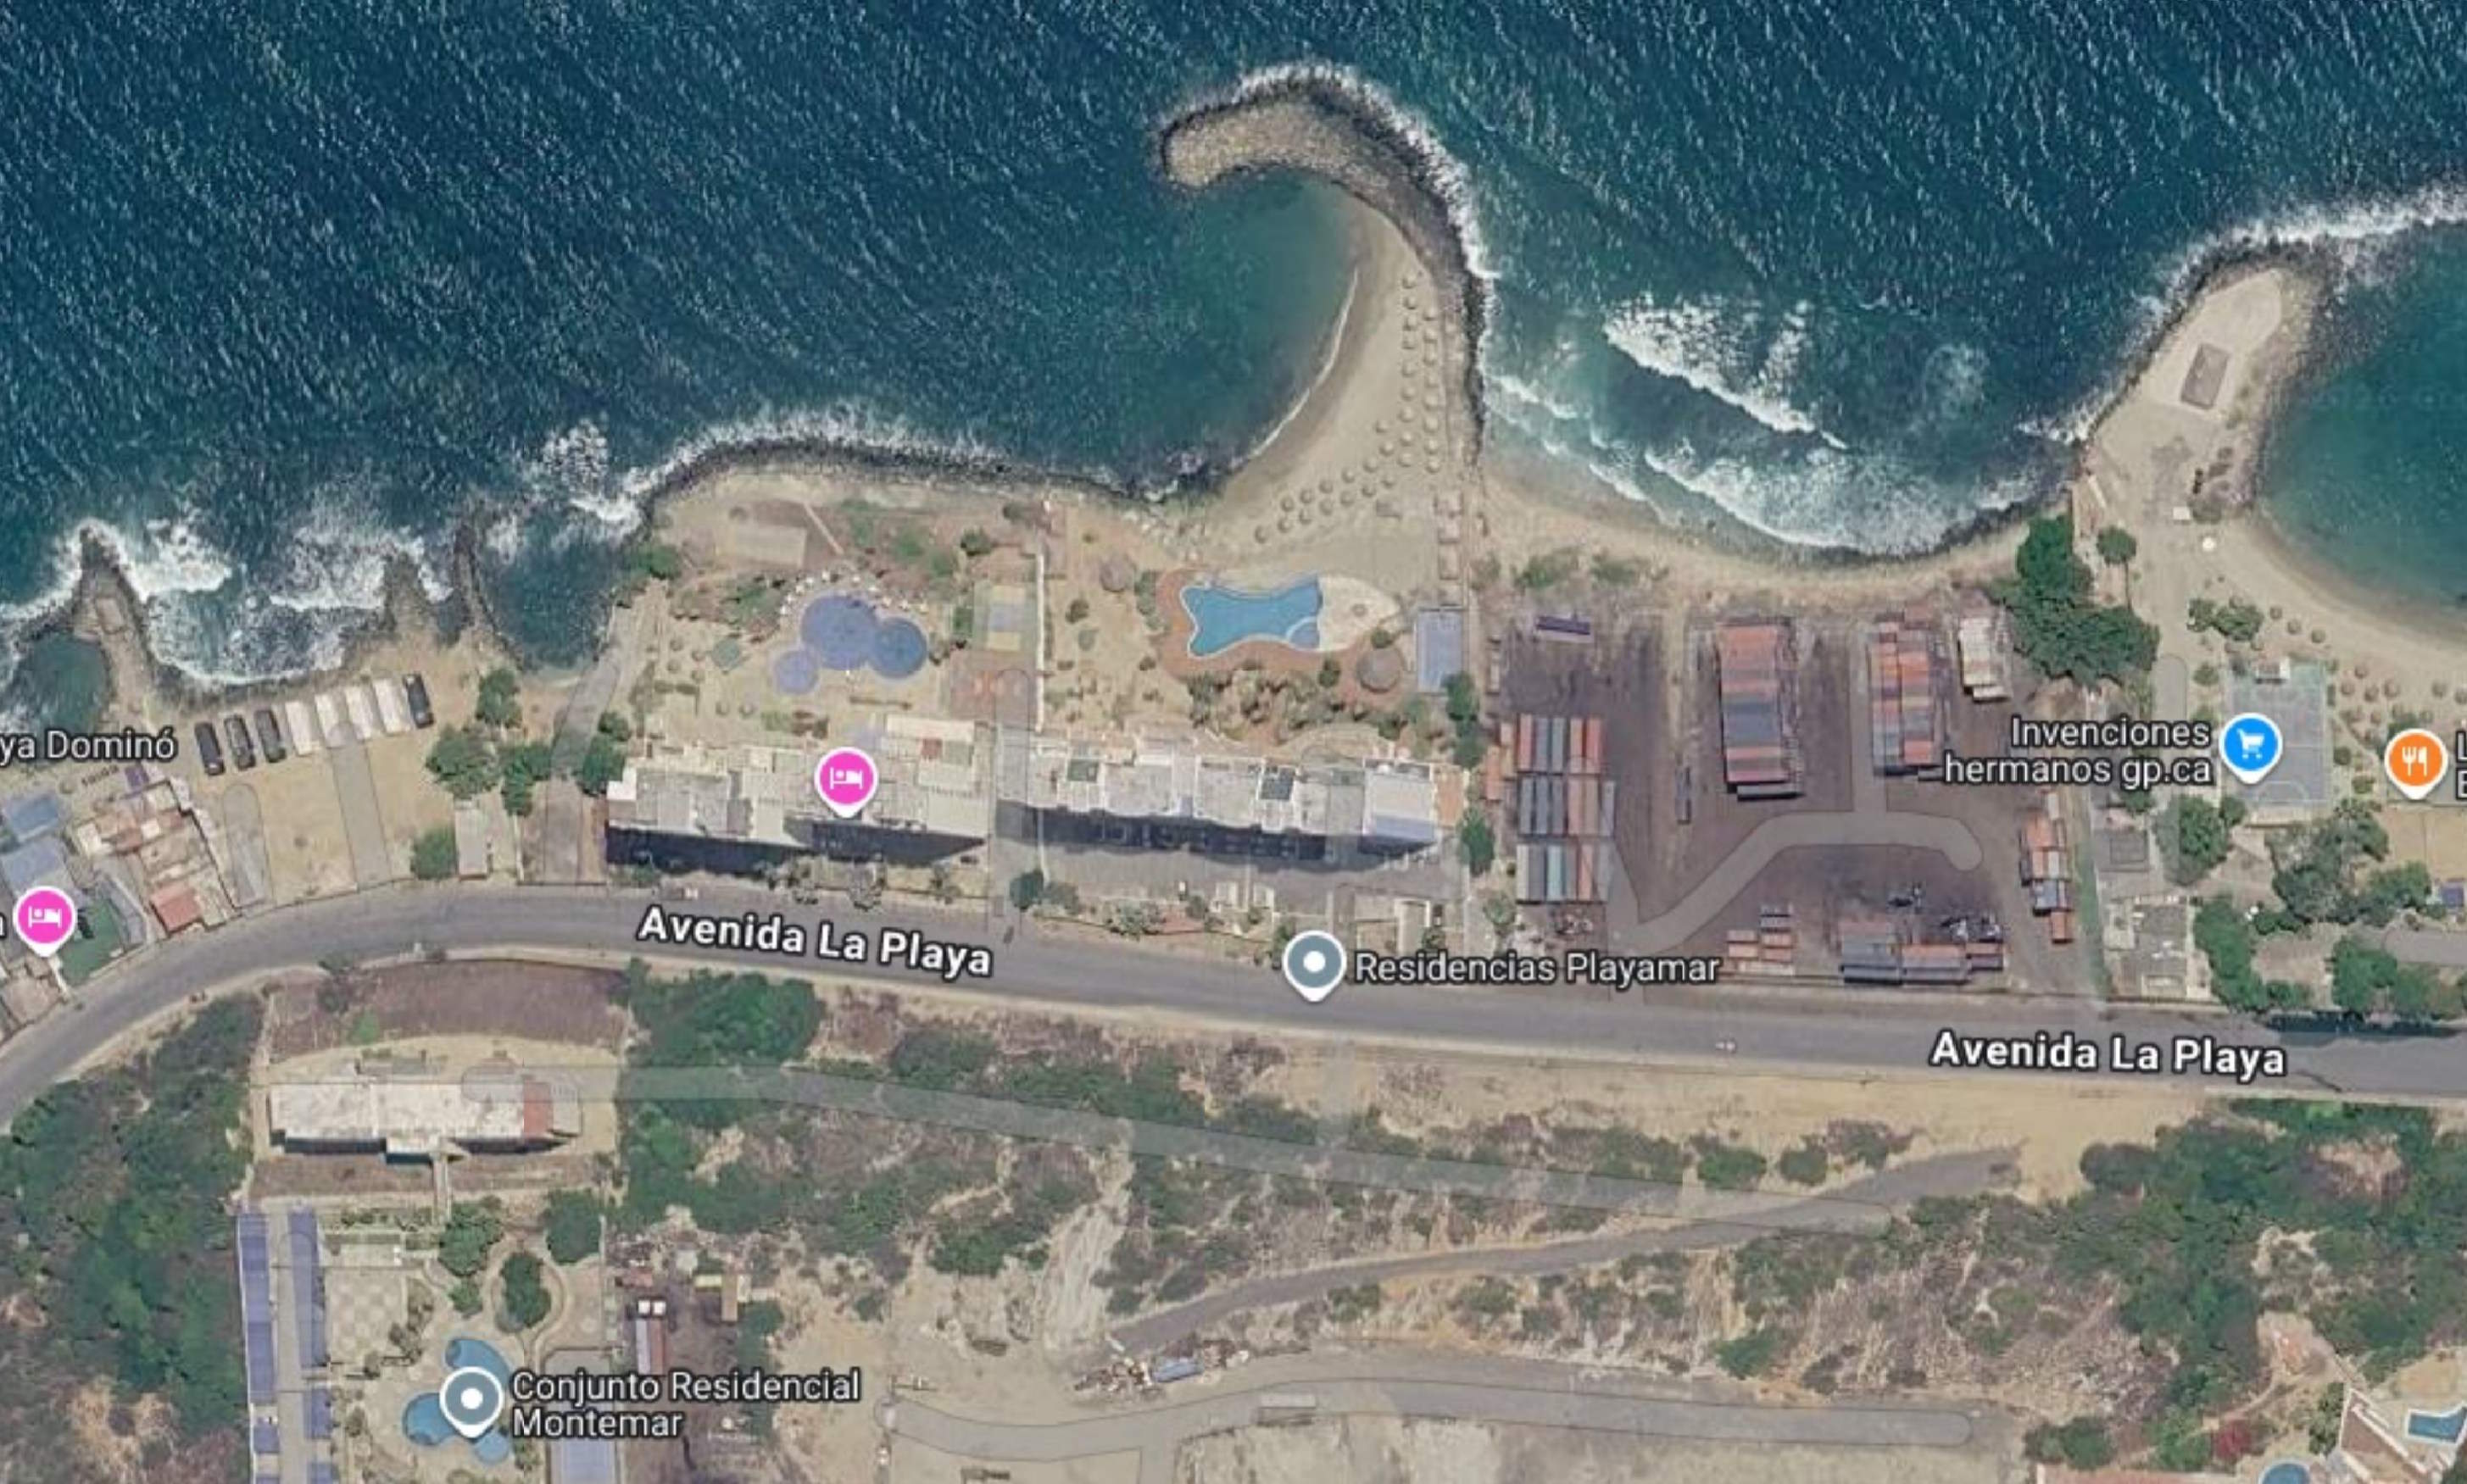
This is Google Maps' image of the same area prior to the earthquake.
Imagery Metadata
Every image in the bucket has metadata describing its publication URL, geometry, cloud cover amount and capture details.
$ echo "SELECT   * EXCLUDE(geometry)
        FROM     'venezuela.parquet'
        WHERE    vehicle_name = 'LG05'
        ORDER BY ingestion DESC
        LIMIT    1" \
    | ~/duckdb -json \
    | jq -S .
[
  {
    "assets": {
      "thumbnail": {
        "href": "https://vantor-opendata.s3.amazonaws.com/events/Venezuela-Earthquake-Jun-2026/B150001101891610.jpg",
        "roles": [
          "thumbnail"
        ],
        "title": "Thumbnail",
        "type": "image/jpeg"
      },
      "visual": {
        "href": "https://vantor-opendata.s3.amazonaws.com/events/Venezuela-Earthquake-Jun-2026/B150001101891610.tif",
        "roles": [
          "visual"
        ],
        "title": "Visual COG",
        "type": "image/tiff; application=geotiff; profile=cloud-optimized"
      }
    },
    "bbox": [
      -67.81007591272517,
      9.980551443627528,
      -67.67017456735171,
      10.45365034981712
    ],
    "collection": "Venezuela-Earthquake-Jun-2026",
    "constellation": "maxar",
    "datetime": "2026-06-29 13:15:31.124672",
    "eo:bands": [
      {
        "common_name": "red",
        "description": "Red",
        "name": "b1"
      },
      {
        "common_name": "green",
        "description": "Green",
        "name": "b2"
      },
      {
        "common_name": "blue",
        "description": "Blue",
        "name": "b3"
      }
    ],
    "eo:cloud_cover": 19,
    "id": "B150001101891610",
    "ingestion": "2026-06-29 15:13:25.733482",
    "license": "CC-BY-NC-4.0",
    "links": [
      {
        "href": "https://vantor-opendata.s3.amazonaws.com/events/Venezuela-Earthquake-Jun-2026/collection.json",
        "rel": "collection"
      },
      {
        "href": "https://vantor-opendata.s3.amazonaws.com/events/Venezuela-Earthquake-Jun-2026/B150001101891610.json",
        "rel": "self"
      },
      {
        "href": "https://vantor-opendata.s3.amazonaws.com/events/catalog.json",
        "rel": "root"
      }
    ],
    "multispectral_gsd": 1.81,
    "pan_gsd": 0.45,
    "scan_direction": "Forward",
    "stac_extensions": [
      "https://stac-extensions.github.io/eo/v1.0.0/schema.json",
      "https://stac-extensions.github.io/view/v1.0.0/schema.json",
      "https://stac-extensions.github.io/timestamps/v1.1.0/schema.json"
    ],
    "stac_version": "1.0.0",
    "title": "Vantor LG05 Image B150001101891610",
    "type": "Feature",
    "vehicle_name": "LG05",
    "view:azimuth": 249.38,
    "view:off_nadir": 32.89,
    "view:sun_azimuth": 68.06,
    "view:sun_elevation": 40.91
  }
]
These are the number of images taken by each satellite broken down by date within the Venezuelan dataset.
$ ~/duckdb
WITH a AS (
    SELECT   vehicle_name,
             ingestion: ingestion::DATE,
             cnt:       COUNT(*)
    FROM     'venezuela.parquet'
    WHERE    ingestion IS NOT NULL
    GROUP BY 1, 2
)
PIVOT    a
ON       vehicle_name
USING    SUM(cnt)
GROUP BY ingestion
ORDER BY ingestion;
┌────────────┬────────┬────────┬────────┬────────┬────────┬────────┬────────┬────────┬────────┐
│ ingestion  │  GE01  │  LG01  │  LG02  │  LG03  │  LG04  │  LG05  │  LG06  │  WV02  │  WV03  │
│    date    │ int128 │ int128 │ int128 │ int128 │ int128 │ int128 │ int128 │ int128 │ int128 │
├────────────┼────────┼────────┼────────┼────────┼────────┼────────┼────────┼────────┼────────┤
│ 2025-11-03 │   NULL │   NULL │   NULL │      1 │   NULL │   NULL │   NULL │   NULL │   NULL │
│ 2025-11-04 │   NULL │   NULL │   NULL │      1 │   NULL │   NULL │   NULL │   NULL │   NULL │
│ 2026-01-31 │   NULL │      1 │   NULL │   NULL │   NULL │   NULL │   NULL │   NULL │   NULL │
│ 2026-02-09 │   NULL │   NULL │   NULL │   NULL │      1 │   NULL │   NULL │   NULL │   NULL │
│ 2026-03-19 │   NULL │   NULL │   NULL │   NULL │   NULL │      1 │   NULL │   NULL │   NULL │
│ 2026-03-20 │   NULL │   NULL │   NULL │   NULL │   NULL │      1 │      1 │   NULL │   NULL │
│ 2026-03-22 │   NULL │   NULL │   NULL │   NULL │   NULL │   NULL │      1 │   NULL │   NULL │
│ 2026-04-07 │   NULL │   NULL │      1 │   NULL │   NULL │   NULL │   NULL │   NULL │   NULL │
│ 2026-05-31 │   NULL │   NULL │   NULL │   NULL │   NULL │   NULL │   NULL │   NULL │      1 │
│ 2026-06-25 │   NULL │      3 │   NULL │   NULL │   NULL │   NULL │      2 │   NULL │   NULL │
│ 2026-06-26 │   NULL │   NULL │   NULL │   NULL │   NULL │   NULL │      1 │   NULL │      4 │
│ 2026-06-27 │      1 │   NULL │      2 │   NULL │   NULL │      3 │   NULL │      8 │   NULL │
│ 2026-06-28 │   NULL │   NULL │   NULL │   NULL │   NULL │   NULL │   NULL │      1 │   NULL │
│ 2026-06-29 │      2 │   NULL │   NULL │   NULL │      3 │      5 │   NULL │   NULL │   NULL │
└────────────┴────────┴────────┴────────┴────────┴────────┴────────┴────────┴────────┴────────┘
On average, the images are published in less than 90 minutes after they've been captured.
SELECT   date_: datetime::DATE,
         avg:   AVG(ingestion - datetime)
FROM     'venezuela.parquet'
WHERE    datetime::DATE > '2026-06-01'::DATE
GROUP BY 1;
┌────────────┬─────────────────┐
│   date_    │       avg       │
│    date    │    interval     │
├────────────┼─────────────────┤
│ 2026-06-25 │ 01:10:55.982588 │
│ 2026-06-26 │ 01:27:05.014373 │
│ 2026-06-27 │ 01:22:05.239249 │
│ 2026-06-28 │ 01:14:24.743358 │
│ 2026-06-29 │ 01:31:45.537036 │
└────────────┴─────────────────┘
Cloud Cover
A key thing to remember with Vantor's electro-optical imagery is that it's affected by Clouds. Typically, 70% of all satellite imagery of this sort taken over land during the day will be obstructed by clouds to some degree.
These were the first five images Vantor published of Venezuela following the earthquake. There were parts where you could just about see the ground, but for the most part, the clouds got in the way of seeing anything else.