Maxar operates a fleet of satellites that capture imagery of the Earth. Some of these satellites offered the best resolution commercially available when they were first launched into space. Last year, Maxar earned ~$1.6B largely from selling imagery these satellites produced.
I found a price list for new images taken and it stated that each KM2 of imagery costs between $25 - $44. This could end up becoming an expensive hobby but thankfully Maxar also runs an Open Data Programme. In exchange for your contact details, you can get access to over 100 imagery sets taken in areas before and after they were struck by disasters.
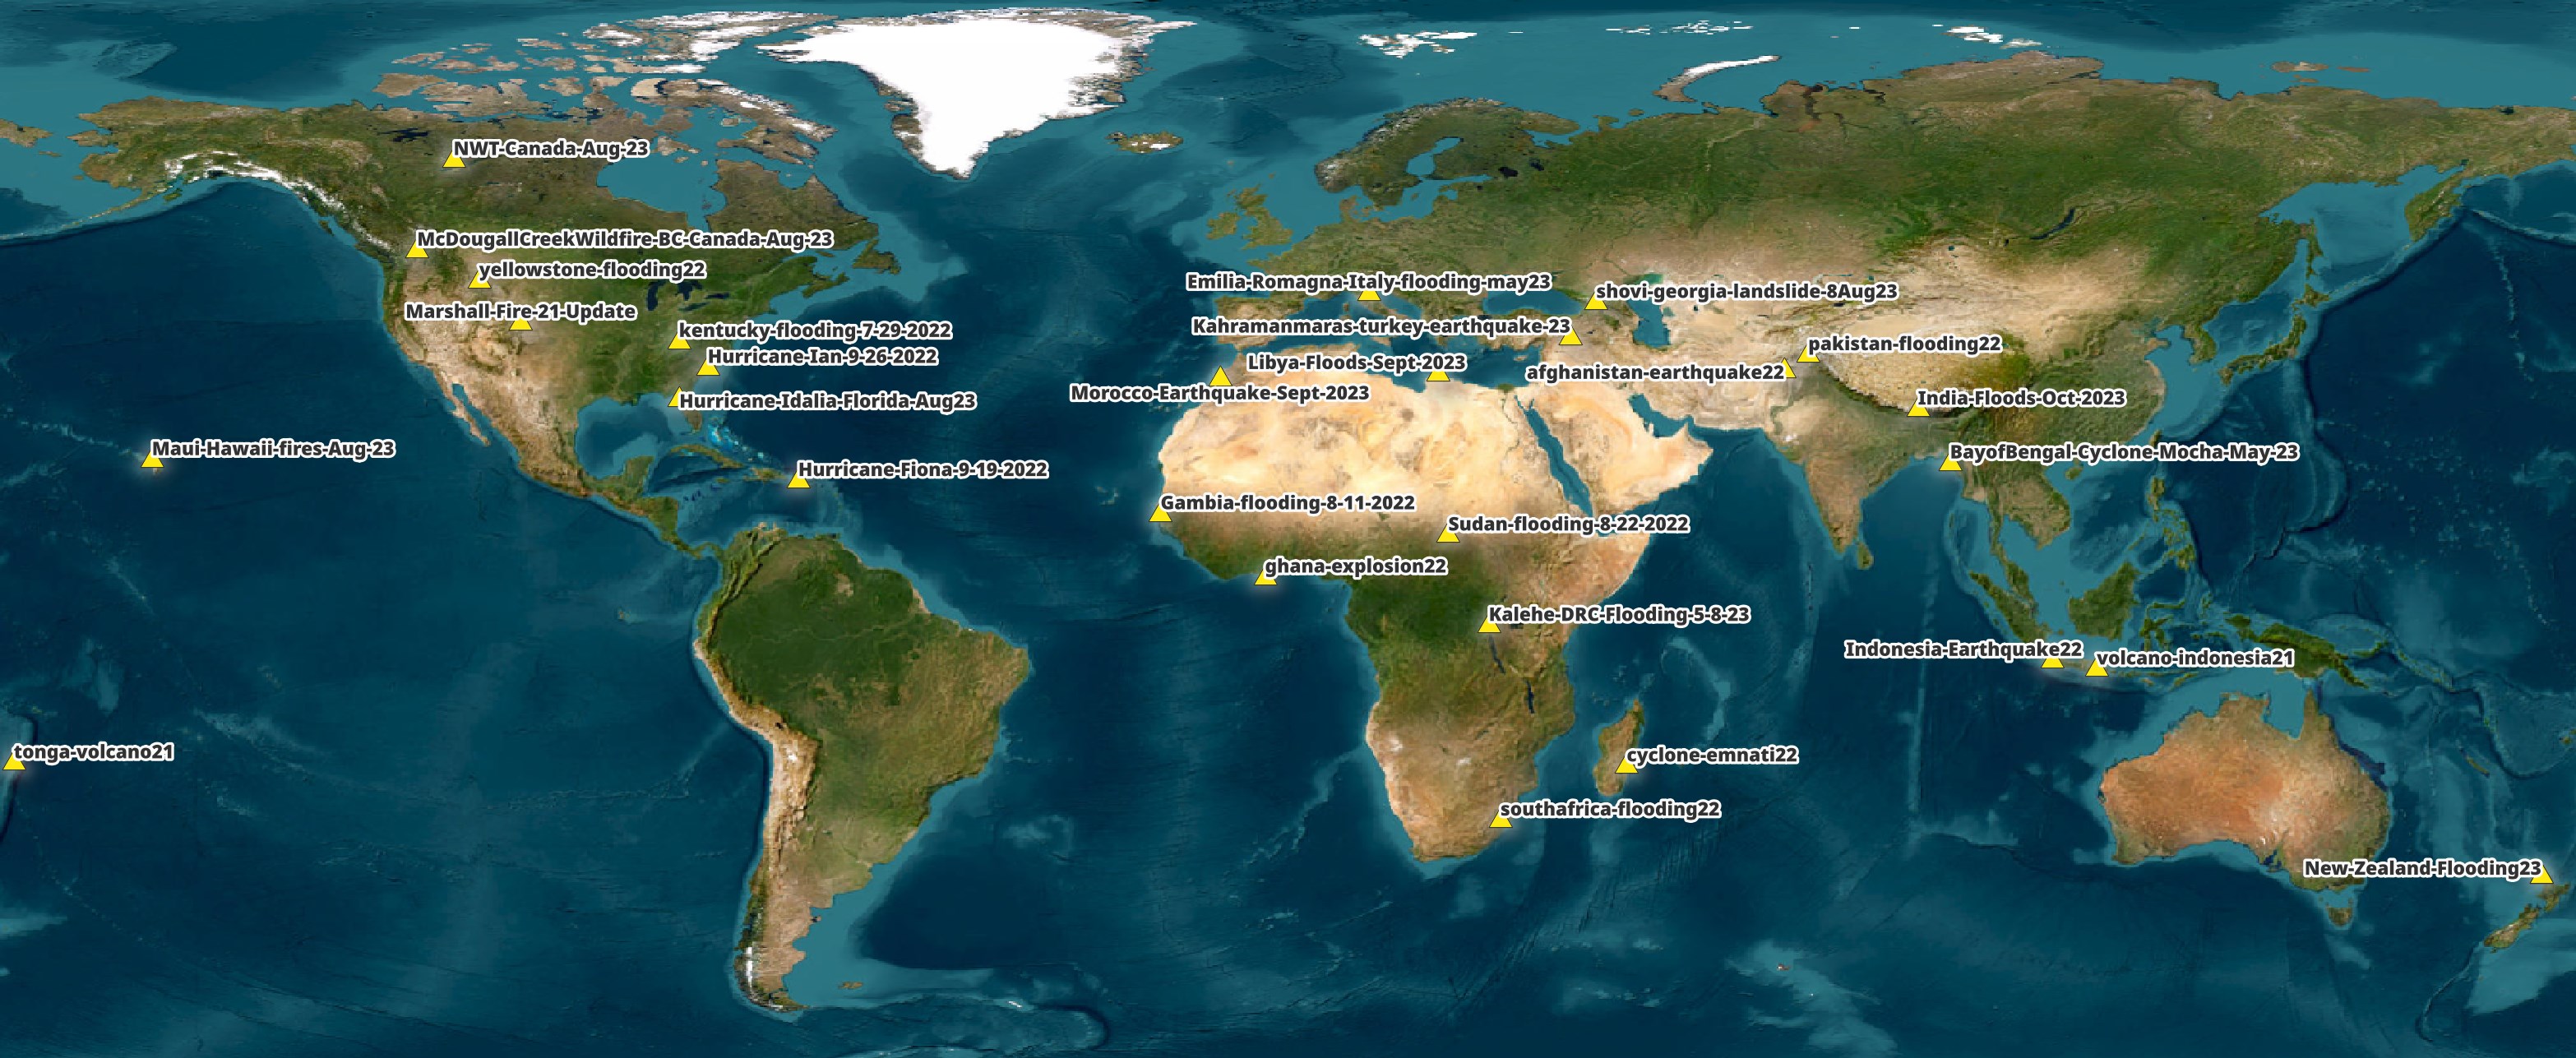
But for anyone unwilling to part with their contact information, there is a freely available SpatioTemporal Asset Catalog (STAC) published by Maxar that details imagery URLs and metadata for 28 disaster events. Below is a map of these locations and event details.
In this post, I'll download and examine Maxar's freely available satellite imagery.
Installing Prerequisites
The following was run on Ubuntu for Windows which is based on Ubuntu 20.04 LTS. The system is powered by an Intel Core i5 4670K running at 3.40 GHz and has 32 GB of RAM. The primary partition is a 2 TB Samsung 870 QVO SSD which will host the applications used in this post. The images will live on an 8 TB mechanical drive.
I'll be using GDAL and Python to help analyse the images in this post.
$ sudo apt update
$ sudo apt install \
    gdal-bin \
    jq \
    libtiff-tools \
    python3-pip \
    python3-virtualenv
I'll set up a Python Virtual Environment and install a few packages.
$ virtualenv ~/.maxar
$ source ~/.maxar/bin/activate
$ python -m pip install \
    rich \
    shapely \
    typer
I'll also use DuckDB, along with its JSON and Spatial extensions, in this post.
$ cd ~
$ wget -c https://github.com/duckdb/duckdb/releases/download/v0.9.1/duckdb_cli-linux-amd64.zip
$ unzip -j duckdb_cli-linux-amd64.zip
$ chmod +x duckdb
$ ~/duckdb
INSTALL json;
INSTALL spatial;
I'll set up DuckDB to load all these extensions each time it launches.
$ vi ~/.duckdbrc
.timer on
.width 180
LOAD json;
LOAD spatial;
The maps in this post were rendered with QGIS version 3.34. QGIS is a desktop application that runs on Windows, macOS and Linux.
I used QGIS' Tile+ plugin to add Esri's World Imagery Basemap to each of the map renderings. This basemap helps provide visual context around Maxar's imagery.
Downloading Satellite Imagery
Qiusheng Wu, an Associate Professor at the University of Tennessee manages a GitHub repository that contains metadata and manifests for the 28 image sets Maxar has made freely available. I'll clone this repo on my mechanical drive and create a downloads folder for the imagery.
$ git clone https://github.com/opengeos/maxar-open-data/
$ cd maxar-open-data
$ mkdir -p downloads
I've put together a script that will download all of the 'visual' images from Maxar's datasets. It contains a progress bar to give you an idea of how long the whole process will take.
If this script fails, it can be run again and it won't re-download any existing images, only ones not yet downloaded.
It will skip past certain errors and when the script has finished, you can run it again to re-try those URLs it wasn't able to download from already.
If new datasets are published, you can run git pull to get the new metadata and manifests and then run the download script again.
$ vi download.py
#!/usr/bin/env python3
# -*- coding: utf-8 -*-
from   glob     import glob
import json
from   os       import makedirs, path
from   random   import shuffle
import requests

from   rich.progress import track
import typer


app = typer.Typer(rich_markup_mode='rich')


@app.command()
def download(timeout: int = 60):
    geojsons = [x
                for x in glob('datasets/*.geojson')
                if 'union' not in x]
    shuffle(geojsons)

    for geojson in geojsons:
        print(geojson)
        recs = json.loads(open(geojson, 'r').read())

        urls = [x['properties']['visual']
                for x in recs['features']]
        shuffle(urls)

        folder = 'downloads/' + geojson.split('/')[-1].split('.')[0]

        try:
            makedirs(folder)
        except FileExistsError:
            pass

        for url in track(urls, description='Downloading..'):
            date = url.split('/')[-2]
            assert len(date) == len('YYYY-MM-DD')
            out_filename = 'ard' + url.split('/ard')[-1].replace('/', '_')
            output_path = '%s/%s/%s' % (folder, date, out_filename)

            try:
                makedirs(folder + '/' + date)
            except FileExistsError:
                pass

            if path.isfile(output_path):
                continue

            print(out_filename)

            try:
                r = requests.get(url, timeout=timeout)
            except Exception as exc:
                print(exc)
                continue

            with open(output_path, 'wb') as f:
                f.write(r.content)


if __name__ == "__main__":
    app()
$ python download.py
The script downloaded almost 1 TB worth of TIFFs. Here is the breakdown with file counts for each event.
  Size | Number of Files | Event
-------|-----------------|----------------------------------------
386 GB |           8,724 | Morocco-Earthquake-Sept-2023
164 GB |           4,207 | Hurricane-Ian-9-26-2022
101 GB |           2,549 | pakistan-flooding22
 80 GB |           2,024 | Kahramanmaras-turkey-earthquake-23
 38 GB |             933 | southafrica-flooding22
 29 GB |             677 | Hurricane-Idalia-Florida-Aug23
 29 GB |             794 | cyclone-emnati22
 19 GB |             395 | afghanistan-earthquake22
 13 GB |             339 | tonga-volcano21
 13 GB |             280 | yellowstone-flooding22
 11 GB |             284 | volcano-indonesia21
8.1 GB |             206 | BayofBengal-Cyclone-Mocha-May-23
8.1 GB |             245 | Emilia-Romagna-Italy-flooding-may23
8.0 GB |             274 | Hurricane-Fiona-9-19-2022
7.2 GB |             296 | ghana-explosion22
6.1 GB |             186 | Libya-Floods-Sept-2023
4.8 GB |             185 | kentucky-flooding-7-29-2022
3.5 GB |             246 | Maui-Hawaii-fires-Aug-23
3.4 GB |             124 | Indonesia-Earthquake22
2.8 GB |              86 | NWT-Canada-Aug-23
2.1 GB |              80 | Gambia-flooding-8-11-2022
1.5 GB |              57 | Sudan-flooding-8-22-2022
1.4 GB |              51 | India-Floods-Oct-2023
1.1 GB |              31 | McDougallCreekWildfire-BC-Canada-Aug-23
  1 GB |              37 | New-Zealand-Flooding23
598 MB |              24 | Kalehe-DRC-Flooding-5-8-23
446 MB |              18 | shovi-georgia-landslide-8Aug23
424 MB |              15 | Marshall-Fire-21-Update
The following naming convention was used for the images.
downloads/<event>/<date>/ard_<utm_zone>_<quadkey>_<date>_<catalog_id>-visual.tif
Cloud-Optimised GeoTIFFs
The TIFF files Maxar delivers are Cloud-Optimised GeoTIFF containers. The files contain Tiled Multi-Resolution TIFFs / Tiled Pyramid TIFFs. This means there are several versions of the same image at different resolutions within the TIFF file.
These files are structured so it's easy to only read a portion of a file for any one resolution you're interested in. A file might be 100 MB but a JavaScript-based Web Application might only need to download 2 MB of data from that file in order to render its lowest resolution.
Below I'll write a parser to convert the output from tiffinfo into JSON.
$ vi json_tiff.py
import json
import re
import sys


stack, stack_id = {}, None

for line in sys.stdin.read().splitlines():
    if not stack_id:
        stack_id = 1
    elif line.startswith('TIFF Directory'):
        stack_id = stack_id + 1
    elif line.startswith('  ') and line.count(':') == 1:
        if stack_id not in stack.keys():
            stack[stack_id] = {'stack_num': stack_id}

        x, y = line.strip().split(':')

        if len(x) > 1 and not x.startswith('Tag ') and y and len(str(y).strip()) > 1:
            stack[stack_id][x.strip()] = y.strip()
    elif line.startswith('  ') and line.count(':') == 2 and 'Image Width' in line:
        if stack_id not in stack.keys():
            stack[stack_id] = {'stack_num': stack_id}

        _, width, _, _, _ = re.split('([0-9]*)', line)
        stack[stack_id]['width'] = int(width.strip())

print(json.dumps([y for x, y in stack.items()], indent=4, sort_keys=True))
The following will produce a JSON file with the metadata of one of Maxar's TIFFs.
$ tiffinfo -i downloads/BayofBengal-Cyclone-Mocha-May-23/2023-01-03/ard_46_033113111121_2023-01-03_104001007EBB7C00-visual.tif \
    | python json_tiff.py \
    > metadata.json
I'll use DuckDB to cherry-pick a few columns of interest.
$ ~/duckdb
SELECT stack_num,
       "Compression Scheme",
       "Photometric Interpretation",
       "width"
FROM READ_JSON('metadata.json',
               auto_detect=true)
ORDER BY 2 DESC,
         4 DESC;
┌───────────┬────────────────────┬────────────────────────────┬───────┐
│ stack_num │ Compression Scheme │ Photometric Interpretation │ width │
│   int64   │      varchar       │          varchar           │ int64 │
├───────────┼────────────────────┼────────────────────────────┼───────┤
│         1 │ JPEG               │ YCbCr                      │ 17408 │
│         3 │ JPEG               │ YCbCr                      │  8704 │
│         4 │ JPEG               │ YCbCr                      │  4352 │
│         5 │ JPEG               │ YCbCr                      │  2176 │
│         6 │ JPEG               │ YCbCr                      │  1088 │
│         7 │ JPEG               │ YCbCr                      │   544 │
│         8 │ JPEG               │ YCbCr                      │   272 │
│         2 │ AdobeDeflate       │ transparency mask          │ 17408 │
│         9 │ AdobeDeflate       │ transparency mask          │  8704 │
│        10 │ AdobeDeflate       │ transparency mask          │  4352 │
│        11 │ AdobeDeflate       │ transparency mask          │  2176 │
│        12 │ AdobeDeflate       │ transparency mask          │  1088 │
│        13 │ AdobeDeflate       │ transparency mask          │   544 │
│        14 │ AdobeDeflate       │ transparency mask          │   272 │
├───────────┴────────────────────┴────────────────────────────┴───────┤
│ 14 rows                                                   4 columns │
└─────────────────────────────────────────────────────────────────────┘
Within the TIFF, the original JPEG's image width is 17,408 pixels wide. There are 6 subsequent images each roughly half the width of their parent image. There is also an alpha channel with 6 alternative widths as well.
Maxar's Satellite Fleet
Four of Maxar's Satellites have provided the imagery available in these image sets. Every image's metadata contains the platform / satellite name used to take the photo.
GeoEye-1 (GE01) was built by General Dynamics and launched by Boeing in 2008. It was expected to run for 7 years but it is still running to this day, 15 years later. It's located 673 KM above the Earth's surface and can capture 41 cm panchromatic imagery and 165 cm multispectral imagery.
WorldView-2 (WV02) was built by Ball Aerospace and launched by Boeing in 2009. It was expected to run for ~7 years but it is still running to this day, 14 years later. It's located 772 KM above the Earth's surface and can capture 46 cm panchromatic imagery and 184 cm eight-band multispectral imagery. It can take a photograph of anywhere on early every 1.1 days. This satellite was hit by space debris in 2016 but Maxar deemed the damage to be minimal.
WorldView-3 (WV03) was built by Ball Aerospace and launched by Lockheed Martin in 2014. It was expected to run for ~7 years but it is still running to this day, 9 years later. It's located 619 KM above the Earth's surface and can capture 31 cm panchromatic imagery, 124 cm eight-band multispectral imagery, 370 cm short wave infrared imagery and 3000 cm CAVIS (Clouds, Aerosols, Vapors, Ice, and Snow) data imagery. This satellite took a photo of the Landsat 8 satellite last year.
WorldView-4 (WV04) was built by Lockheed Martin and launched in 2016. In 2019, it failed and it re-entered the Earth's Atmosphere over New Zealand in late 2021. It was located 613 KM above the Earth's surface and could capture 31 cm panchromatic imagery, 124 cm multispectral imagery, 450-800 nm panchromatic wavelengths and 450-920 nm multispectral imagery.
Imagery Metadata
Below I'll combine all of the GeoJSON files of interest within this repository into a single JSON file. I've added fields for the event name and a Well-Known Text (WKT) version of each image's footprint as well.
$ python3
from   glob import glob
import json

from   shapely import wkt
from   shapely.geometry import shape


recs = [json.loads(open(x).read())
        for x in glob('datasets/*/*.geojson')
        if 'union' not in x]
out = []

for rec in recs:
    for f in rec['features']:
        out.append({**{x: y
                       for x, y in f['properties'].items()
                       if type(y) is not dict},
                    **{'event': f['properties']['visual'].split('/')[4],
                       'geom': wkt.dumps(shape(f['geometry']),
                                         rounding_precision=6)}})

open('aggregate.json', 'w').write(json.dumps(out))
The above produced a 23,171-record, 20 MB JSON file. Below is the first record from the JSON file.
$ jq -S .[0] aggregate.json
{
  "ard_metadata_version": "0.0.1",
  "catalog_id": "10300100BFCFAF00",
  "datetime": "2021-06-09T06:15:12Z",
  "event": "afghanistan-earthquake22",
  "geom": "POLYGON ((69.485045 33.301741, 69.446585 33.301885, 69.447000 33.308154, 69.447123 33.313497, 69.446776 33.318709, 69.446804 33.321349, 69.485154 33.321349, 69.485045 33.301741))",
  "grid:code": "MXRA-Z42-120200023220",
  "gsd": 0.54,
  "platform": "WV02",
  "proj:bbox": "541575.6225585938,3684843.75,545156.25,3687068.0077917213",
  "proj:epsg": 32642,
  "quadkey": "120200023220",
  "tile:clouds_area": 0,
  "tile:clouds_percent": 0,
  "tile:data_area": 7.8,
  "utm_zone": 42,
  "view:azimuth": 199.7,
  "view:incidence_angle": 63.9,
  "view:off_nadir": 23.1,
  "view:sun_azimuth": 120.9,
  "view:sun_elevation": 72.3,
  "visual": "https://maxar-opendata.s3.amazonaws.com/events/afghanistan-earthquake22/ard/42/120200023220/2021-06-09/10300100BFCFAF00-visual.tif"
}
I'll load it into DuckDB.
$ ~/duckdb maxar.duckdb
CREATE TABLE maxar AS
    SELECT * EXCLUDE(geom),
           ST_GEOMFROMTEXT(geom) geom
    FROM READ_JSON('aggregate.json',
                   auto_detect=true);
There are cloud cover measurements for each image. There could be many images of the same area and sometimes this can be a handy value to help pick which imagery to work with.
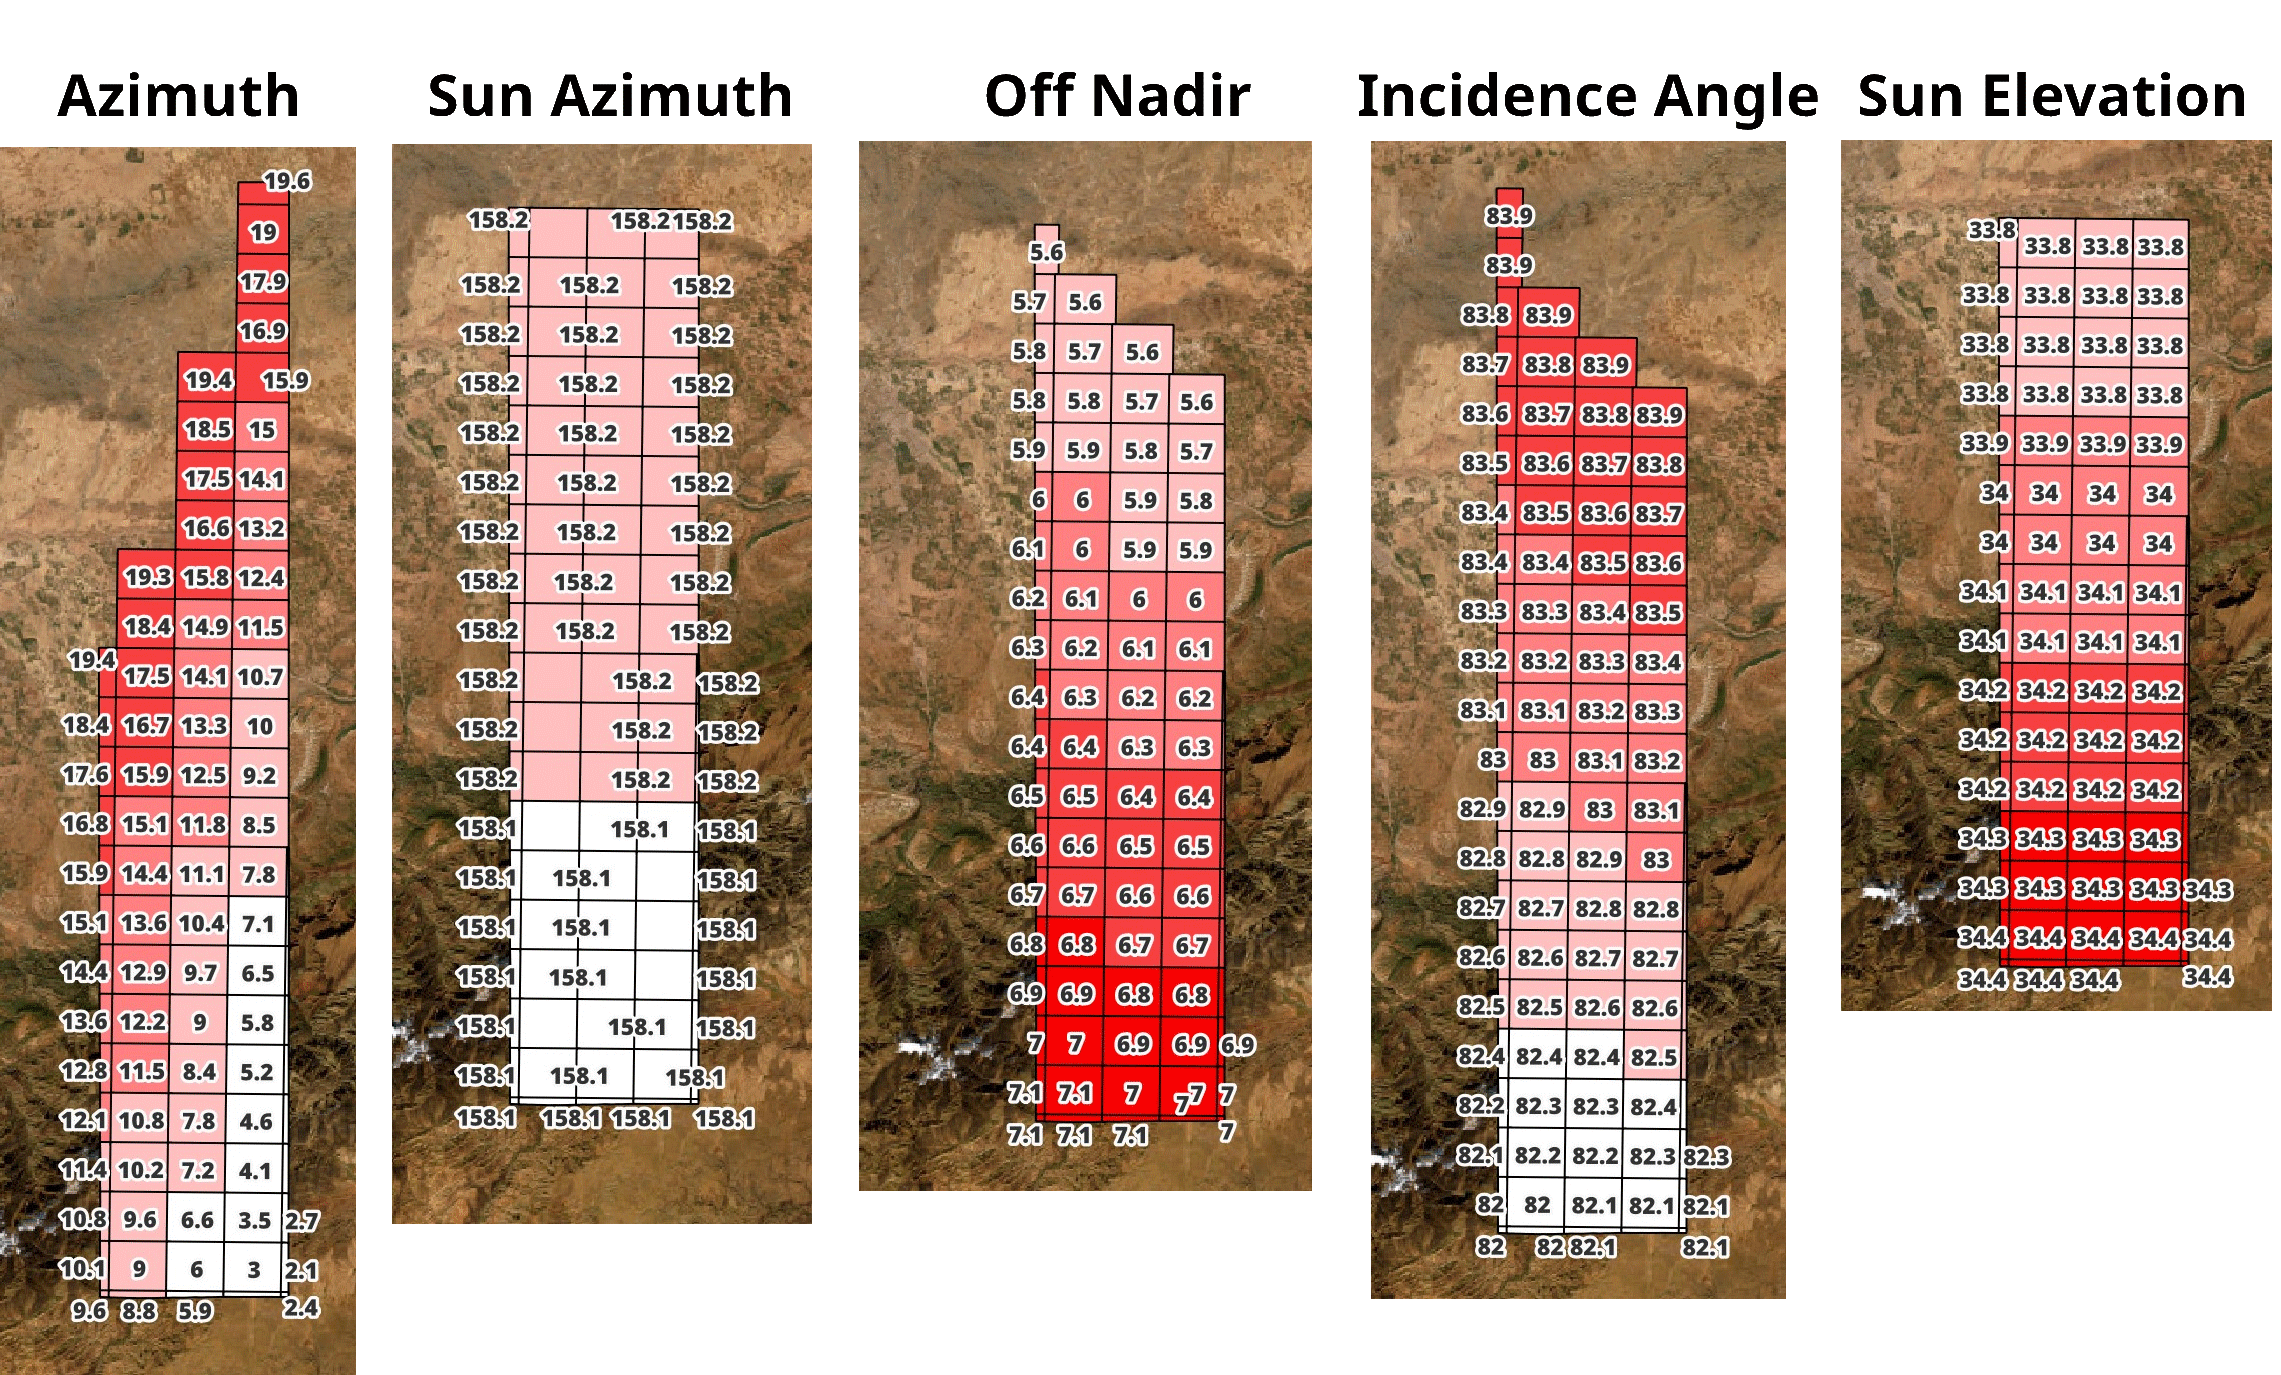
"Off Nadir" is the satellite's angle in relation to the ground. The larger the angle, the more pixels get stretched so there is a relationship between this value and how useable the resulting image is.
Azimuth / direction and elevation indicate the satellite's position above the ground.
The incidence angle is calculated from the target position on the ground looking at the direction of the satellite in the sky. This value combines the pitch and roll angles.
Below I've cherry-picked some images taken at the same time next to one another and applied heatmaps to these values.
Below is the average cloud cover percentage by satellite by year. Maxar does a good job of sourcing near-cloudless images of areas prior to their respective disaster events.
WITH a AS (
    SELECT YEAR(datetime) AS year,
           AVG("tile:clouds_percent") FILTER (WHERE platform = 'GE01') AS GE01,
           AVG("tile:clouds_percent") FILTER (WHERE platform = 'WV02') AS WV02,
           AVG("tile:clouds_percent") FILTER (WHERE platform = 'WV03') AS WV03,
           AVG("tile:clouds_percent") FILTER (WHERE platform = 'WV04') AS WV04
    FROM maxar
    GROUP BY 1
    ORDER BY 1)
SELECT year,
       ROUND(GE01, 1) GE01,
       ROUND(WV02, 1) WV02,
       ROUND(WV03, 1) WV03,
       ROUND(WV04, 1) WV04
FROM a;
┌───────┬────────┬────────┬────────┬────────┐
│ year  │  GE01  │  WV02  │  WV03  │  WV04  │
│ int64 │ double │ double │ double │ double │
├───────┼────────┼────────┼────────┼────────┤
│  2010 │        │    0.0 │        │        │
│  2011 │    0.0 │    5.4 │        │        │
│  2012 │        │    0.0 │        │        │
│  2013 │        │    0.0 │        │        │
│  2014 │        │    1.7 │        │        │
│  2015 │    0.0 │        │    2.0 │        │
│  2016 │        │    8.6 │        │        │
│  2017 │    6.4 │    0.0 │    1.1 │        │
│  2018 │    0.0 │    3.2 │    4.3 │    0.0 │
│  2019 │    6.3 │    2.0 │    1.8 │        │
│  2020 │    6.9 │    1.8 │    3.3 │        │
│  2021 │   15.6 │    4.0 │    1.0 │        │
│  2022 │   11.1 │    5.7 │    6.2 │        │
│  2023 │    5.8 │    3.3 │    5.1 │        │
├───────┴────────┴────────┴────────┴────────┤
│ 14 rows                         5 columns │
└───────────────────────────────────────────┘
13 years x 4 Satellites
Below are the number of images per year that were produced by each satellite in this dataset.
$ ~/duckdb maxar.duckdb
SELECT YEAR(datetime) AS year,
       COUNT(*) FILTER (WHERE platform = 'GE01') AS GE01,
       COUNT(*) FILTER (WHERE platform = 'WV02') AS WV02,
       COUNT(*) FILTER (WHERE platform = 'WV03') AS WV03,
       COUNT(*) FILTER (WHERE platform = 'WV04') AS WV04
FROM maxar
GROUP BY 1
ORDER BY 1;
┌───────┬───────┬───────┬───────┬───────┐
│ year  │ GE01  │ WV02  │ WV03  │ WV04  │
│ int64 │ int64 │ int64 │ int64 │ int64 │
├───────┼───────┼───────┼───────┼───────┤
│  2010 │     0 │   133 │     0 │     0 │
│  2011 │     5 │    41 │     0 │     0 │
│  2012 │     0 │    44 │     0 │     0 │
│  2013 │     0 │   121 │     0 │     0 │
│  2014 │     0 │   217 │     0 │     0 │
│  2015 │    32 │     0 │    94 │     0 │
│  2016 │     0 │    75 │     0 │     0 │
│  2017 │   205 │   118 │    78 │     0 │
│  2018 │    88 │   250 │   770 │   248 │
│  2019 │   152 │   238 │   773 │     0 │
│  2020 │   168 │   281 │   471 │     0 │
│  2021 │   512 │  1038 │   752 │     0 │
│  2022 │  1949 │  4930 │  3033 │     0 │
│  2023 │   774 │  2484 │  1743 │     0 │
├───────┴───────┴───────┴───────┴───────┤
│ 14 rows                     5 columns │
└───────────────────────────────────────┘
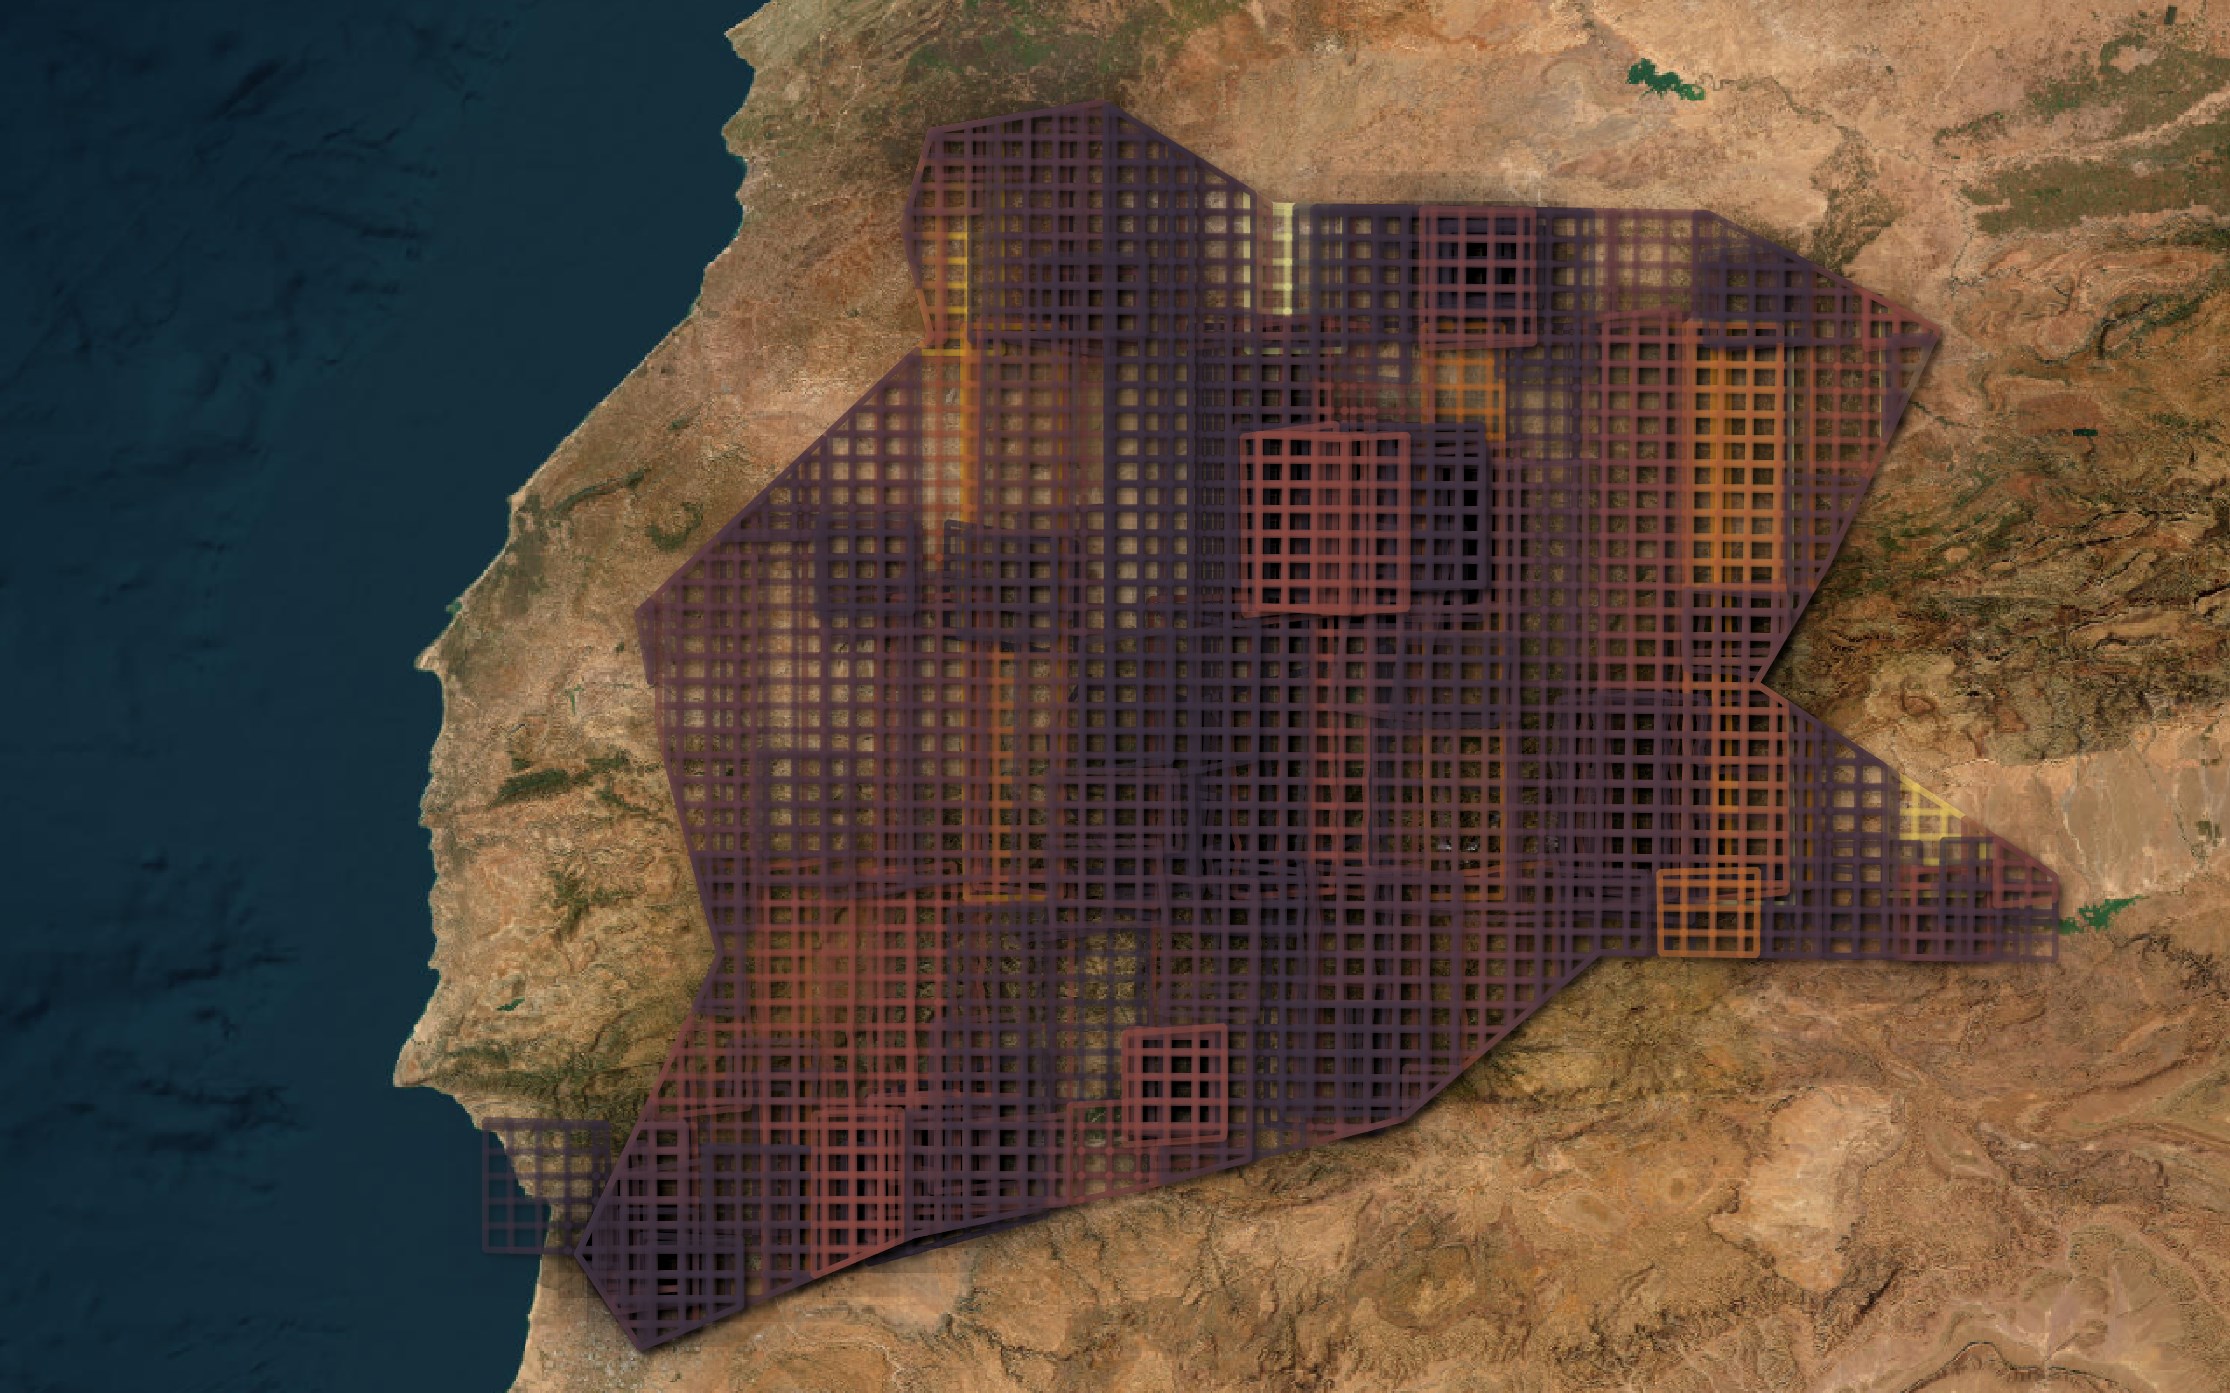
Within any one event's dataset, there can be imagery from multiple years and multiple satellites. The Moroccan dataset is 386 GB and has 8,700 images taken by four satellites at different times over a 13-year period.
Below I've coloured the image footprints by year using the following expression in QGIS.
ramp_color('Wiener Challah', (2023 - to_int(substr("datetime", 1, 4))) / 13)
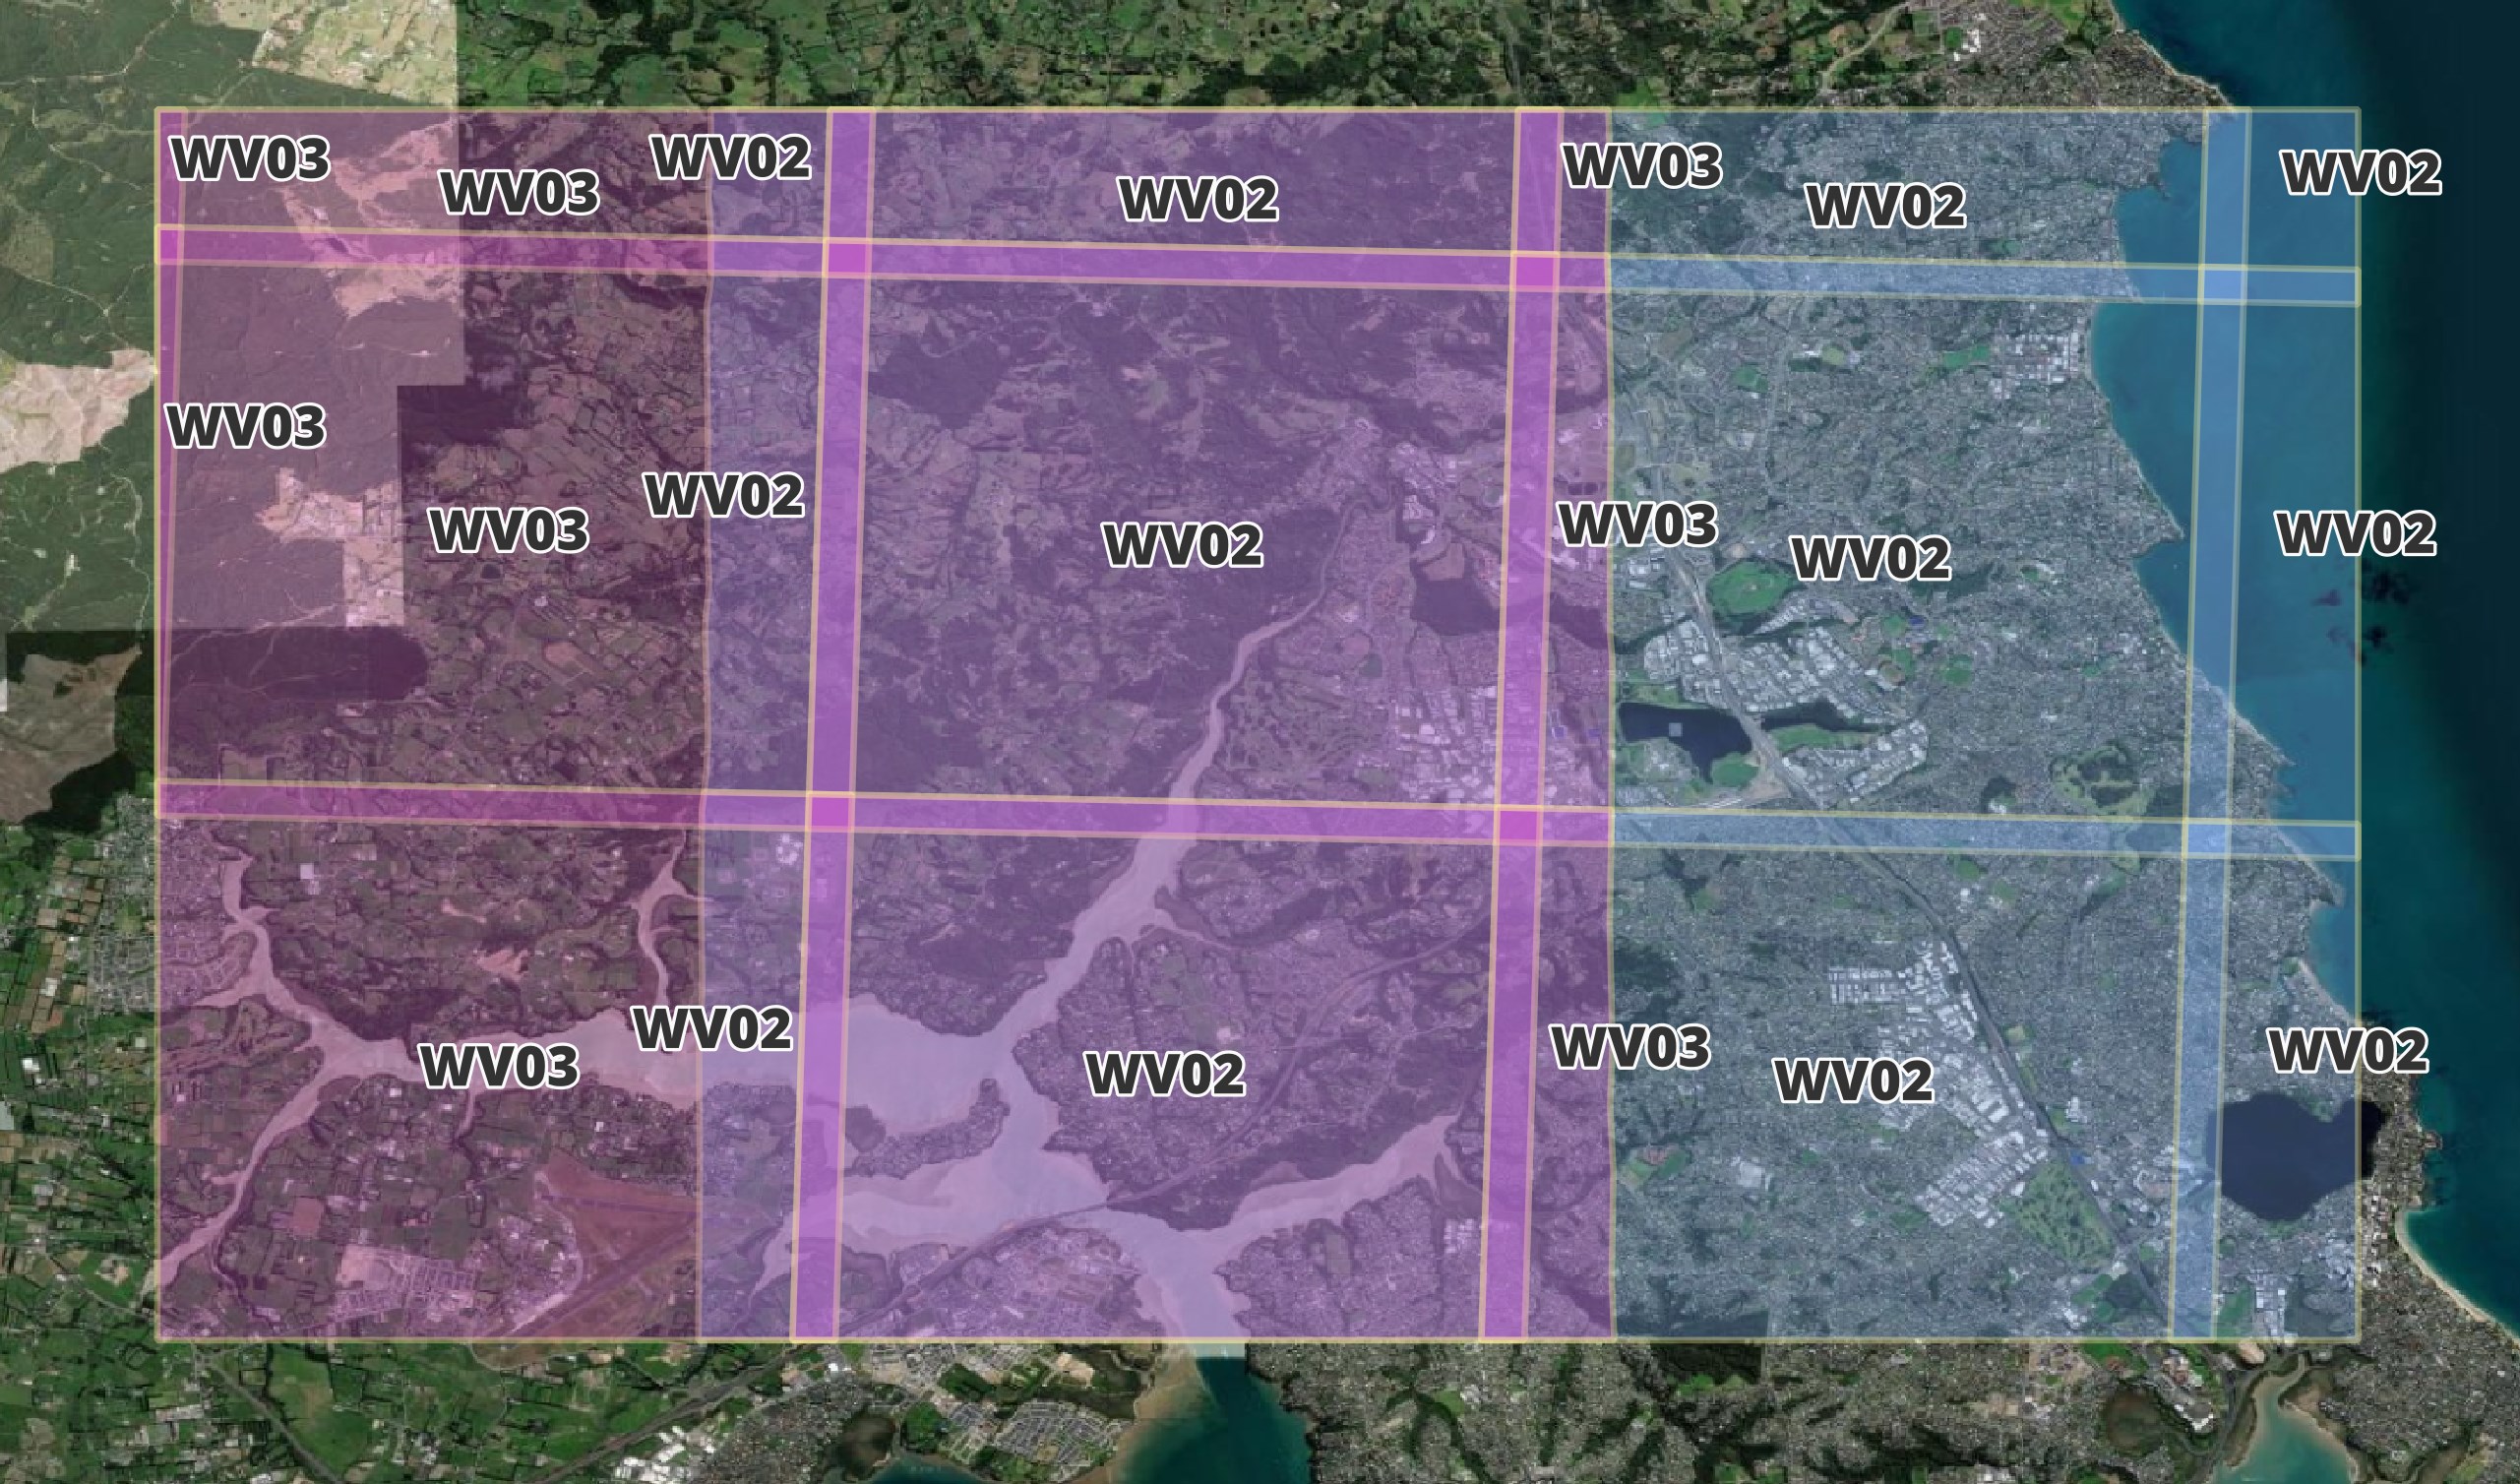
Multiple satellites could provide imagery over a short period of time as well. Below both WorldView-02 and WorldView-03 imagery were sourced for New Zealand with the images taken a few weeks apart from one another. The outlines are labelled with the abbreviations for their respective satellites and for clarity, the satellite imagery basemap is from Esri, not Maxar.
Below are the number of images taken by each satellite for each event in this dataset.
SELECT event,
       COUNT(*) FILTER (WHERE platform = 'GE01') AS GE01,
       COUNT(*) FILTER (WHERE platform = 'WV02') AS WV02,
       COUNT(*) FILTER (WHERE platform = 'WV03') AS WV03,
       COUNT(*) FILTER (WHERE platform = 'WV04') AS WV04
FROM maxar
GROUP BY 1
ORDER BY UPPER(event);
┌─────────────────────────────────────────┬───────┬───────┬───────┬───────┐
│                  event                  │ GE01  │ WV02  │ WV03  │ WV04  │
│                 varchar                 │ int64 │ int64 │ int64 │ int64 │
├─────────────────────────────────────────┼───────┼───────┼───────┼───────┤
│ afghanistan-earthquake22                │    42 │   234 │   119 │     0 │
│ BayofBengal-Cyclone-Mocha-May-23        │     0 │    85 │   121 │     0 │
│ cyclone-emnati22                        │   482 │   259 │    53 │     0 │
│ Emilia-Romagna-Italy-flooding-may23     │   154 │    73 │    18 │     0 │
│ Gambia-flooding-8-11-2022               │     6 │    18 │    56 │     0 │
│ ghana-explosion22                       │    73 │   150 │     0 │     0 │
│ Hurricane-Fiona-9-19-2022               │   139 │    12 │    99 │     0 │
│ Hurricane-Ian-9-26-2022                 │   591 │  2126 │   776 │     0 │
│ Hurricane-Idalia-Florida-Aug23          │   207 │   223 │   224 │     0 │
│ India-Floods-Oct-2023                   │     9 │    30 │    12 │     0 │
│ Indonesia-Earthquake22                  │    12 │    97 │    15 │     0 │
│ Kahramanmaras-turkey-earthquake-23      │    58 │  1579 │   381 │     0 │
│ Kalehe-DRC-Flooding-5-8-23              │     0 │     8 │    16 │     0 │
│ kentucky-flooding-7-29-2022             │    78 │   107 │     0 │     0 │
│ Libya-Floods-Sept-2023                  │   100 │    53 │    33 │     0 │
│ Marshall-Fire-21-Update                 │     0 │     0 │     0 │     0 │
│ Maui-Hawaii-fires-Aug-23                │    60 │    63 │     0 │     0 │
│ McDougallCreekWildfire-BC-Canada-Aug-23 │    17 │    14 │     0 │     0 │
│ Morocco-Earthquake-Sept-2023            │  1028 │  2830 │  4626 │   240 │
│ New-Zealand-Flooding23                  │     0 │    26 │    11 │     0 │
│ NWT-Canada-Aug-23                       │     0 │     0 │    86 │     0 │
│ pakistan-flooding22                     │   305 │   858 │   603 │     0 │
│ shovi-georgia-landslide-8Aug23          │    13 │     0 │     5 │     0 │
│ southafrica-flooding22                  │   128 │   305 │   109 │     0 │
│ Sudan-flooding-8-22-2022                │    24 │     0 │    24 │     0 │
│ tonga-volcano21                         │    51 │   188 │   100 │     0 │
│ volcano-indonesia21                     │   152 │   132 │     0 │     0 │
│ yellowstone-flooding22                  │    30 │   250 │     0 │     0 │
├─────────────────────────────────────────┴───────┴───────┴───────┴───────┤
│ 28 rows                                                       5 columns │
└─────────────────────────────────────────────────────────────────────────┘
Finding a Location's Imagery
Below I'll search through the 20K+ images for an area of interest. I'll use OpenStreetMap (OSM) to get the coordinates for the main Airport in Marrakesh, Morocco.
$ curl --silent \
       --get \
       --data-urlencode "format=json" \
       --data-urlencode "limit=1" \
       --data-urlencode "q=Marrakesh Airport" \
       https://nominatim.openstreetmap.org/search \
    | jq --slurp \
        '.[0][0] | "\(.lon) \(.lat)"'
"-8.032439841503606 31.60587285"
I'll then find the latest record that has geometry covering that point.
$ ~/duckdb maxar.duckdb
.mode line

SELECT   *
FROM     maxar
WHERE    ST_INTERSECTS(ST_POINT(-8.032439841503606, 31.60587285),
                       geom)
AND      datetime >= '2023-01-01'::timestamp
ORDER BY datetime DESC
LIMIT    1;
The following image was taken by WorldView-03 the day after the earthquake.
            datetime = 2023-09-10 11:25:15
            platform = WV03
                 gsd = 0.36
ard_metadata_version = 0.0.1
          catalog_id = 1040050057DC8500
            utm_zone = 29
             quadkey = 120202010210
      view:off_nadir = 23.9
        view:azimuth = 337.2
view:incidence_angle = 63.7
    view:sun_azimuth = 147.2
  view:sun_elevation = 59.5
           proj:epsg = 32629
           grid:code = MXRA-Z29-120202010210
           proj:bbox = 589843.75,3494843.75,595156.25,3500156.25
      tile:data_area = 28.2
    tile:clouds_area = 0.0
 tile:clouds_percent = 0
              visual = https://maxar-opendata.s3.amazonaws.com/events/Morocco-Earthquake-Sept-2023/ard/29/120202010210/2023-09-10/1040050057DC8500-visual.tif
               event = Morocco-Earthquake-Sept-2023
                geom = POLYGON ((-8.052596 31.633081, -8.053081 31.585156, -7.997097 31.584729, -7.996583 31.632653, -8.052596 31.633081))
The image has its position and projection details embedded within it. It'll place itself on the globe automatically when imported into QGIS or ArcGIS Pro.
$ gdalinfo downloads/Morocco-Earthquake-Sept-2023/2023-09-10/ard_29_120202010210_2023-09-10_1040050057DC8500-visual.tif
...
Coordinate System is:
PROJCRS["WGS 84 / UTM zone 29N",
...
Corner Coordinates:
Upper Left  (  589843.750, 3500156.250) (  8d 3' 9.35"W, 31d37'59.09"N)
Lower Left  (  589843.750, 3494843.750) (  8d 3'11.09"W, 31d35' 6.56"N)
Upper Right (  595156.250, 3500156.250) (  7d59'47.70"W, 31d37'57.55"N)
Lower Right (  595156.250, 3494843.750) (  7d59'49.55"W, 31d35' 5.02"N)
I'll drop the image onto a new QGIS workspace and outline it in yellow to differentiate it from the Esri World Imagery Basemap surrounding it. I've also imported polygons from OSM for this area as well. I've colour coded and labelled the polygons by their landuse field.
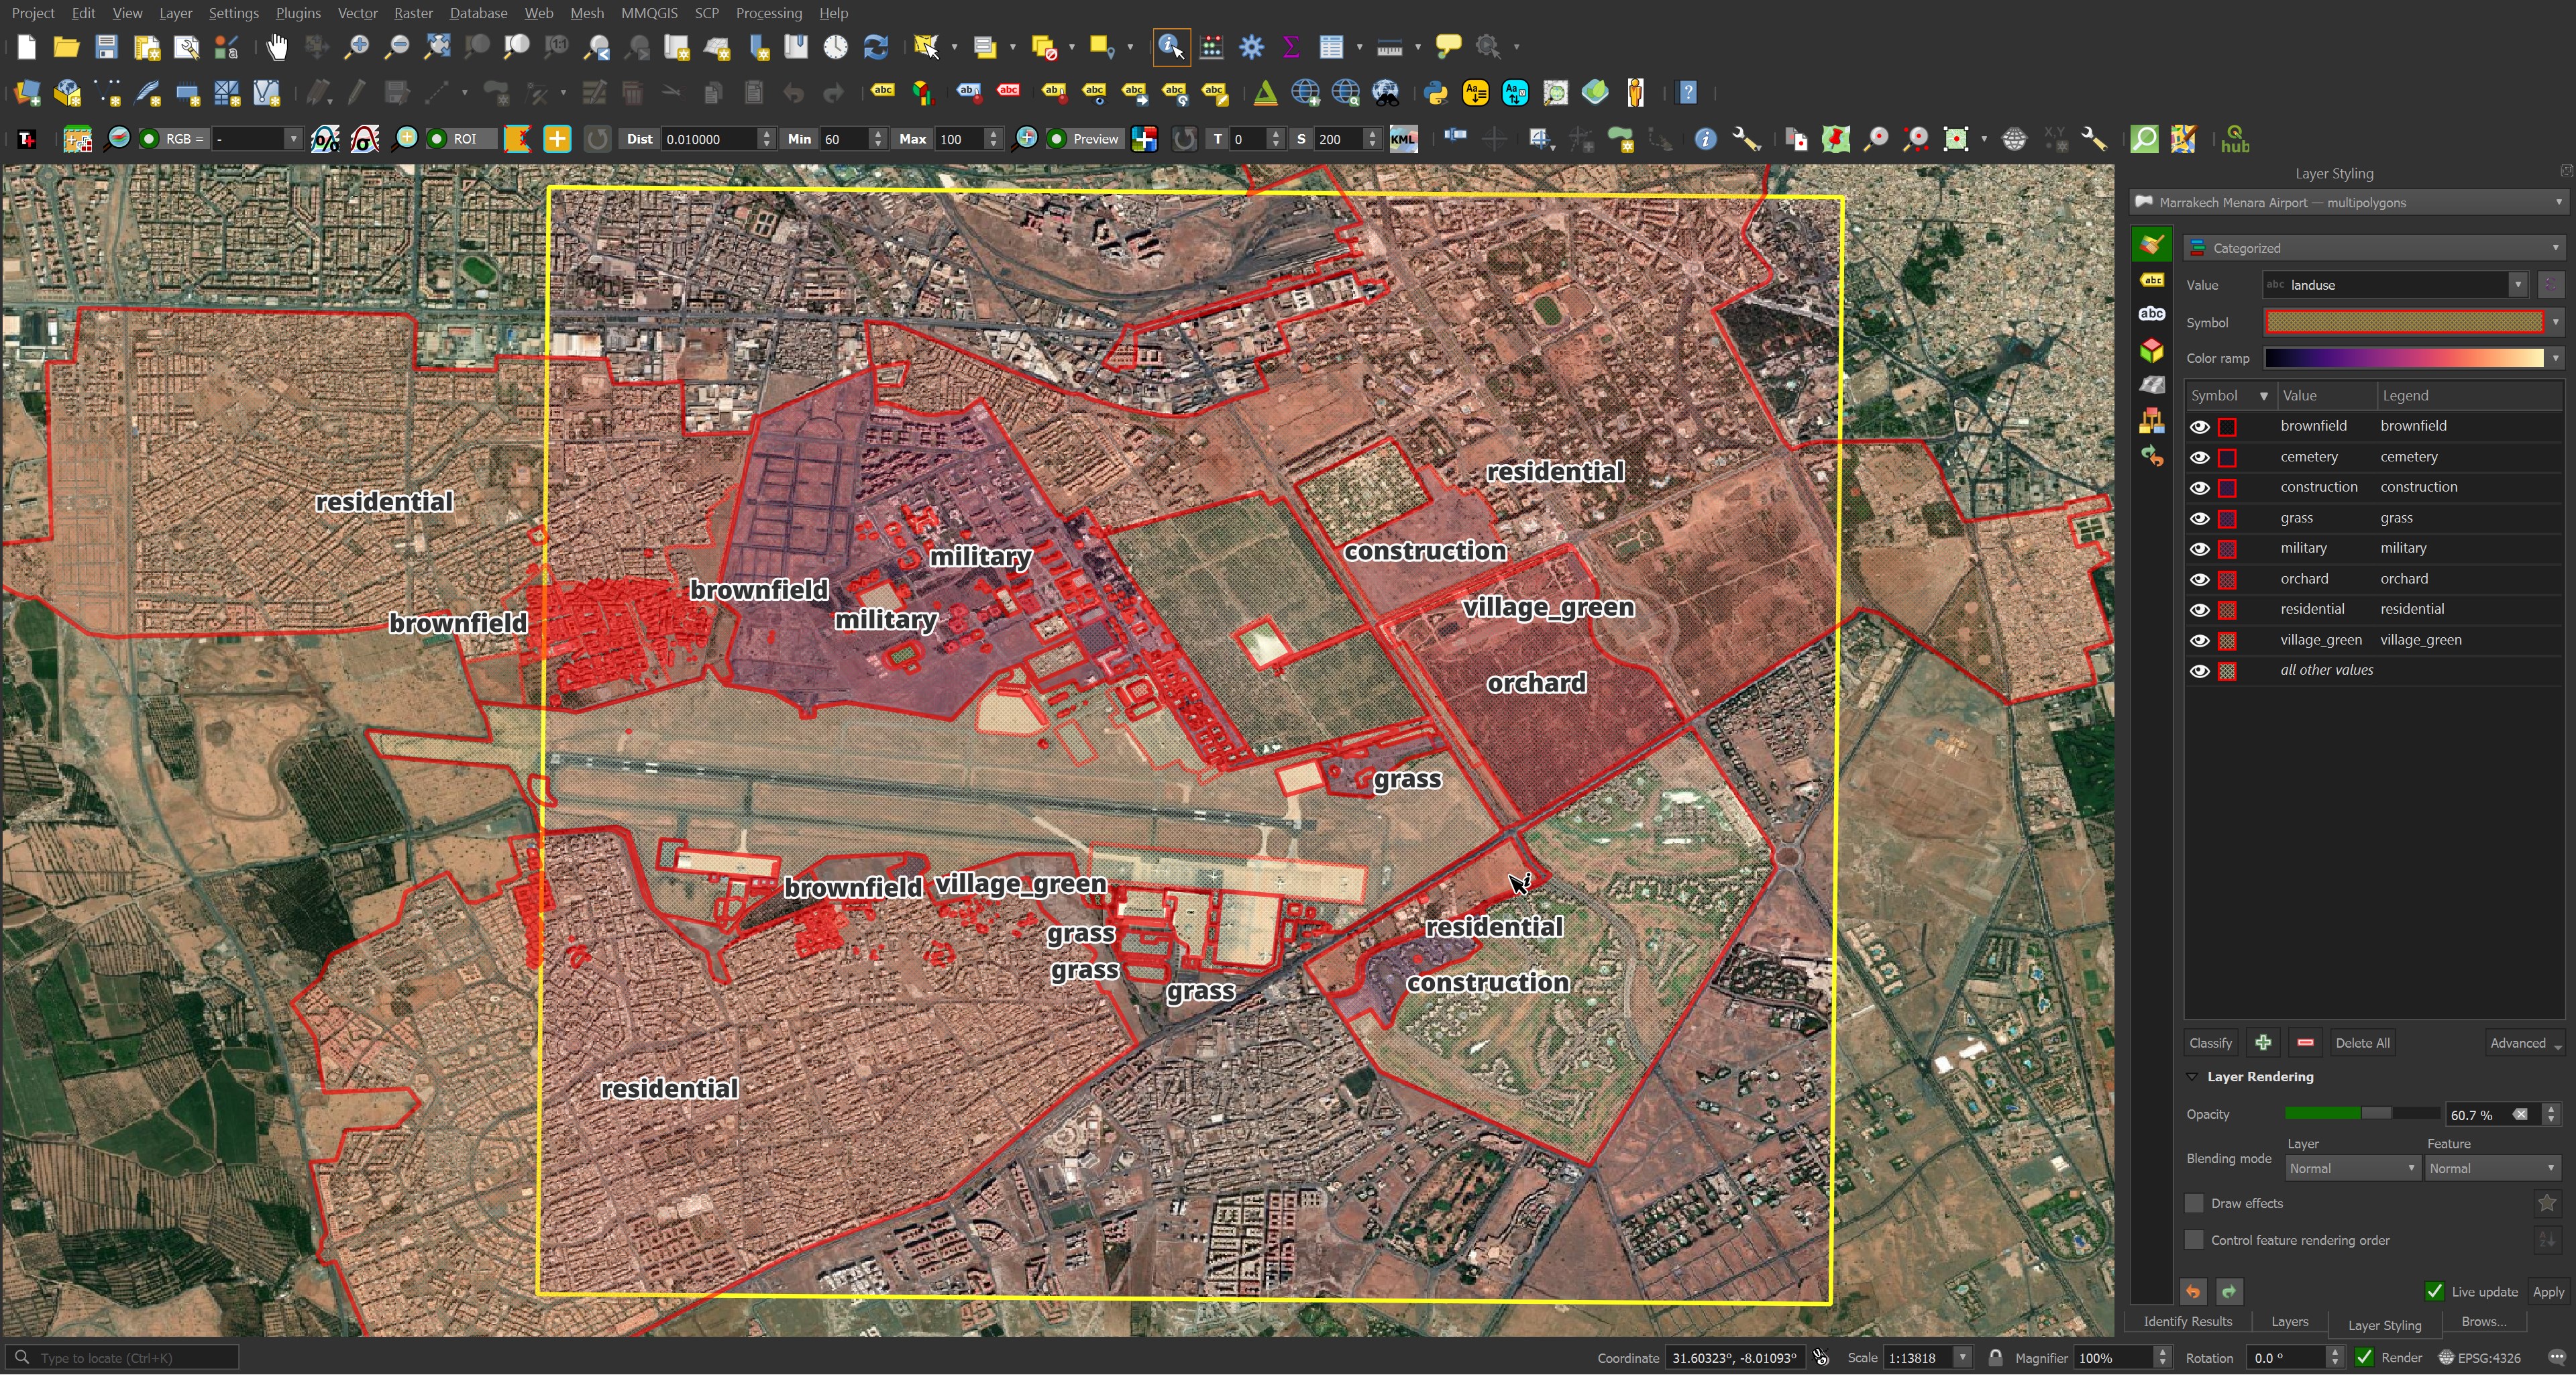
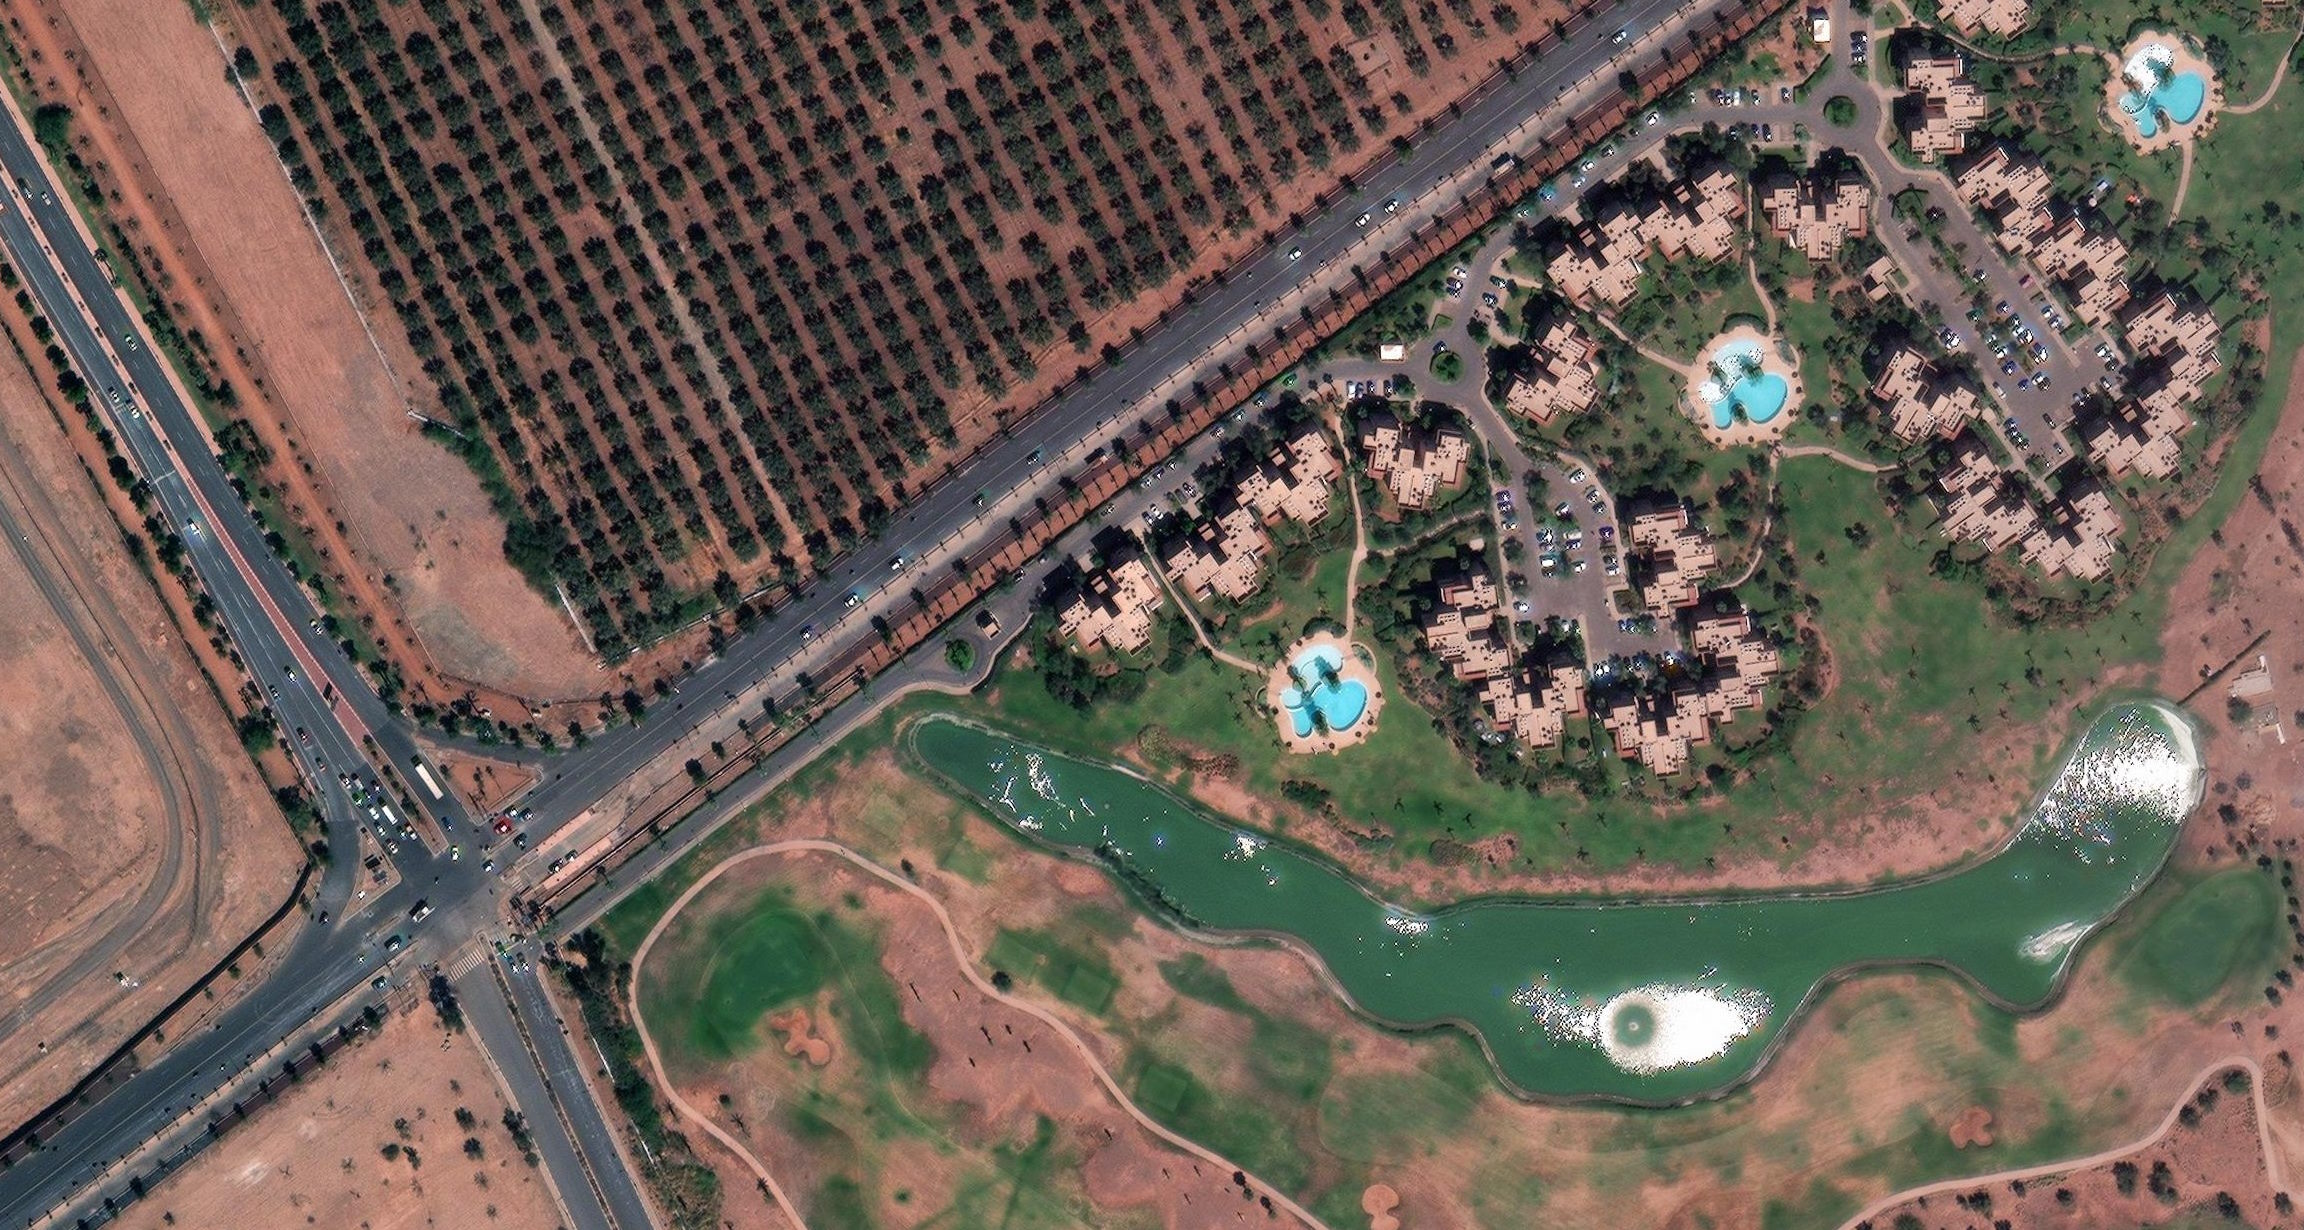
Below is the image at 100% zoom. There is good visibility of cars and buildings on the ground and a lot could be inferred from imagery at this resolution.