The Layercake project produces Parquet files of buildings, highways and settlements of OpenStreetMap (OSM) data. These are updated on a weekly basis. They're served from Cloudflare and I was able to max out my 560 Mbps line downloading them.
They also support bounding box queries. A typical ~500K-inhabitant city might only need a few seconds and MBs for its buildings and roads to download from Layercake's multi-GB datasets.
The scripts used to generate the Parquet files are open source and there is a call to have contributors put together more ETL jobs of other features types found on OSM.
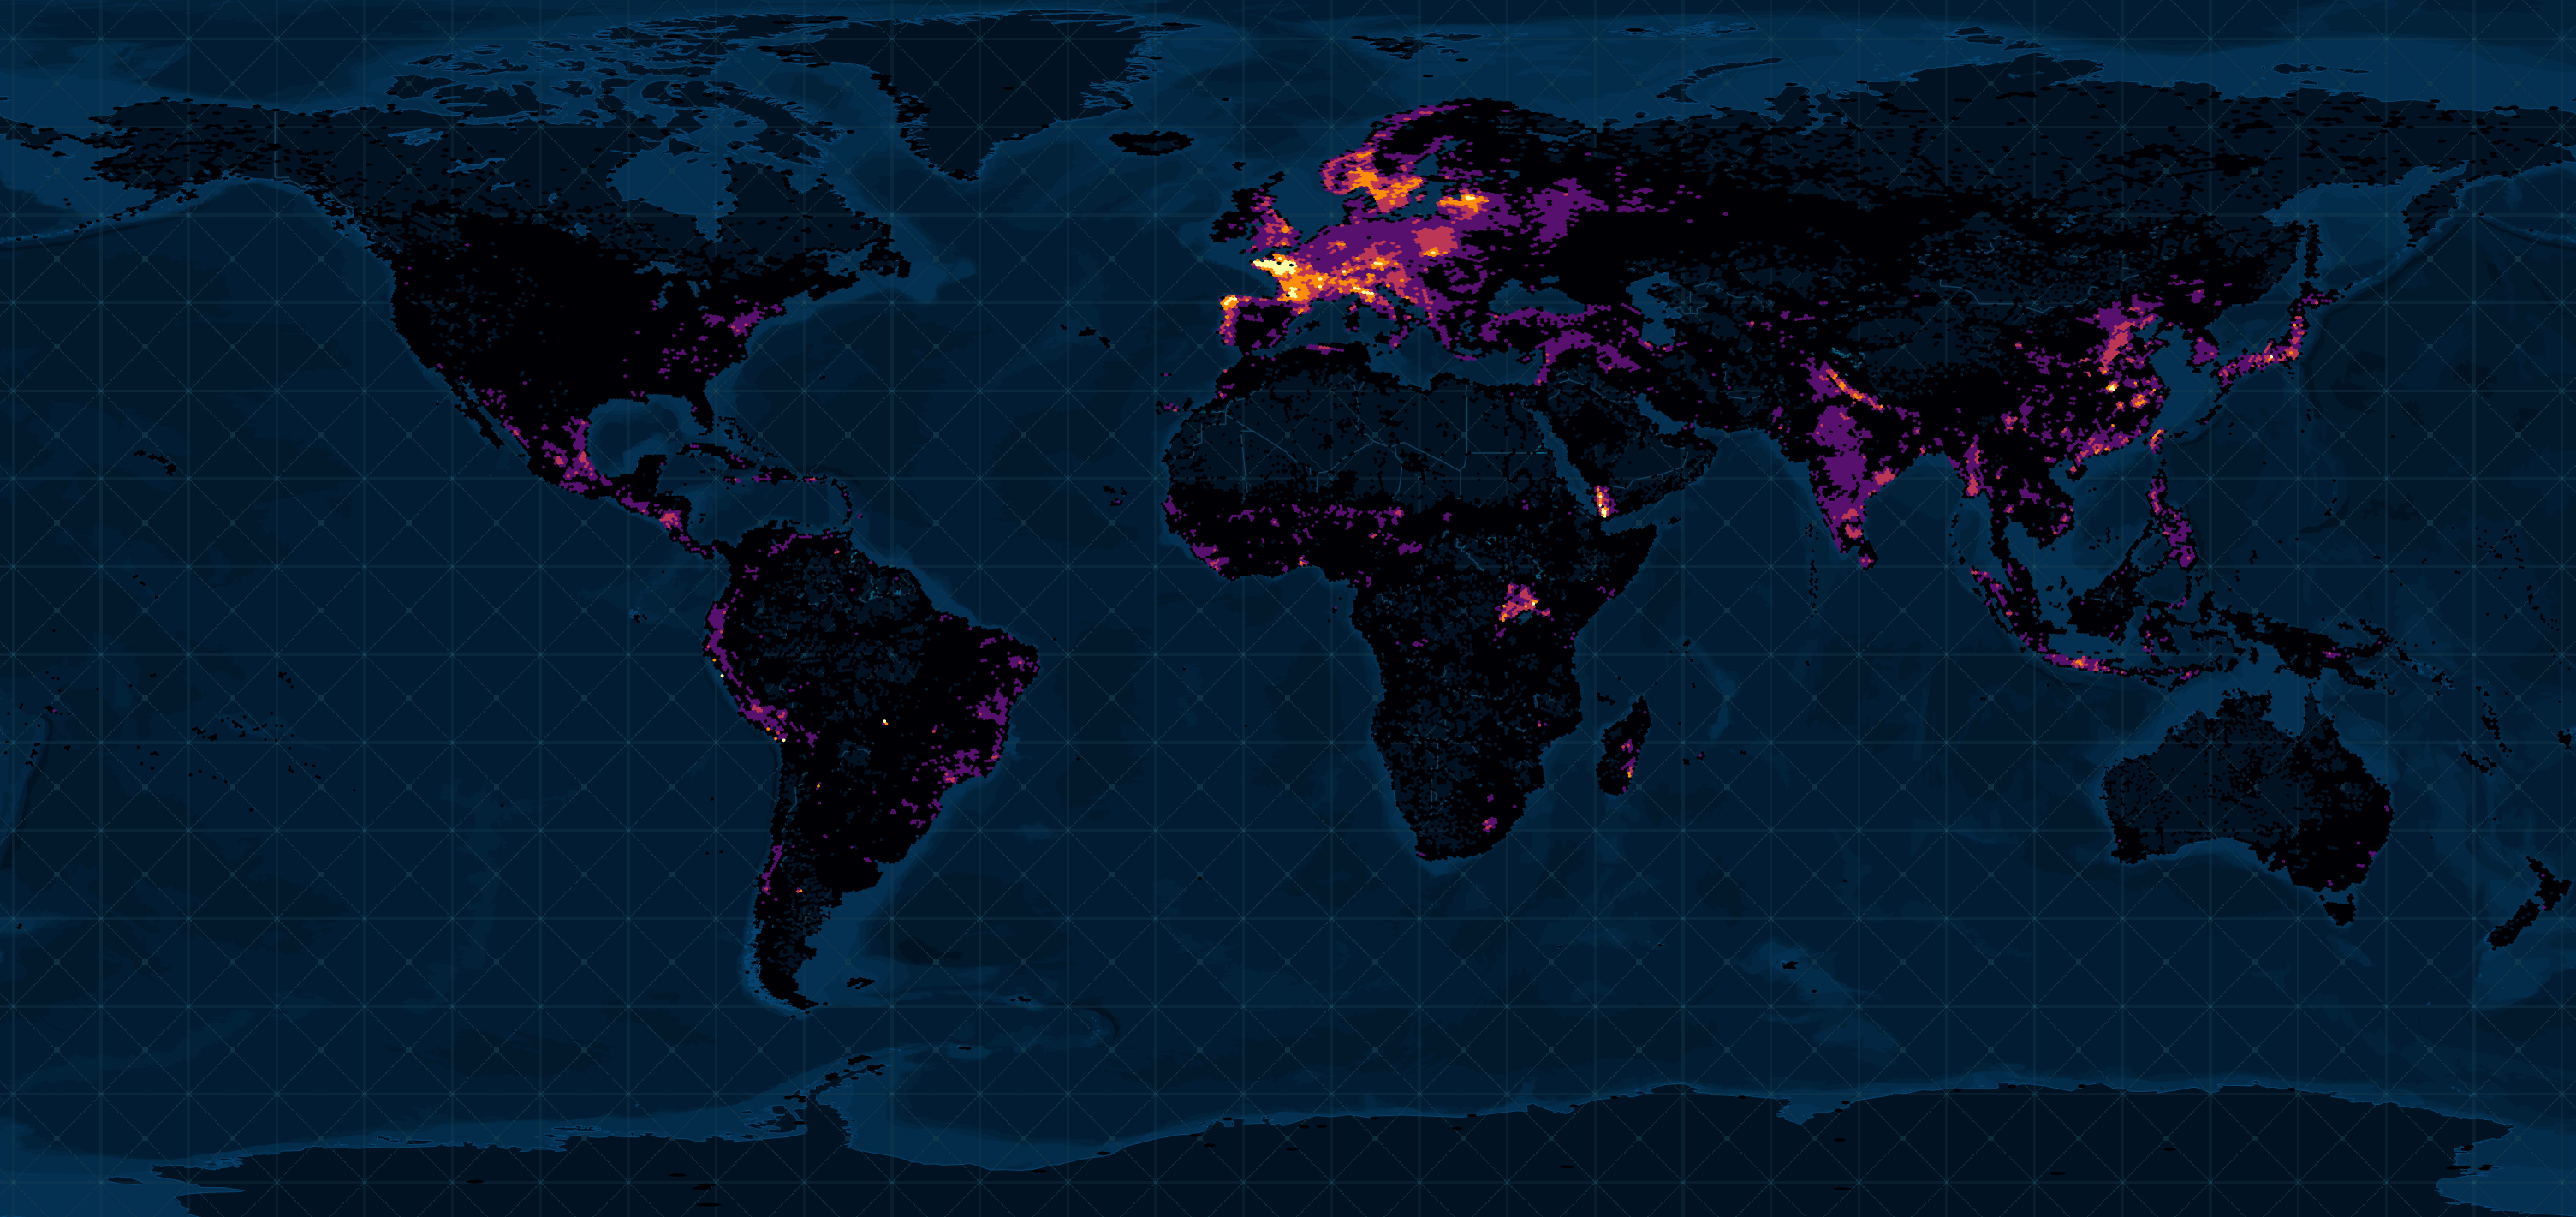
Below is a heatmap of their settlements dataset.
In this post, I'll explore Layercake's initial three deliverables.
My Workstation
I'm using a 5.7 GHz AMD Ryzen 9 9950X CPU. It has 16 cores and 32 threads and 1.2 MB of L1, 16 MB of L2 and 64 MB of L3 cache. It has a liquid cooler attached and is housed in a spacious, full-sized Cooler Master HAF 700 computer case.
The system has 96 GB of DDR5 RAM clocked at 4,800 MT/s and a 5th-generation, Crucial T700 4 TB NVMe M.2 SSD which can read at speeds up to 12,400 MB/s. There is a heatsink on the SSD to help keep its temperature down. This is my system's C drive.
The system is powered by a 1,200-watt, fully modular Corsair Power Supply and is sat on an ASRock X870E Nova 90 Motherboard.
I'm running Ubuntu 24 LTS via Microsoft's Ubuntu for Windows on Windows 11 Pro. In case you're wondering why I don't run a Linux-based desktop as my primary work environment, I'm still using an Nvidia GTX 1080 GPU which has better driver support on Windows and ArcGIS Pro only supports Windows natively.
Installing Prerequisites
I'll use Python 3.12.3, GDAL 3.9.3 and a few other tools to help analyse the data in this post.
$ sudo add-apt-repository ppa:deadsnakes/ppa
$ sudo add-apt-repository ppa:ubuntugis/ubuntugis-unstable
$ sudo apt update
$ sudo apt install \
    gdal-bin \
    jq \
    python3-pip \
    python3.12-venv
I'll be using JSON Convert (jc) to convert the output of various CLI tools into JSON.
$ wget https://github.com/kellyjonbrazil/jc/releases/download/v1.25.2/jc_1.25.2-1_amd64.deb
$ sudo dpkg -i jc_1.25.2-1_amd64.deb
I'll use a Parquet debugging tool I've been working on to see how much space each column takes up in one of the Parquet files.
$ git clone https://github.com/marklit/pqview \
    ~/pqview

$ python3 -m venv ~/.pqview
$ source ~/.pqview/bin/activate
$ python3 -m pip install \
          -r ~/pqview/requirements.txt
I'll use DuckDB, along with its H3, JSON, Lindel, Parquet and Spatial extensions, in this post.
$ cd ~
$ wget -c https://github.com/duckdb/duckdb/releases/download/v1.3.2/duckdb_cli-linux-amd64.zip
$ unzip -j duckdb_cli-linux-amd64.zip
$ chmod +x duckdb
$ ~/duckdb
INSTALL h3 FROM community;
INSTALL lindel FROM community;
INSTALL json;
INSTALL parquet;
INSTALL spatial;
I'll set up DuckDB to load every installed extension each time it launches.
$ vi ~/.duckdbrc
.timer on
.width 180
LOAD h3;
LOAD lindel;
LOAD json;
LOAD parquet;
LOAD spatial;
The maps in this post were mostly rendered with QGIS version 3.44. QGIS is a desktop application that runs on Windows, macOS and Linux. The application has grown in popularity in recent years and has ~15M application launches from users all around the world each month.
Buildings, Highways & Settlements
There are three datasets at the time of this writing.
The Buildings dataset is 39 GB and contains 657,586,639 rows. Below is an example record.
$ echo "SELECT * EXCLUDE(bbox, tags),
               bbox::JSON bbox,
               tags::JSON tags
        FROM READ_PARQUET('https://data.openstreetmap.us/layercake/buildings.parquet')
        LIMIT 1" \
    | ~/duckdb -json \
    | jq -S .
[
  {
    "bbox": {
      "xmax": -179.96388244628906,
      "xmin": -179.96853637695312,
      "ymax": -77.95700073242188,
      "ymin": -77.95773315429688
    },
    "geometry": "MULTIPOLYGON (((-179.9685336 -77.9573186, -179.9669886 -77.9577349, -179.9646068 -77.9576499, -179.9638772 -77.9571306, -179.9663234 -77.9570007, -179.9685336 -77.9573186)))",
    "id": 1417351285,
    "tags": {
      "access": null,
      "addr:city": null,
      "addr:housenumber": null,
      "addr:postcode": null,
      "addr:street": null,
      "building": "yes",
      "building:colour": null,
      "building:flats": null,
      "building:levels": null,
      "building:material": null,
      "building:part": null,
      "building:use": null,
      "height": null,
      "name": "St. Paul's Burgers",
      "roof:colour": null,
      "roof:height": null,
      "roof:levels": null,
      "roof:material": null,
      "roof:orientation": null,
      "roof:shape": null,
      "start_date": null,
      "website": null,
      "wheelchair": null,
      "wikidata": null,
      "wikipedia": null
    },
    "type": "way"
  }
]
The Highways dataset is 25 GB and contains 281,406,480 rows. Below is an example record.
$ echo "SELECT * EXCLUDE(bbox, tags),
               bbox::JSON bbox,
               tags::JSON tags
        FROM READ_PARQUET('https://data.openstreetmap.us/layercake/highways.parquet')
        LIMIT 1" \
    | ~/duckdb -json \
    | jq -S .
[
  {
    "bbox": {
      "xmax": -176.4818115234375,
      "xmin": -180.0,
      "ymax": -82.42407989501953,
      "ymin": -83.1589584350586
    },
    "geometry": "LINESTRING (-179.9999994 -82.42408, -179.4974012 -82.5336833, -178.994803 -82.6417098, -178.4922048 -82.7481817, -177.9896066 -82.8531212, -177.4870083 -82.9565499, -176.9844101 -83.0584892, -176.4818119 -83.1589603)",
    "id": 1159749847,
    "tags": {
      "access": null,
      "bicycle": null,
      "bridge": null,
      "bus": null,
      "construction": null,
      "covered": null,
      "crossing": null,
      "cycleway": null,
      "cycleway:left": null,
      "cycleway:right": null,
      "foot": null,
      "footway": null,
      "hgv": null,
      "highway": "secondary",
      "lanes": null,
      "layer": null,
      "lit": null,
      "maxspeed": null,
      "motor_vehicle": null,
      "motorcycle": null,
      "name": "South Pole Traverse",
      "oneway": null,
      "ref": null,
      "service": null,
      "sidewalk": "no",
      "smoothness": "very_bad",
      "surface": "ice",
      "toll": null,
      "tracktype": null,
      "tunnel": null,
      "wheelchair": null,
      "width": null
    },
    "type": "way"
  }
]
The Settlements dataset is 164 MB and contains 4,399,103 rows. Below is an example record.
$ echo "SELECT * EXCLUDE(bbox, tags),
               bbox::JSON bbox,
               tags::JSON tags
        FROM READ_PARQUET('https://data.openstreetmap.us/layercake/settlements.parquet')
        LIMIT 1" \
    | ~/duckdb -json \
    | jq -S .
[
  {
    "bbox": {
      "xmax": -139.27279663085938,
      "xmin": -139.27279663085938,
      "ymax": -89.99800109863281,
      "ymin": -89.99800109863281
    },
    "geometry": "POINT (-139.2728 -89.998)",
    "id": 5314074411,
    "tags": {
      "alt_name": "Amundsen-Scott Base",
      "alt_names": {},
      "name": "Amundsen–Scott South Pole",
      "names": {
        "en": "Amundsen–Scott South Pole Station",
        "etymology:wikidata": "Q926;Q102527",
        "hu": "Amundsen-Scott kutatóállomás",
        "ko": "아문센-스콧 남극점 기지",
        "mk": "Станица Амундсен-Скот",
        "zh": "阿蒙森-斯科特南极站"
      },
      "official_name": "Amundsen–Scott South Pole Station",
      "official_names": {},
      "place": "village",
      "population": 49,
      "wikidata": "Q243307",
      "wikipedia": "en:Amundsen–Scott South Pole Station"
    },
    "type": "node"
  }
]
The following gets the publication date of the Buildings file. It was published on Tuesday the 23rd of September when I ran this.
$ curl -sI https://data.openstreetmap.us/layercake/buildings.parquet \
    | jc --kv \
    | jq -S .
{
  "HTTP/2 200": "",
  "accept-ranges": "bytes",
  "cf-cache-status": "DYNAMIC",
  "cf-ray": "98513d4c8e71542e-TLL",
  "content-length": "41545837871",
  "content-type": "application/octet-stream",
  "date": "Fri, 26 Sep 2025 08:02:30 GMT",
  "etag": "4f1bc544e027d4e5281072931b28a1f8-7925",
  "last-modified": "Tue, 23 Sep 2025 01:07:00 GMT",
  "nel": "{\"report_to\":\"cf-nel\",\"success_fraction\":0.0,\"max_age\":604800}",
  "report-to": "{\"group\":\"cf-nel\",\"max_age\":604800,\"endpoints\":[{\"url\":\"https://a.nel.cloudflare.com/report/v4?s=QfwN2UyRDYsN%2B%2BN4SEPc7ppTRIoxP0HUIEn%2FPuPw2WPvkTMBb4p0ydtbf9K4xmxfxadRO%2BR2SnDGAybZWUvJhAAsOh2RhkcKLiqGfStxxW3AlOs%3D\"}]}",
  "server": "cloudflare",
  "vary": "Accept-Encoding"
}
Downloading Buildings
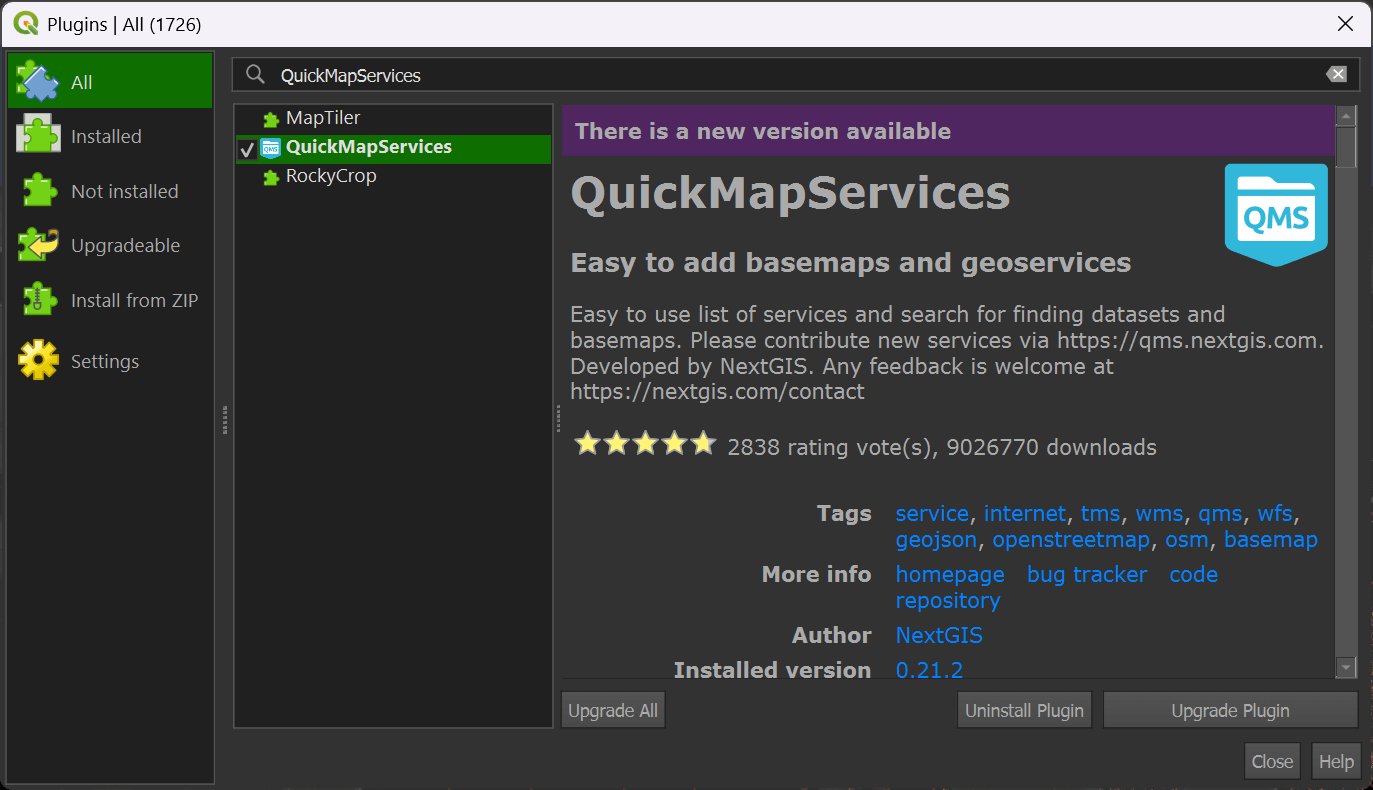
In QGIS, click the "Plugins" Menu and then the "Manage and Install Plugins" item. Click the "All" filter in the top left of the dialog and then search for "QuickMapServices". Click to install or upgrade the plugin in the bottom right of the dialog.
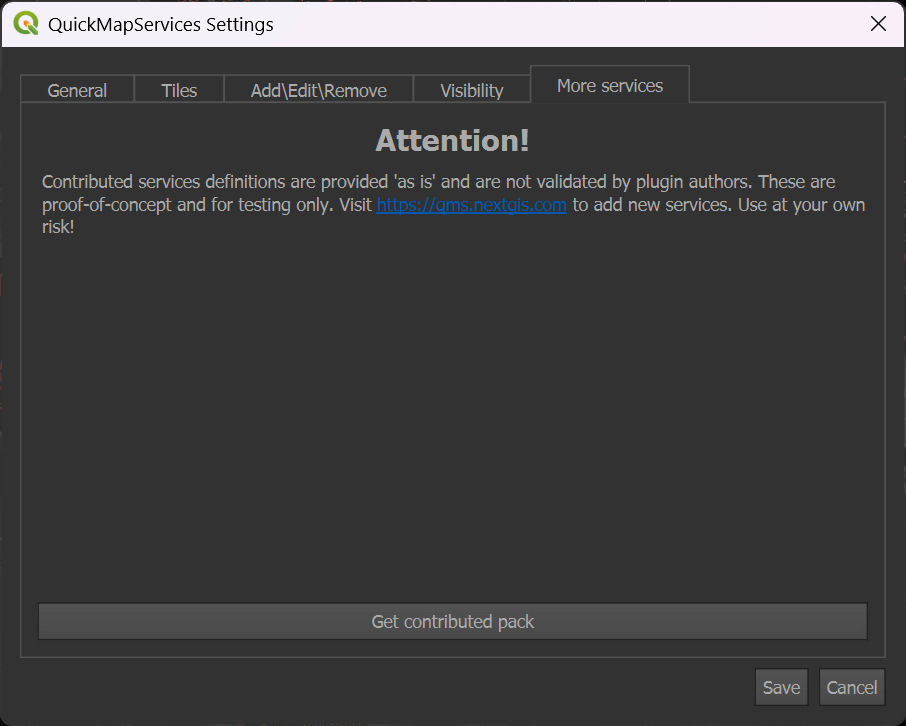
Click the "Web" Menu, then "QuickMapServices" and then the "Settings" item. Click the "More Services" tab at the top of the dialog. Click the "Get contributed pack" button.
In the "Web" menu under "QuickMapServices" you should now see the list of several basemap providers.
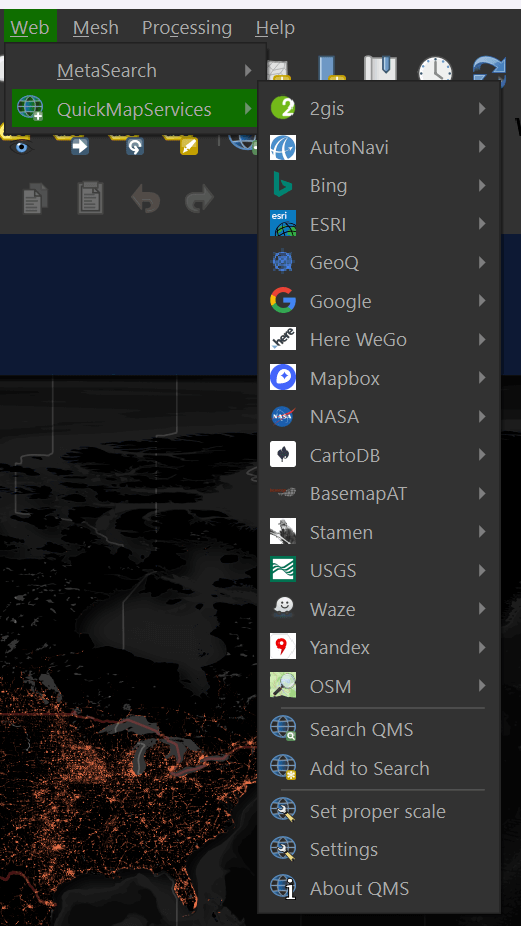
Select "OSM" and then "OSM Standard" to add a world map to your scene.
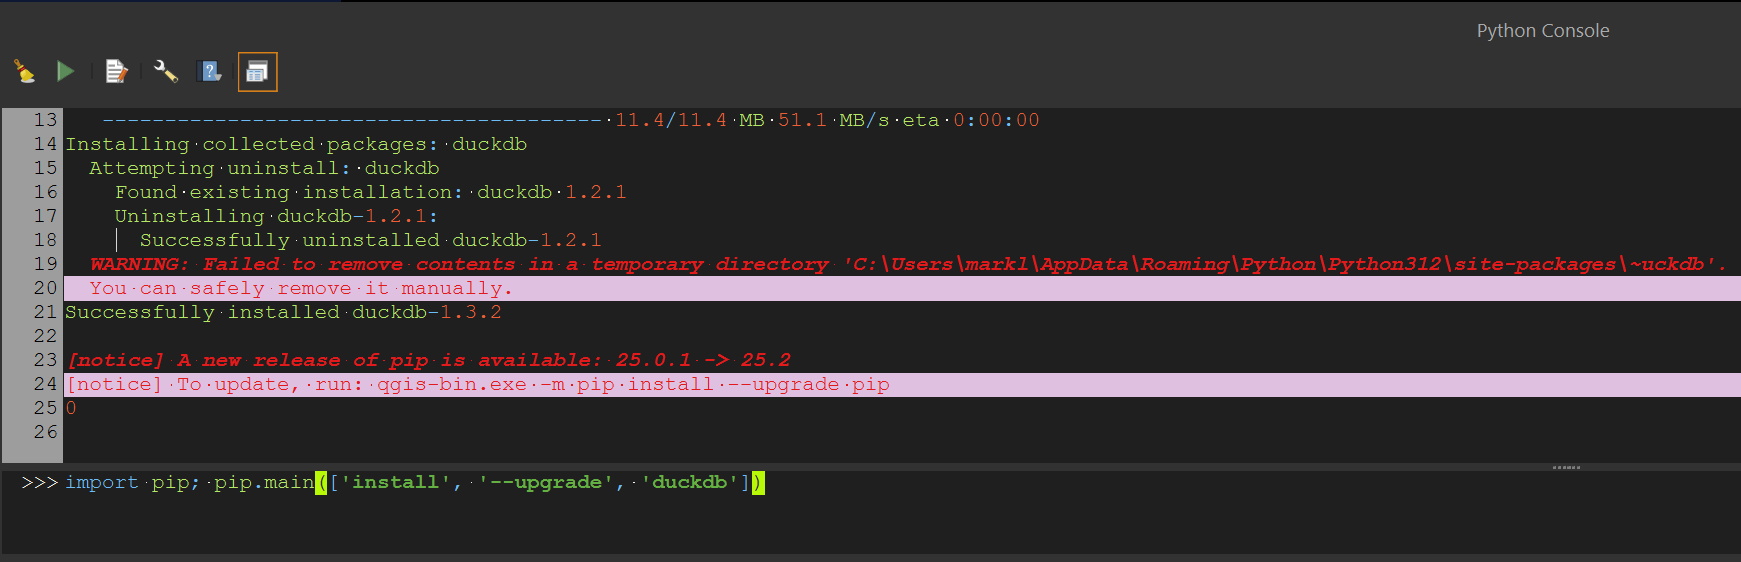
Under the "Plugins" menu, select "Python Console". Paste in the following line of Python. It'll ensure you've got the latest version of DuckDB installed in QGIS' Python Environment.
import pip; pip.main(['install', '--upgrade', 'duckdb'])
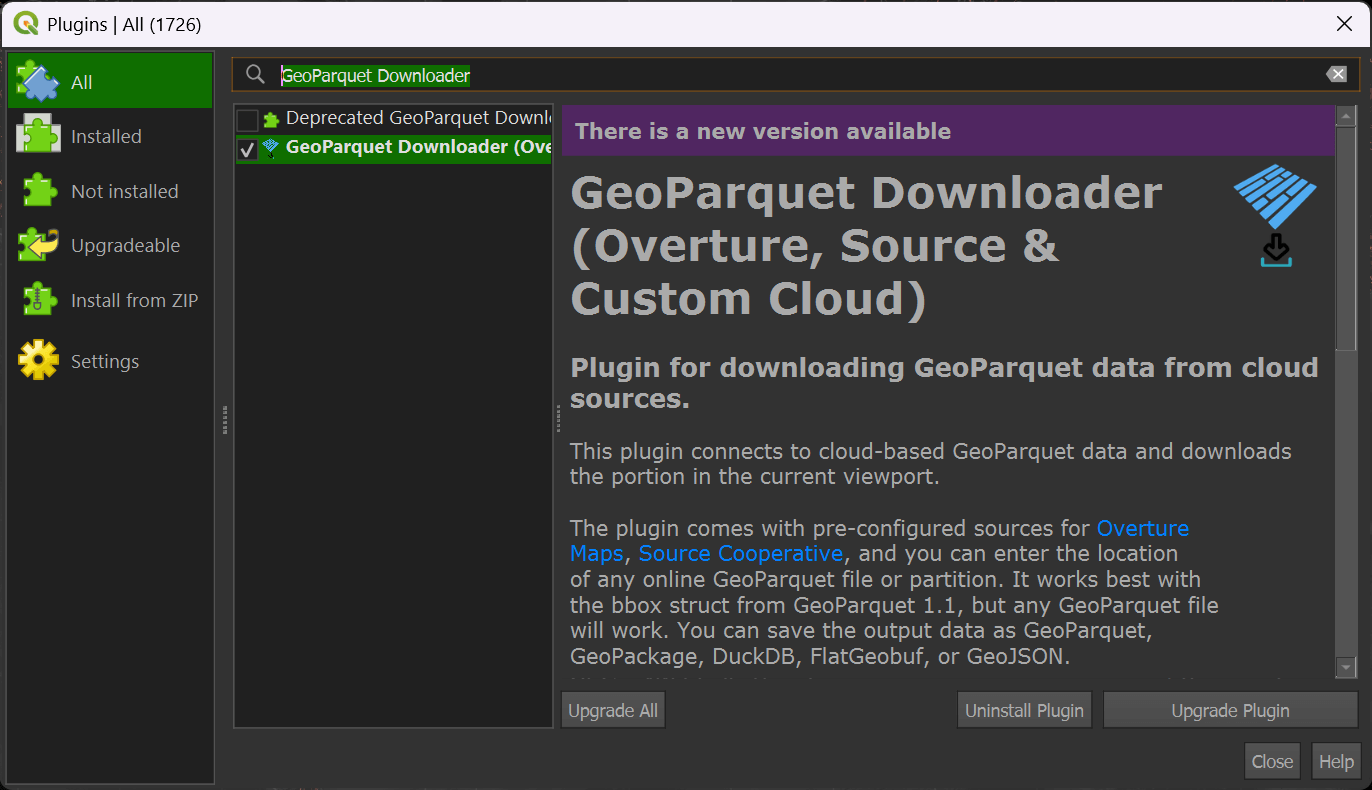
In QGIS, click the "Plugins" Menu and then the "Manage and Install Plugins" item. Click the "All" filter in the top left of the dialog and then search for "GeoParquet Downloader". Click to install or upgrade the plugin in the bottom right of the dialog.
Zoom into a city of interest somewhere in the world. It's important to make sure you're not looking at an area larger than a major city as the viewport will set the boundaries for how much data will be downloaded.
If you can see the whole earth, GeoParquet Downloader will end up downloading 39 GB of data. Downloading only a city's worth of data will likely only need a few MB of data.
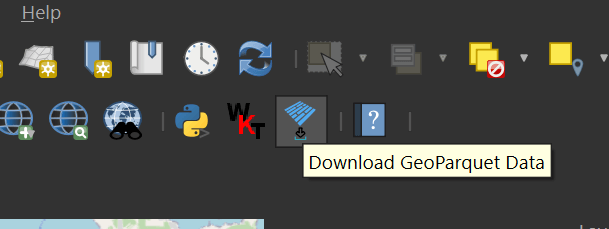
In your toolbar, click on the GeoParquet Downloader icon. It's the one with blue, rotated rectangles.
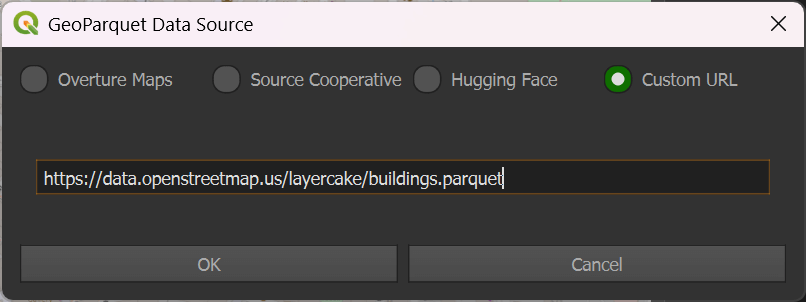
Click the "Custom URL" option and paste the following URL in.
https://data.openstreetmap.us/layercake/buildings.parquet
Hit "OK". You'll be prompted to save a Parquet file onto your computer. Once you've done so, the GBA data for the area in your map should appear shortly afterword.
Once the buildings have loaded, select the layer styling for the downloaded buildings layer. The combo box at the top of the styling panel should be switched from "Single Symbol" to "2.5D".
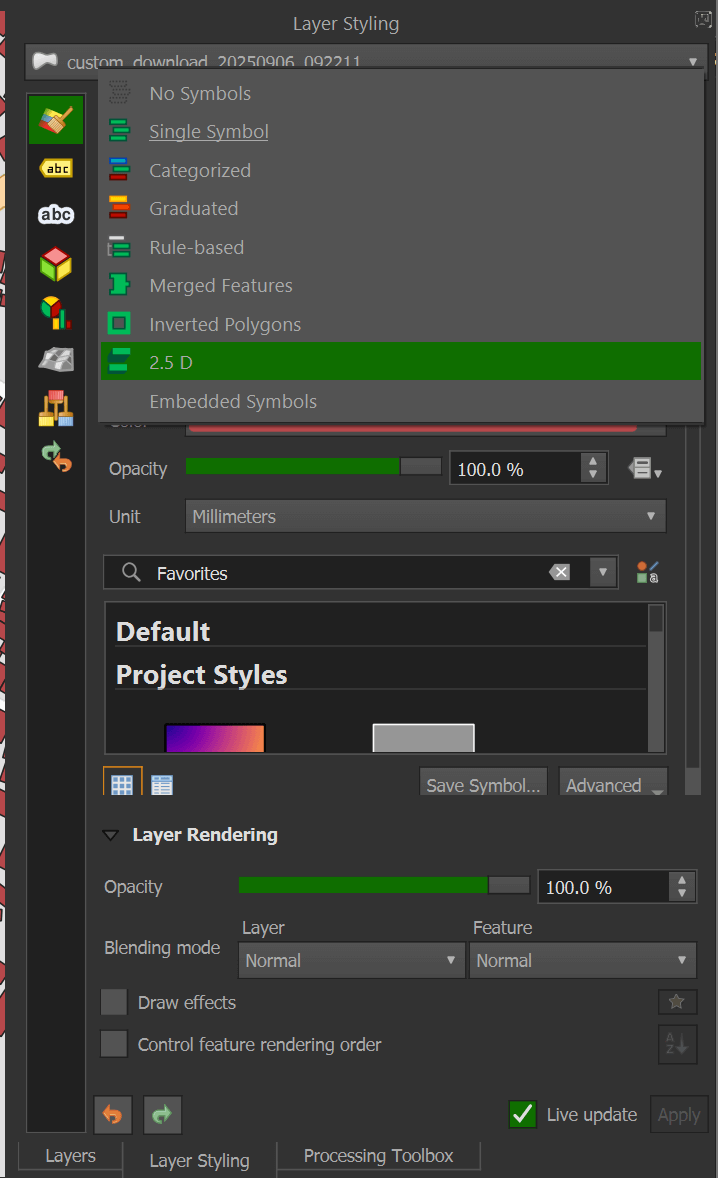
I've set the roof colour to #b13327, wall colour to #4f090b, angle to 230 degrees and added a drop shadow effect to the layer.
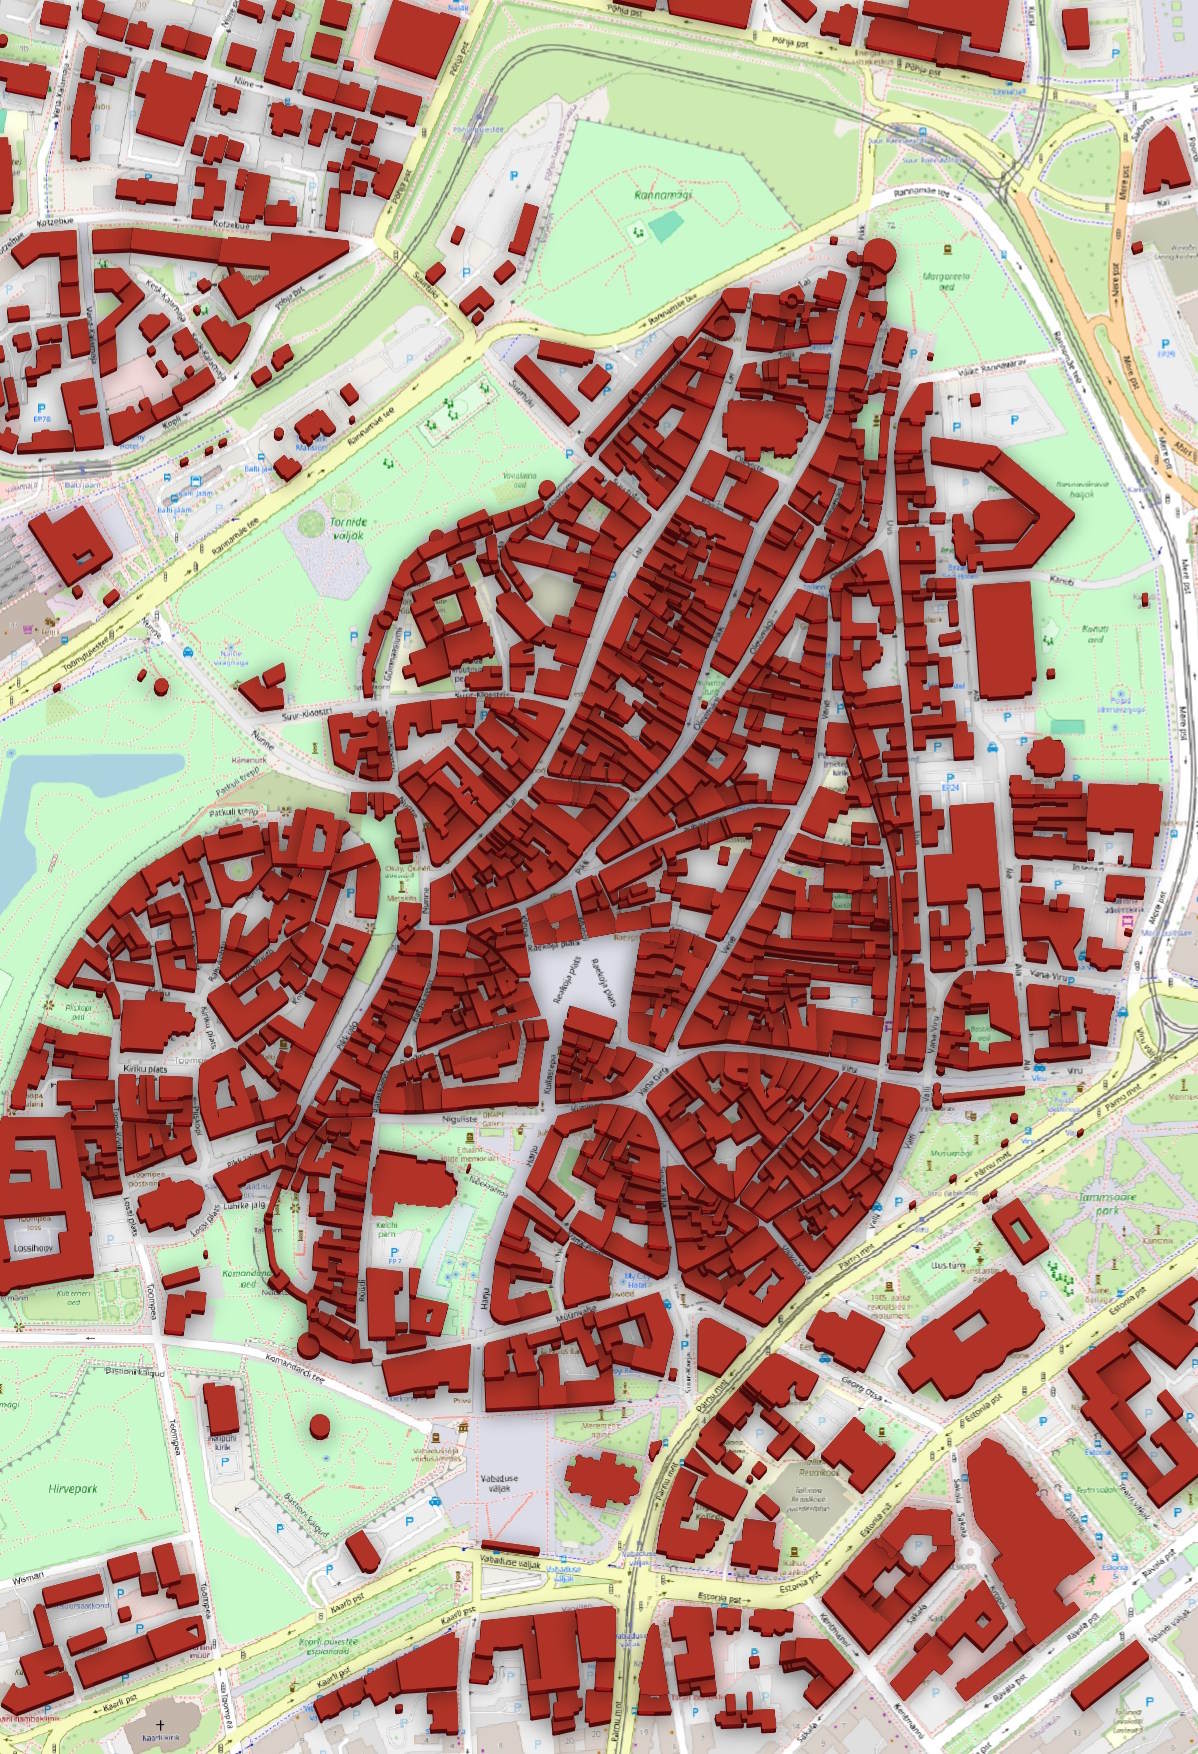
In the height field, change it to the following expression:
min("tags.height", 1) / 30000
You should now see a 2.5D representation of the buildings you downloaded.
There is an "Identify Features" icon in the toolbar.
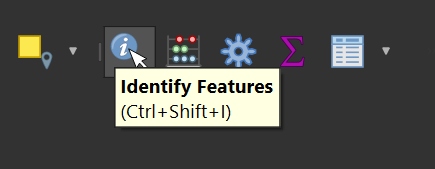
This tool lets you select any building and bring up its metadata.
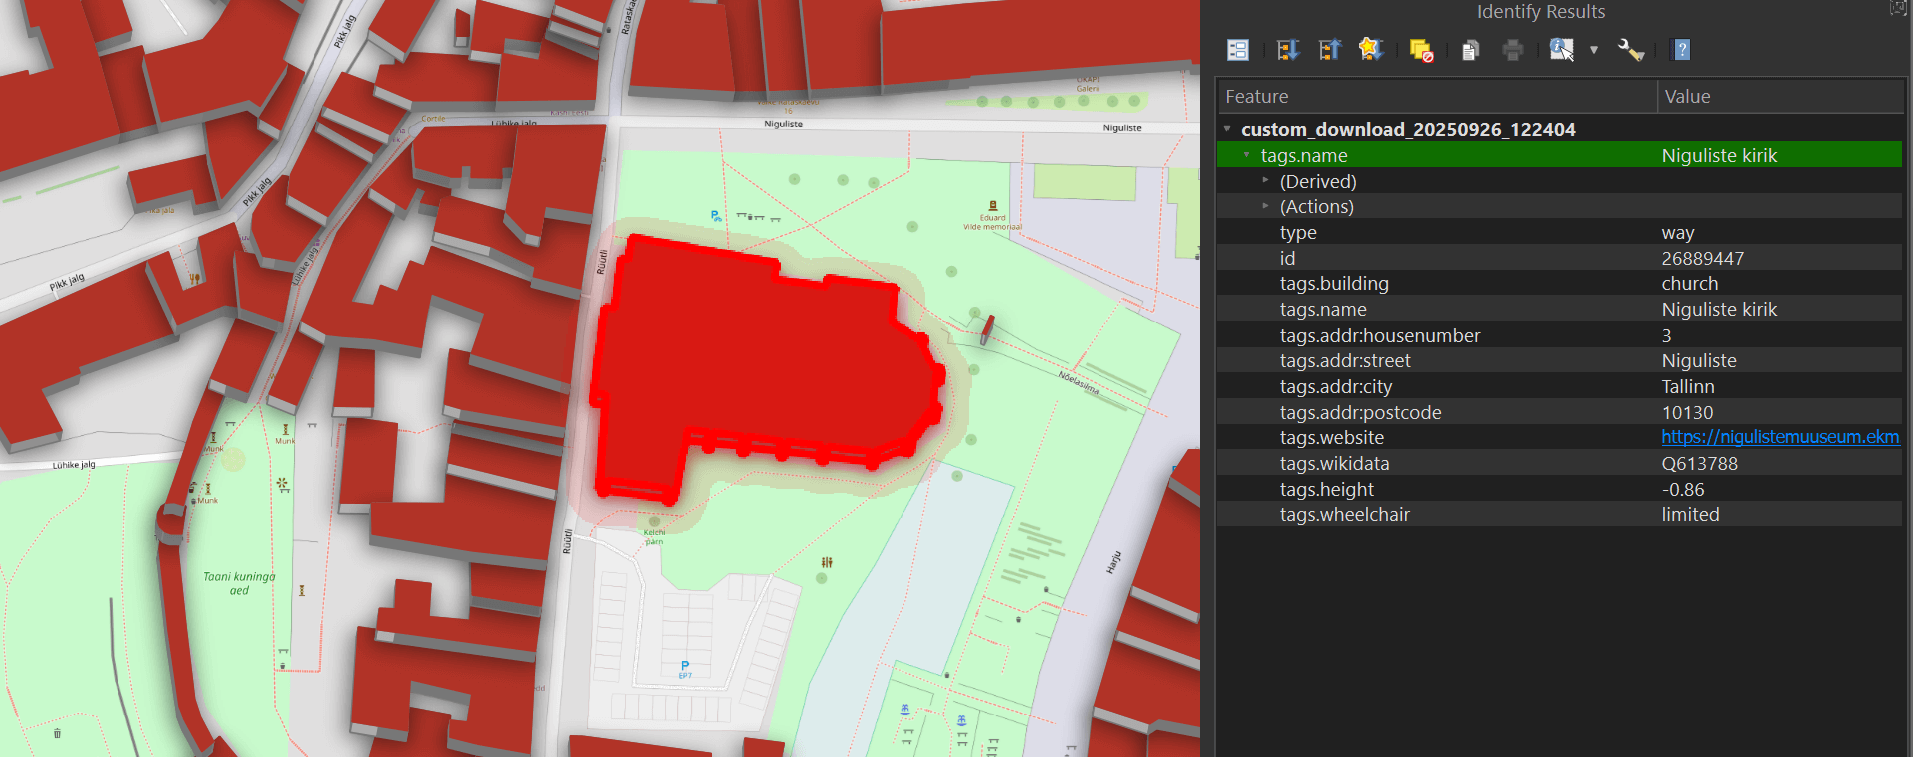
The Parquet file you saved can also be read via DuckDB and even dropped into Esri's ArcGIS Pro 3.5 or newer if you have it installed on your machine.
Bounding Boxes
Each of Layercake's deliverables is spatially sorted and in columns, rather than rows. These columns provide easier-to-spot patterns for ZStandard when it compresses the underlying data.
There are also row-groups where there are minimum and maximum values cached for each column every 122K rows in the Buildings files.
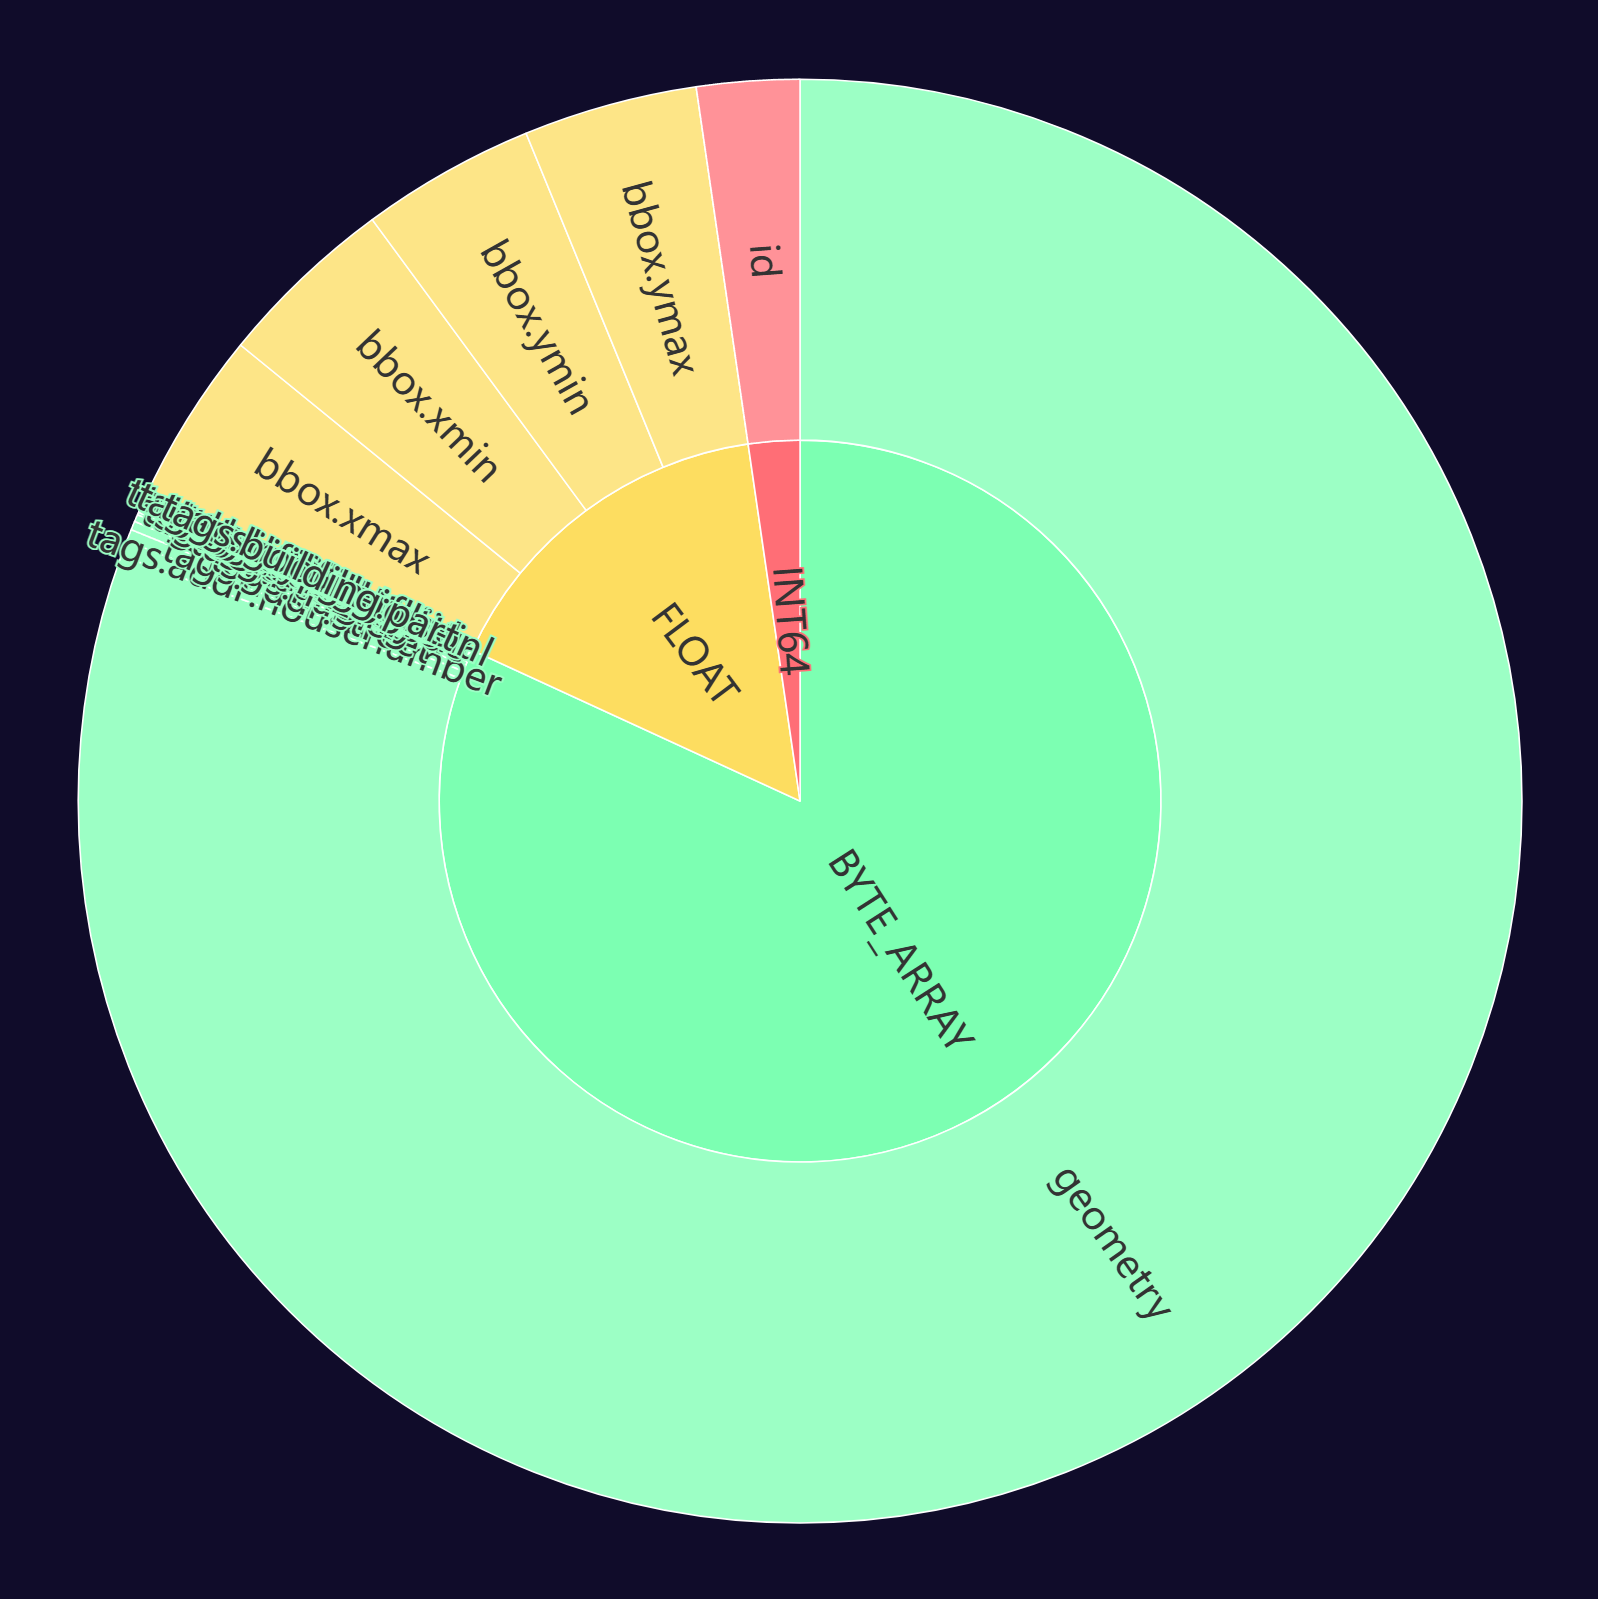
There are bounding box columns around each piece of geometry. These are much smaller than the geometry itself. Since they are spatially sorted, the row-group statistics helps tools like QGIS' GeoParquet Plugin and DuckDB skip over the parts of the 39 GB file that aren't relevant to any given query.
Below is a pie chart showing how much space each column takes up in the Buildings file. The bbox fields are much smaller than the geometry field.
$ python3 ~/pqview/main.py \
    types --html \
    buildings.parquet \
    > buildings.html
The DuckDB and the GeoParquet Downloader Plugin for QGIS can use these bounding boxes to download data quicker than it would if it had used the geometry field alone.
The following counted the number of instances of each value in the type field in the 39 GB Buildings Parquet file and only needed 2.2 MB of bandwidth.
$ ~/duckdb
EXPLAIN ANALYZE
    SELECT   COUNT(*),
             type
    FROM     READ_PARQUET('https://data.openstreetmap.us/layercake/buildings.parquet')
    GROUP BY 2
    ORDER BY 1 DESC;
┌─────────────────────────────────────┐
│┌───────────────────────────────────┐│
││    Query Profiling Information    ││
│└───────────────────────────────────┘│
└─────────────────────────────────────┘
EXPLAIN ANALYZE     SELECT   COUNT(*),              type     FROM     READ_PARQUET('https://data.openstreetmap.us/layercake/buildings.parquet')     GROUP BY 2     ORDER BY 1 DESC;
┌─────────────────────────────────────┐
│┌───────────────────────────────────┐│
││         HTTPFS HTTP Stats         ││
││                                   ││
││            in: 2.2 MiB            ││
││            out: 0 bytes           ││
││              #HEAD: 1             ││
││             #GET: 5372            ││
││              #PUT: 0              ││
││              #POST: 0             ││
││             #DELETE: 0            ││
│└───────────────────────────────────┘│
└─────────────────────────────────────┘
┌────────────────────────────────────────────────┐
│┌──────────────────────────────────────────────┐│
││              Total Time: 194.39s             ││
│└──────────────────────────────────────────────┘│
└────────────────────────────────────────────────┘
┌───────────────────────────┐
│           QUERY           │
└─────────────┬─────────────┘
┌─────────────┴─────────────┐
│      EXPLAIN_ANALYZE      │
│    ────────────────────   │
│           0 Rows          │
│          (0.00s)          │
└─────────────┬─────────────┘
┌─────────────┴─────────────┐
│          ORDER_BY         │
│    ────────────────────   │
│     count_star() DESC     │
│                           │
│           2 Rows          │
│          (0.00s)          │
└─────────────┬─────────────┘
┌─────────────┴─────────────┐
│         PROJECTION        │
│    ────────────────────   │
│        count_star()       │
│             1             │
│                           │
│           2 Rows          │
│          (0.00s)          │
└─────────────┬─────────────┘
┌─────────────┴─────────────┐
│       HASH_GROUP_BY       │
│    ────────────────────   │
│         Groups: #0        │
│                           │
│        Aggregates:        │
│        count_star()       │
│                           │
│           2 Rows          │
│          (0.88s)          │
└─────────────┬─────────────┘
┌─────────────┴─────────────┐
│         PROJECTION        │
│    ────────────────────   │
│            type           │
│                           │
│       657586639 Rows      │
│          (0.04s)          │
└─────────────┬─────────────┘
┌─────────────┴─────────────┐
│         TABLE_SCAN        │
│    ────────────────────   │
│         Function:         │
│        READ_PARQUET       │
│                           │
│     Projections: type     │
│    Total Files Read: 1    │
│                           │
│       657586639 Rows      │
│         (4502.25s)        │
└───────────────────────────┘
Only needing to look at columns of interest, rather than rows, along with being able to use statistics in some cases, rather than underlying data has a huge impact on bandwidth usage and query times.
Clustering Values
Parquet files are well-optimised to examine value distributions in individual columns. Below you can see how diverse the value distributions are in each of the columns for the building dataset.
I need to look into techniques around clustering these values and ideally turning them in numeric rather than free-text form where possible.
$ wget -c https://data.openstreetmap.us/layercake/buildings.parquet
$ ~/duckdb
SELECT   column_name,
         column_type,
         null_percentage,
         approx_unique,
         min,
         max
FROM     (SUMMARIZE
          SELECT * EXCLUDE(geometry, bbox, tags),
                 tags.*
          FROM   'buildings.parquet')
ORDER BY 1;
┌───────────────────┬─────────────┬─────────────────┬───────────────┬─────────────────────────────────────┬──────────────────────────────────────────┐
│    column_name    │ column_type │ null_percentage │ approx_unique │                 min                 │                   max                    │
│      varchar      │   varchar   │  decimal(9,2)   │     int64     │               varchar               │                 varchar                  │
├───────────────────┼─────────────┼─────────────────┼───────────────┼─────────────────────────────────────┼──────────────────────────────────────────┤
│ access            │ VARCHAR     │           99.98 │            64 │ agricultural                        │ 関係者のみq                             │
│ addr:city         │ VARCHAR     │           90.41 │        214287 │                                     │ h                                       │
│ addr:housenumber  │ VARCHAR     │           87.26 │        903255 │                                     │ フ98-1                                │
│ addr:postcode     │ VARCHAR     │           91.48 │        874940 │  040315                             │ 998−0054                          │
│ addr:street       │ VARCHAR     │           87.51 │       2009837 │                                     │ 𫙮魚坑路                                 │
│ building          │ VARCHAR     │            0.00 │          8183 │ #HKUSTChangeMaker2025               │ 홈플러스_천안점                          │
│ building:colour   │ VARCHAR     │           99.85 │         73829 │ #                                   │ 어두운회색                               │
│ building:flats    │ VARCHAR     │           99.64 │          2144 │ #OFC;2;3;4                          │ 8                                       │
│ building:levels   │ VARCHAR     │           94.76 │          1956 │                                     │ 9                                       │
│ building:material │ VARCHAR     │           99.69 │          2577 │ "cement_block"                      │ 鐵皮屋                                   │
│ building:part     │ VARCHAR     │           99.99 │           196 │ *                                   │ 金球                                     │
│ building:use      │ VARCHAR     │           99.89 │           960 │ 0                                   │ বাসা এবং অফিস                                │
│ height            │ VARCHAR     │           97.09 │        142743 │ "                                   │ 8                                       │
│ id                │ BIGINT      │            0.00 │     605442738 │ 114                                 │ 1445313890                               │
│ name              │ VARCHAR     │           98.80 │       4616374 │  Lucky Plaza                        │ 𫙮魚隧道西側機房                         │
│ roof:colour       │ VARCHAR     │           99.72 │        127591 │  #B62121                            │ v                                       │
│ roof:height       │ VARCHAR     │           99.95 │          1449 │ #6D7367                             │ ß.3                                      │
│ roof:levels       │ VARCHAR     │           99.31 │           247 │ !                                   │ ß.5                                      │
│ roof:material     │ VARCHAR     │           99.72 │          1016 │ "Deutsches Haus August Fiege"       │ ഓട്                                       │
│ roof:orientation  │ VARCHAR     │           99.85 │           227 │ #333333                             │ west                                     │
│ roof:shape        │ VARCHAR     │           98.78 │           757 │ "Berliner Dach"                     │ h                                       │
│ start_date        │ VARCHAR     │           97.56 │         34325 │ "first recorded 1569"               │ 高雄市                                   │
│ type              │ VARCHAR     │            0.00 │             2 │ relation                            │ way                                      │
│ website           │ VARCHAR     │           99.86 │        756480 │ 'https:/msc-altenbach.de            │ 홈페이지 http://www.aritaum.com/         │
│ wheelchair        │ VARCHAR     │           99.94 │            66 │ 0                                   │ 海老山南第一公園公衆トイレ               │
│ wikidata          │ VARCHAR     │           99.91 │        657923 │ * (preencher se houver ID Wikidata) │ https://www.wikidata.org/wiki/Q136376633 │
│ wikipedia         │ VARCHAR     │           99.97 │        202600 │ 4735910                             │ 打铁关站                                 │
├───────────────────┴─────────────┴─────────────────┴───────────────┴─────────────────────────────────────┴──────────────────────────────────────────┤
│ 27 rows                                                                                                                                  6 columns │
└────────────────────────────────────────────────────────────────────────────────────────────────────────────────────────────────────────────────────┘