I was recently reviewing the Japanese building footprint data in Overture's August release and came across a large gap of buildings in Zushi, a town one hour's drive south of central Tokyo.
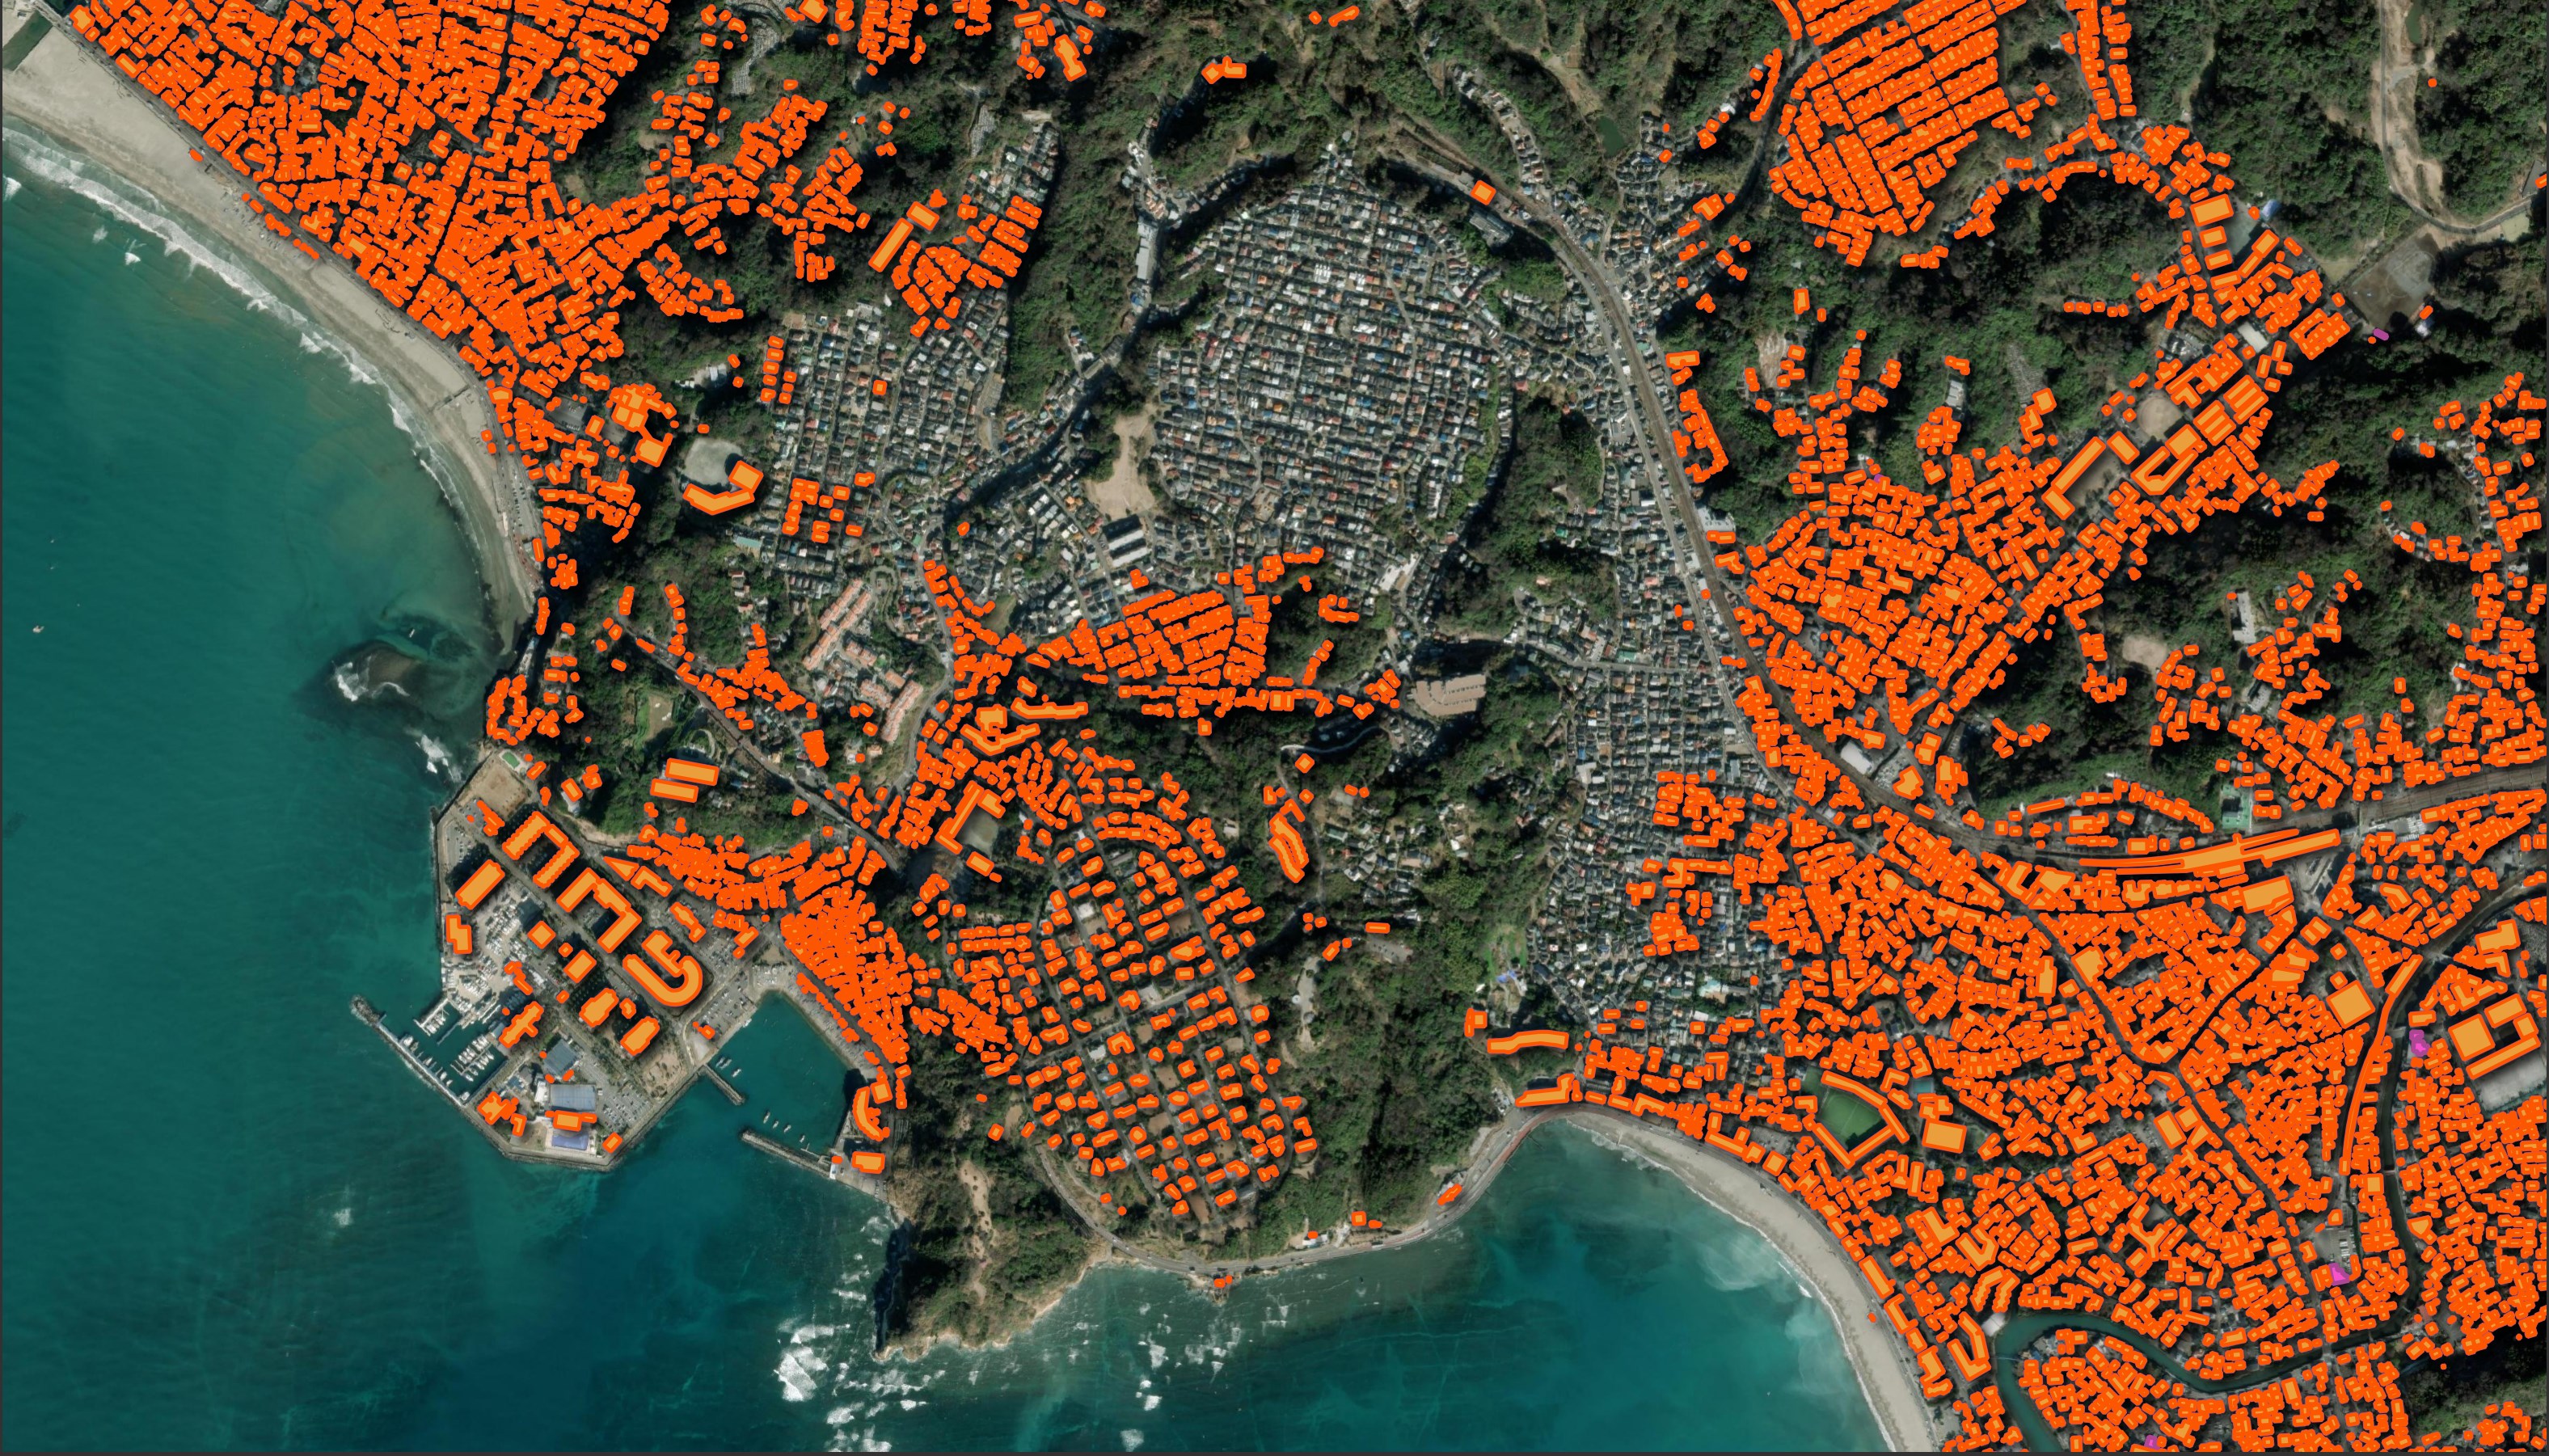
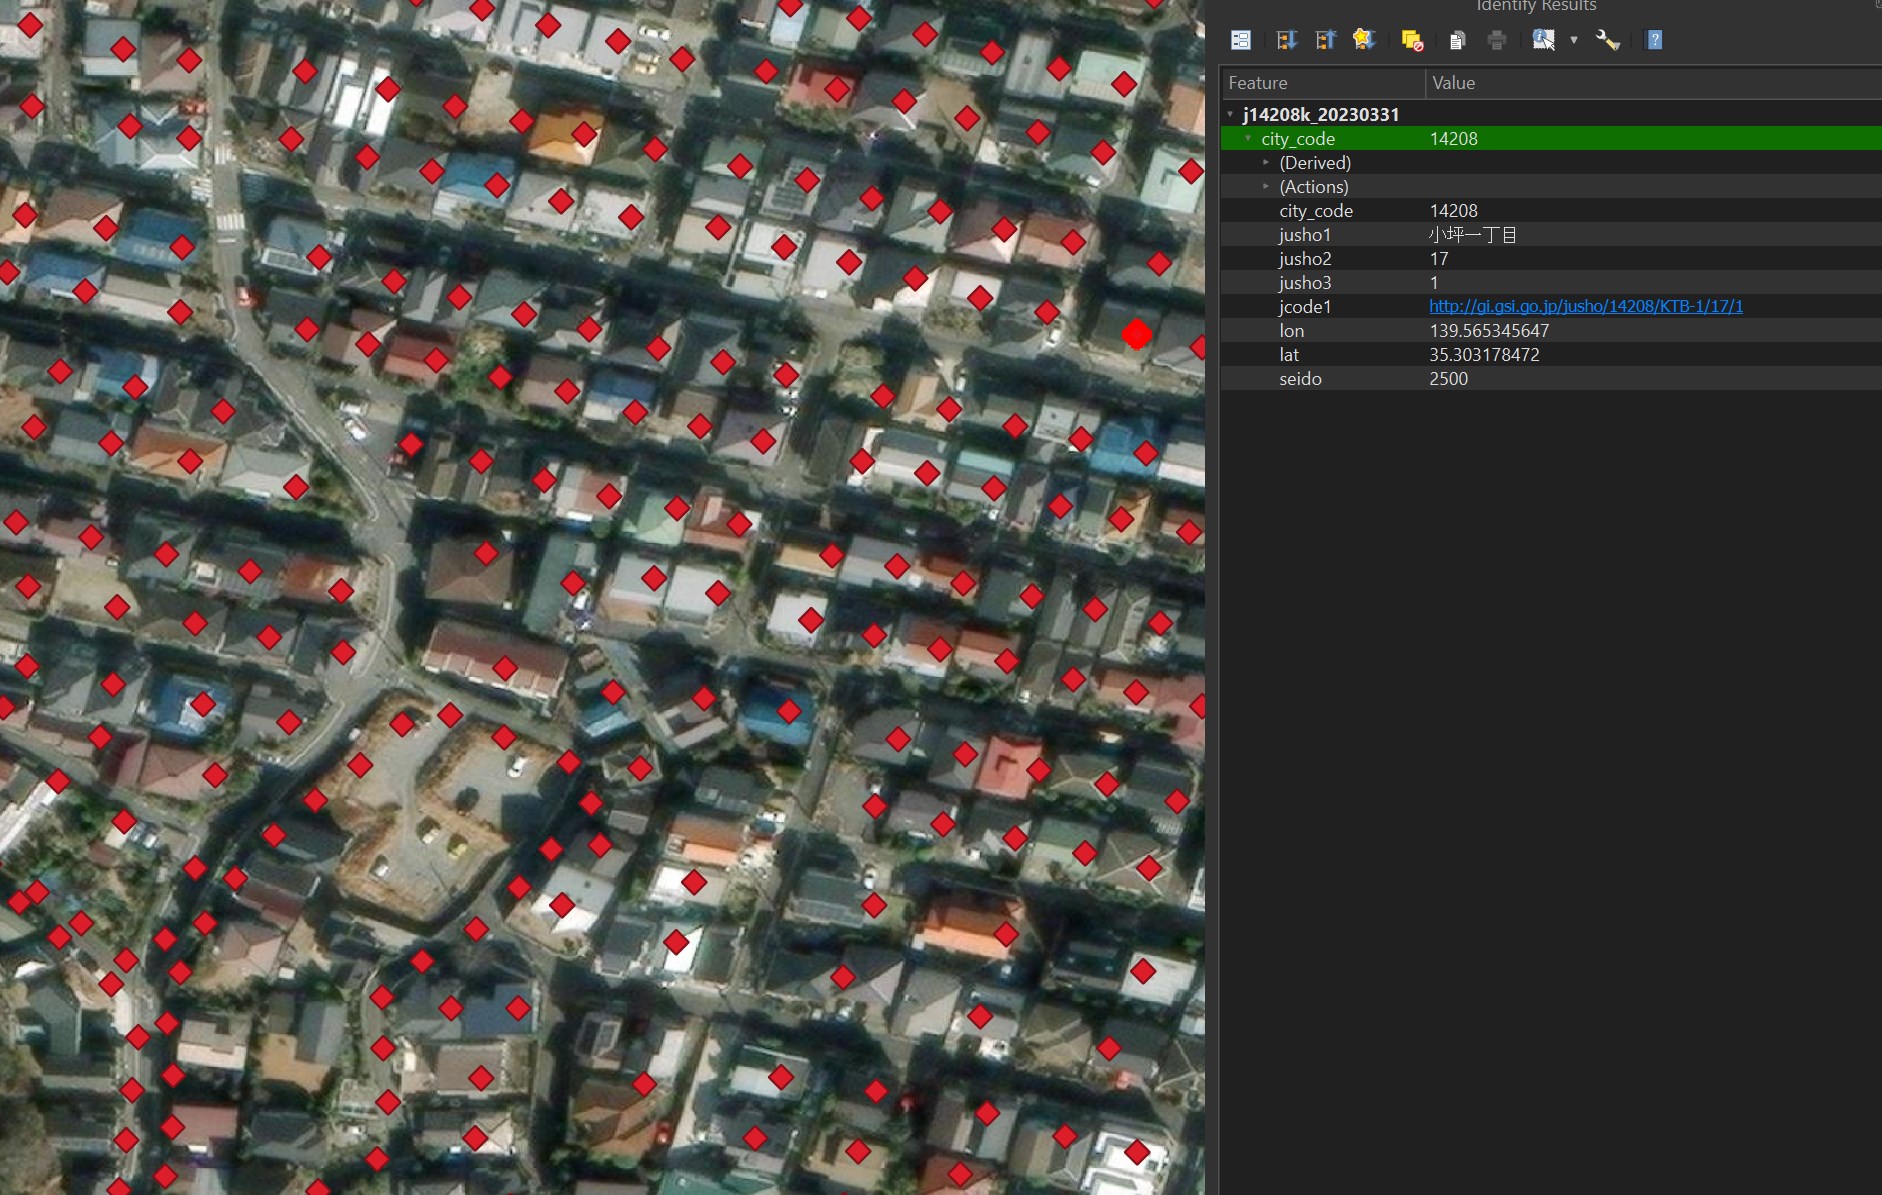
I mentioned the gap on LinkedIn and had several replies. One suggestion was to look at the Geospatial Information Authority of Japan's site for building footprint data. While I did find data for Zushi, it was point data for each building rather than polygons of their footprints.
I then had another suggestion from Hiroo Imaki, the President at Pacific Spatial Solutions Inc, a Seattle-based, Japan-focused geospatial data consultancy. He is working on a project called "Flateau".
Japan's Ministry of Land, Infrastructure, Transport and Tourism (MLIT) has been running a project called "PLATEAU". They're compiling 3D building data, along with a large amount of metadata and natural disaster risk data for buildings all across Japan.
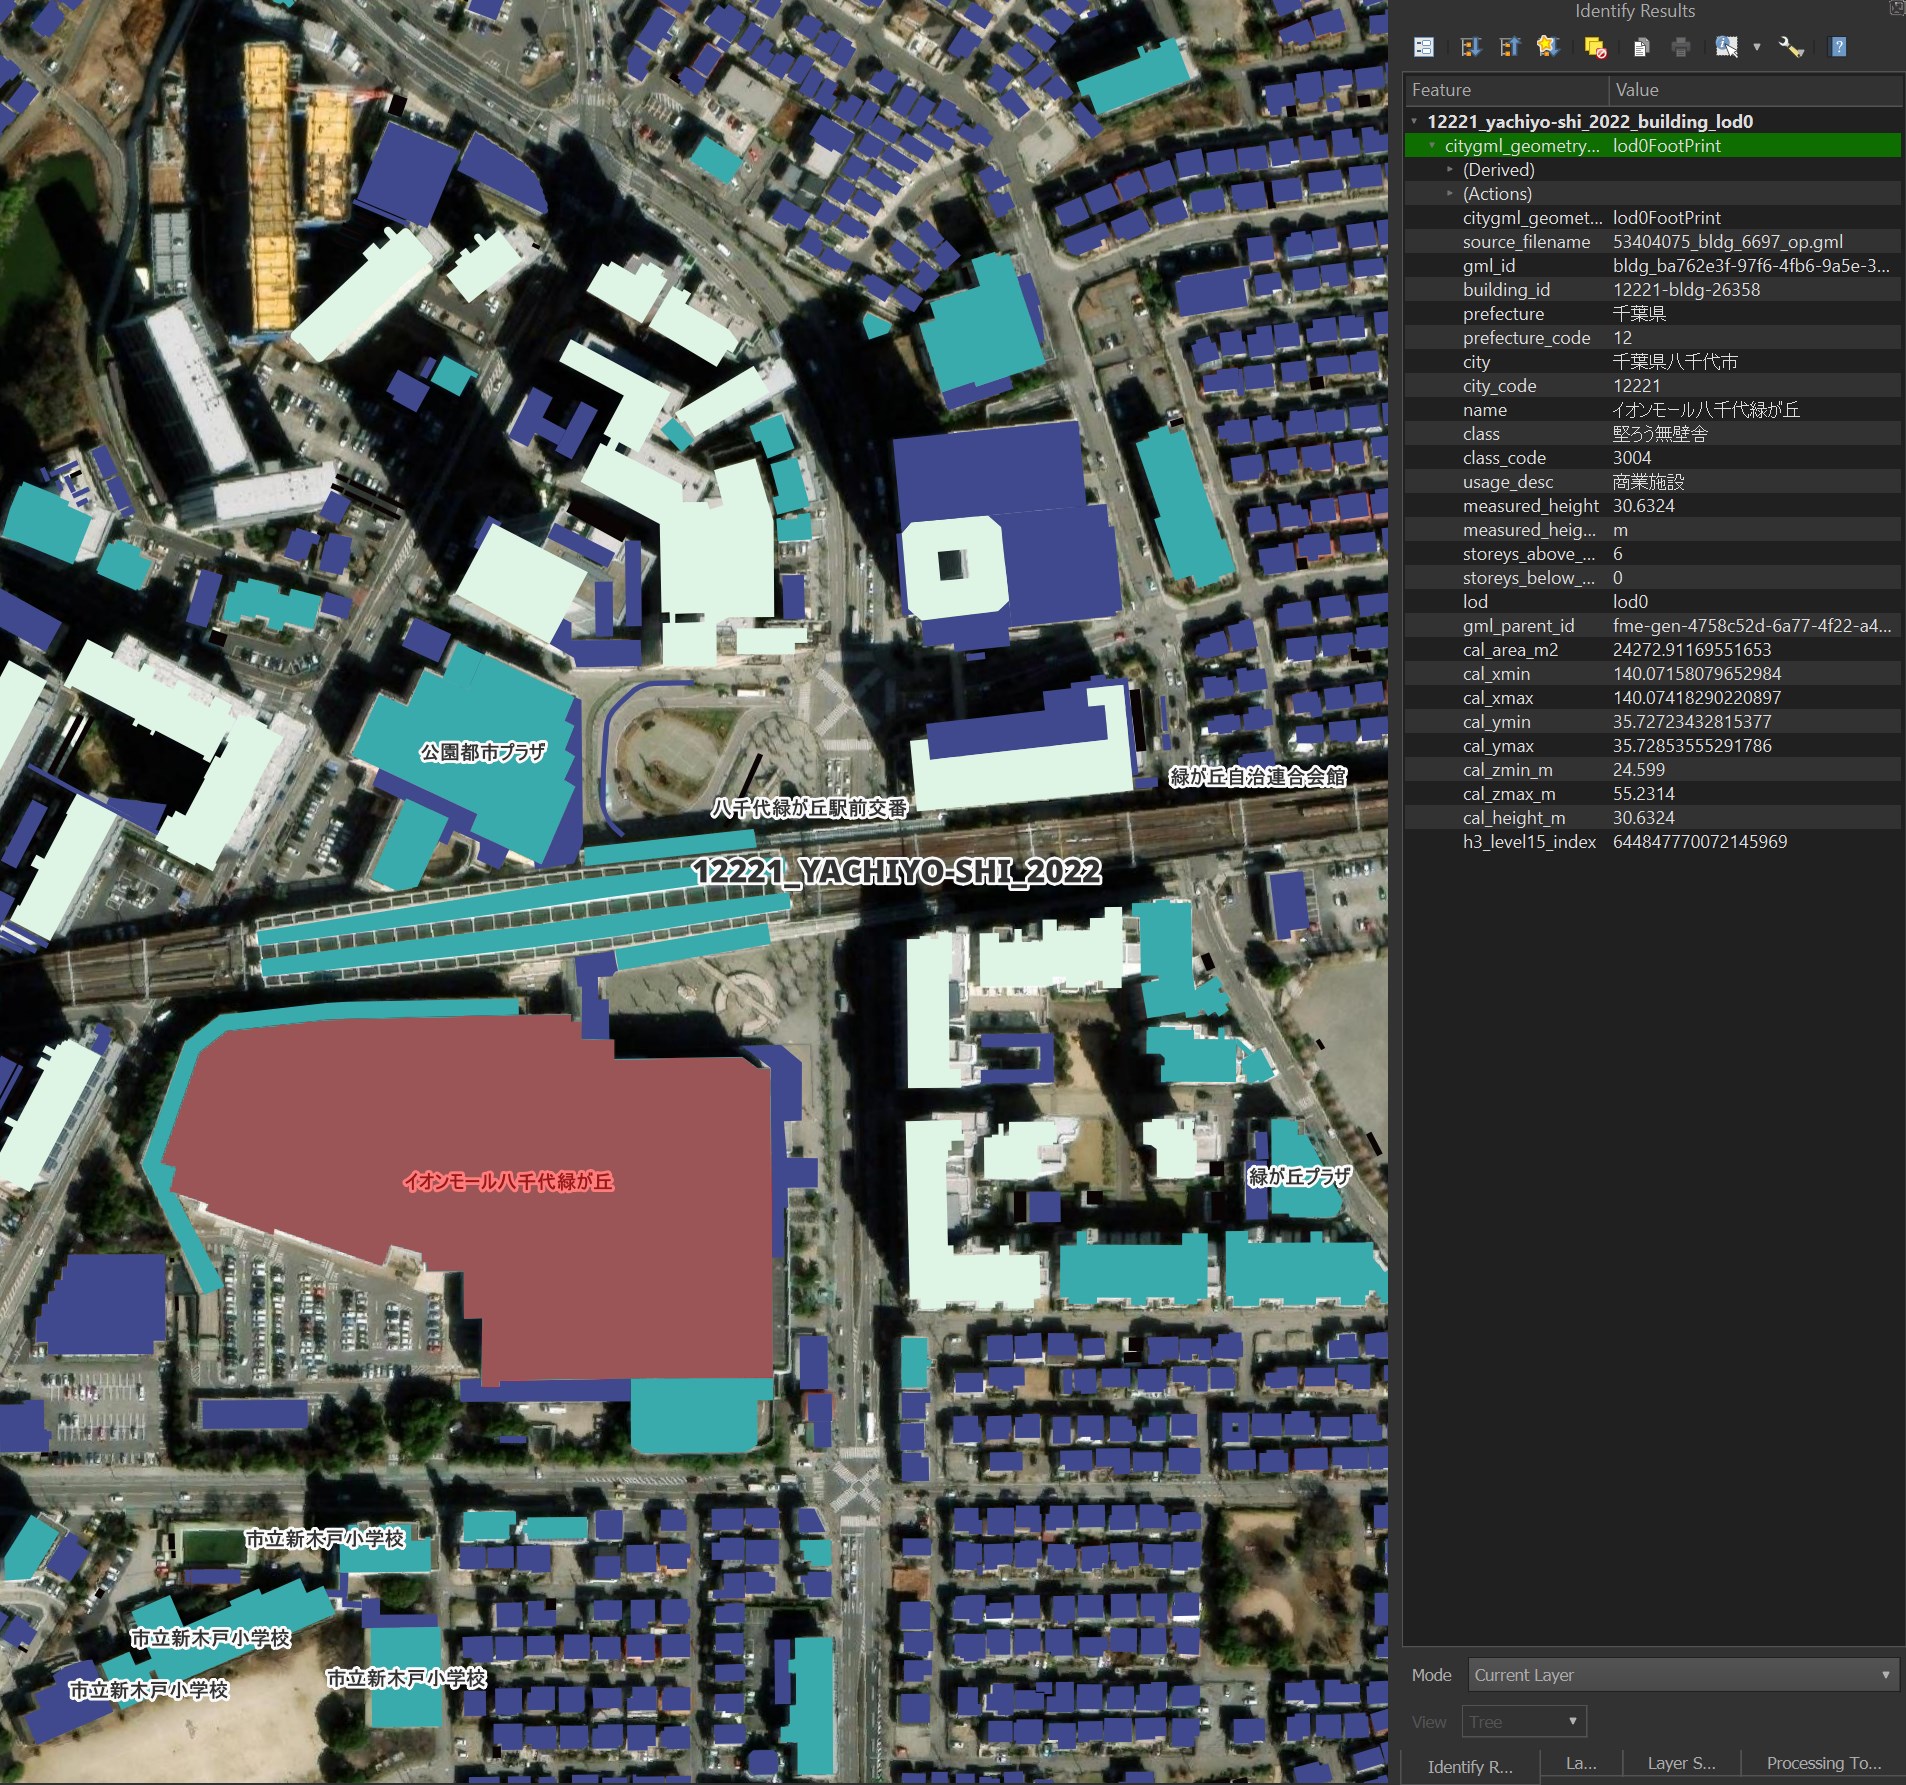
The Flateau project takes the PLATEAU dataset, which is largely in CityGML format, and converts it into 2D geometry and stores that along with select metadata into Parquet files that are hosted on S3. Below is a screenshot of one of the Parquet files in QGIS.
In this post, I'll explore Flateau, Japan's Parquet-formatted Building Footprint dataset.
My Workstation
I'm using a 6 GHz Intel Core i9-14900K CPU. It has 8 performance cores and 16 efficiency cores with a total of 32 threads and 32 MB of L2 cache. It has a liquid cooler attached and is housed in a spacious, full-sized, Cooler Master HAF 700 computer case. I've come across videos on YouTube where people have managed to overclock the i9-14900KF to 9.1 GHz.
The system has 96 GB of DDR5 RAM clocked at 6,000 MT/s and a 5th-generation, Crucial T700 4 TB NVMe M.2 SSD which can read at speeds up to 12,400 MB/s. There is a heatsink on the SSD to help keep its temperature down. This is my system's C drive.
The system is powered by a 1,200-watt, fully modular, Corsair Power Supply and is sat on an ASRock Z790 Pro RS Motherboard.
I'm running Ubuntu 22 LTS via Microsoft's Ubuntu for Windows on Windows 11 Pro. In case you're wondering why I don't run a Linux-based desktop as my primary work environment, I'm still using an Nvidia GTX 1080 GPU which has better driver support on Windows and I use ArcGIS Pro from time to time which only supports Windows natively.
Installing Prerequisites
I'll be using Python and a few other tools to help analyse the data in this post.
$ sudo apt update
$ sudo apt install \
    aws-cli \
    jq \
    python3-pip \
    python3-virtualenv \
    tree
I'll set up a Python Virtual Environment and install some dependencies.
$ virtualenv ~/.flateau
$ source ~/.flateau/bin/activate

$ pip install \
    boto3 \
    duckdb \
    rich
I'll use DuckDB, along with its H3, JSON, Parquet and Spatial extensions, in this post.
$ cd ~
$ wget -c https://github.com/duckdb/duckdb/releases/download/v1.0.0/duckdb_cli-linux-amd64.zip
$ unzip -j duckdb_cli-linux-amd64.zip
$ chmod +x duckdb
$ ~/duckdb
INSTALL h3 FROM community;
INSTALL json;
INSTALL parquet;
INSTALL spatial;
I'll set up DuckDB to load every installed extension each time it launches.
$ vi ~/.duckdbrc
.timer on
.width 180
LOAD h3;
LOAD json;
LOAD parquet;
LOAD spatial;
The maps in this post were rendered with QGIS version 3.38.0. QGIS is a desktop application that runs on Windows, macOS and Linux. The application has grown in popularity in recent years and has ~15M application launches from users around the world each month.
I used QGIS' Tile+ plugin to add geospatial context with Esri's World Imagery and CARTO's Basemaps to the maps.
Downloading Japanese Building Footprints
The Parquet files in Flateau's are a little over 38 GB in total as of this writing.
$ aws s3 --no-sign-request \
     sync \
     --exclude="*" \
     --include="*.parquet" \
     s3://flateau/data/flateau/ \
     ~/flateau
Data Fluency
The dataset is spread out amongst several folders and parquet files.
$ tree -d ~/flateau
flateau
├── 2022
│   ├── buildings
│   │   └── gpqt
│   └── buildings202312
│       └── gpqt
├── 2023
│   └── parquet
└── tokyo23
    └── 2022
        └── buildings
            └── 20231217
                ├── geoparquet
                └── parquet
I'll compile bounding boxes and other statistics from each parquet file to help build data fluency in this dataset.
$ python3
import json
from   pathlib       import Path

import duckdb
from   rich.progress import track


def parse_filename(filename):
    subject, year = None, None
    parts = filename.split('.')[0].split('_')

    pos = [num
           for num, x in enumerate(parts)
           if 'building' in x]
    if pos:
        subject = ' '.join(parts[pos[0] + 1:])

    pos = [num
           for num, x in enumerate(parts)
           if '20' in x and len(x) == 4]
    if pos:
        year = int(parts[pos[0]])

    return subject, year


def get_bbox(con, filename, geom_field):
    bbox = 'POLYGON((%(y1)f %(x1)f, %(y1)f %(x2)f, ' \
                    '%(y2)f %(x2)f, %(y2)f %(x1)f, ' \
                    '%(y1)f %(x1)f))'

    sql = '''SELECT MIN(ST_XMIN(ST_GEOMFROMWKB(%(geom_field)s))) AS xmin,
                    MIN(ST_YMIN(ST_GEOMFROMWKB(%(geom_field)s))) AS ymin,
                    MAX(ST_XMAX(ST_GEOMFROMWKB(%(geom_field)s))) AS xmax,
                    MAX(ST_YMAX(ST_GEOMFROMWKB(%(geom_field)s))) AS ymax
             FROM   READ_PARQUET(?);''' % {
                'geom_field': geom_field}

    try:
        df = con.sql(sql,
                     params=(filename, )).to_df()
    except Exception as exc:
        print(filename)
        print(exc)
        return None

    if not df.empty:
        out = json.loads(df.to_json())

        try:
            return bbox % {
               'x1': out['xmin']['0'],
               'x2': out['xmax']['0'],
               'y1': out['ymin']['0'],
               'y2': out['ymax']['0']}
        except TypeError:
            return None

    return None


con = duckdb.connect(database=':memory:')
con.sql('INSTALL parquet; LOAD parquet')
con.sql('INSTALL spatial; LOAD spatial')

sql = 'SUMMARIZE FROM READ_PARQUET(?)'

with open('stats.json', 'w') as f:
    for filename in track(list(Path('.').glob('flateau/**/*.parquet'))):
        subject, year = parse_filename(filename.name)

        rec = json.loads(con.sql(sql, params=(filename.as_posix(),))
                            .to_df()
                            .to_json())

        rec['num_bytes'] = filename.stat().st_size
        rec['filename']  = filename.as_posix(),
        rec['subject']   = subject
        rec['year']      = year

        # ['geometry_src_desc', 'geometry_src_desc_code', 'GEOM']
        geom_field = [y
                      for x, y in rec['column_name'].items()
                      if y.lower() in ('exterior', 'geom')]

        if geom_field:
            rec['bbox'] = get_bbox(con,
                                   filename.as_posix(),
                                   geom_field[0])
        else:
            rec['bbox'] = None

        f.write(json.dumps(rec, sort_keys=True) + '\n')
I'll load the results into a table in DuckDB.
$ ~/duckdb flateau.duckdb
CREATE OR REPLACE TABLE stats AS
    SELECT *
    FROM   READ_JSON('stats.json');
Flateau's Datasets
There are 14 dataset subjects within Flateau. The largest is the "lod0" dataset which contains the polygon footprints of Japan's buildings. There is also a centroid counterpart to this file.
SELECT   subject,
         ROUND(SUM(num_bytes) / (1024 ** 3), 1) AS num_gb
FROM     stats
GROUP BY 1
ORDER BY 2 DESC;
┌─────────────────────────┬────────┐
│         subject         │ num_gb │
│         varchar         │ double │
├─────────────────────────┼────────┤
│ lod0                    │   16.1 │
│ centroid lod0           │   10.2 │
│ detail                  │    3.6 │
│ data quality            │    3.4 │
│ risk flooding           │    2.1 │
│ extended attributes     │    0.6 │
│ generic attributes      │    0.6 │
│ polygon                 │    0.6 │
│ centroid                │    0.4 │
│ risk tsunami            │    0.3 │
│ risk high tide          │    0.2 │
│ risk land slide         │    0.2 │
│ risk internal overflow  │    0.1 │
│ large customer facility │    0.0 │
├─────────────────────────┴────────┤
│ 14 rows                2 columns │
└──────────────────────────────────┘
The "lod0" and centroid datasets are the only ones that contain geometry. The other datasets link via a primary key to these datasets.
WITH a AS (
    SELECT   subject,
             bbox IS NOT NULL AS has_geom,
             COUNT(*)         AS num_pqs
    FROM     stats
    GROUP BY 1, 2
)
PIVOT    a
ON       has_geom
USING    SUM(num_pqs)
GROUP BY subject
ORDER BY subject;
┌─────────────────────────┬────────┬────────┐
│         subject         │ false  │  true  │
│         varchar         │ int128 │ int128 │
├─────────────────────────┼────────┼────────┤
│ centroid                │        │      1 │
│ centroid lod0           │      1 │    445 │
│ data quality            │    407 │        │
│ detail                  │    384 │        │
│ extended attributes     │     49 │        │
│ generic attributes      │     30 │        │
│ large customer facility │     44 │        │
│ lod0                    │        │    447 │
│ polygon                 │      1 │        │
│ risk flooding           │    363 │        │
│ risk high tide          │     63 │        │
│ risk internal overflow  │     12 │        │
│ risk land slide         │    292 │        │
│ risk tsunami            │    156 │        │
├─────────────────────────┴────────┴────────┤
│ 14 rows                         3 columns │
└───────────────────────────────────────────┘
A Mosaic of Vector Data
Around 211 of Japan's 1,720 settlements have been surveyed for the PLATEAU dataset. Below is a heatmap of the building counts across the country that were collected in 2023.
$ ~/duckdb flateau.duckdb
COPY (
    WITH a AS (
        SELECT   H3_LATLNG_TO_CELL(ST_Y(ST_CENTROID(ST_GEOMFROMWKB(geom))),
                                   ST_X(ST_CENTROID(ST_GEOMFROMWKB(geom))),
                                   5) h3_val,
                 COUNT(*) num_recs
        FROM     READ_PARQUET('flateau/2023/parquet/*building_lod0*parquet')
        GROUP BY 1
    )
    SELECT H3_CELL_TO_BOUNDARY_WKT(h3_val)::GEOMETRY geom,
           num_recs
    FROM   a
) TO 'flateau.h3.gpkg'
    WITH (FORMAT GDAL,
          DRIVER 'GPKG',
          LAYER_CREATION_OPTIONS 'WRITE_BBOX=YES');
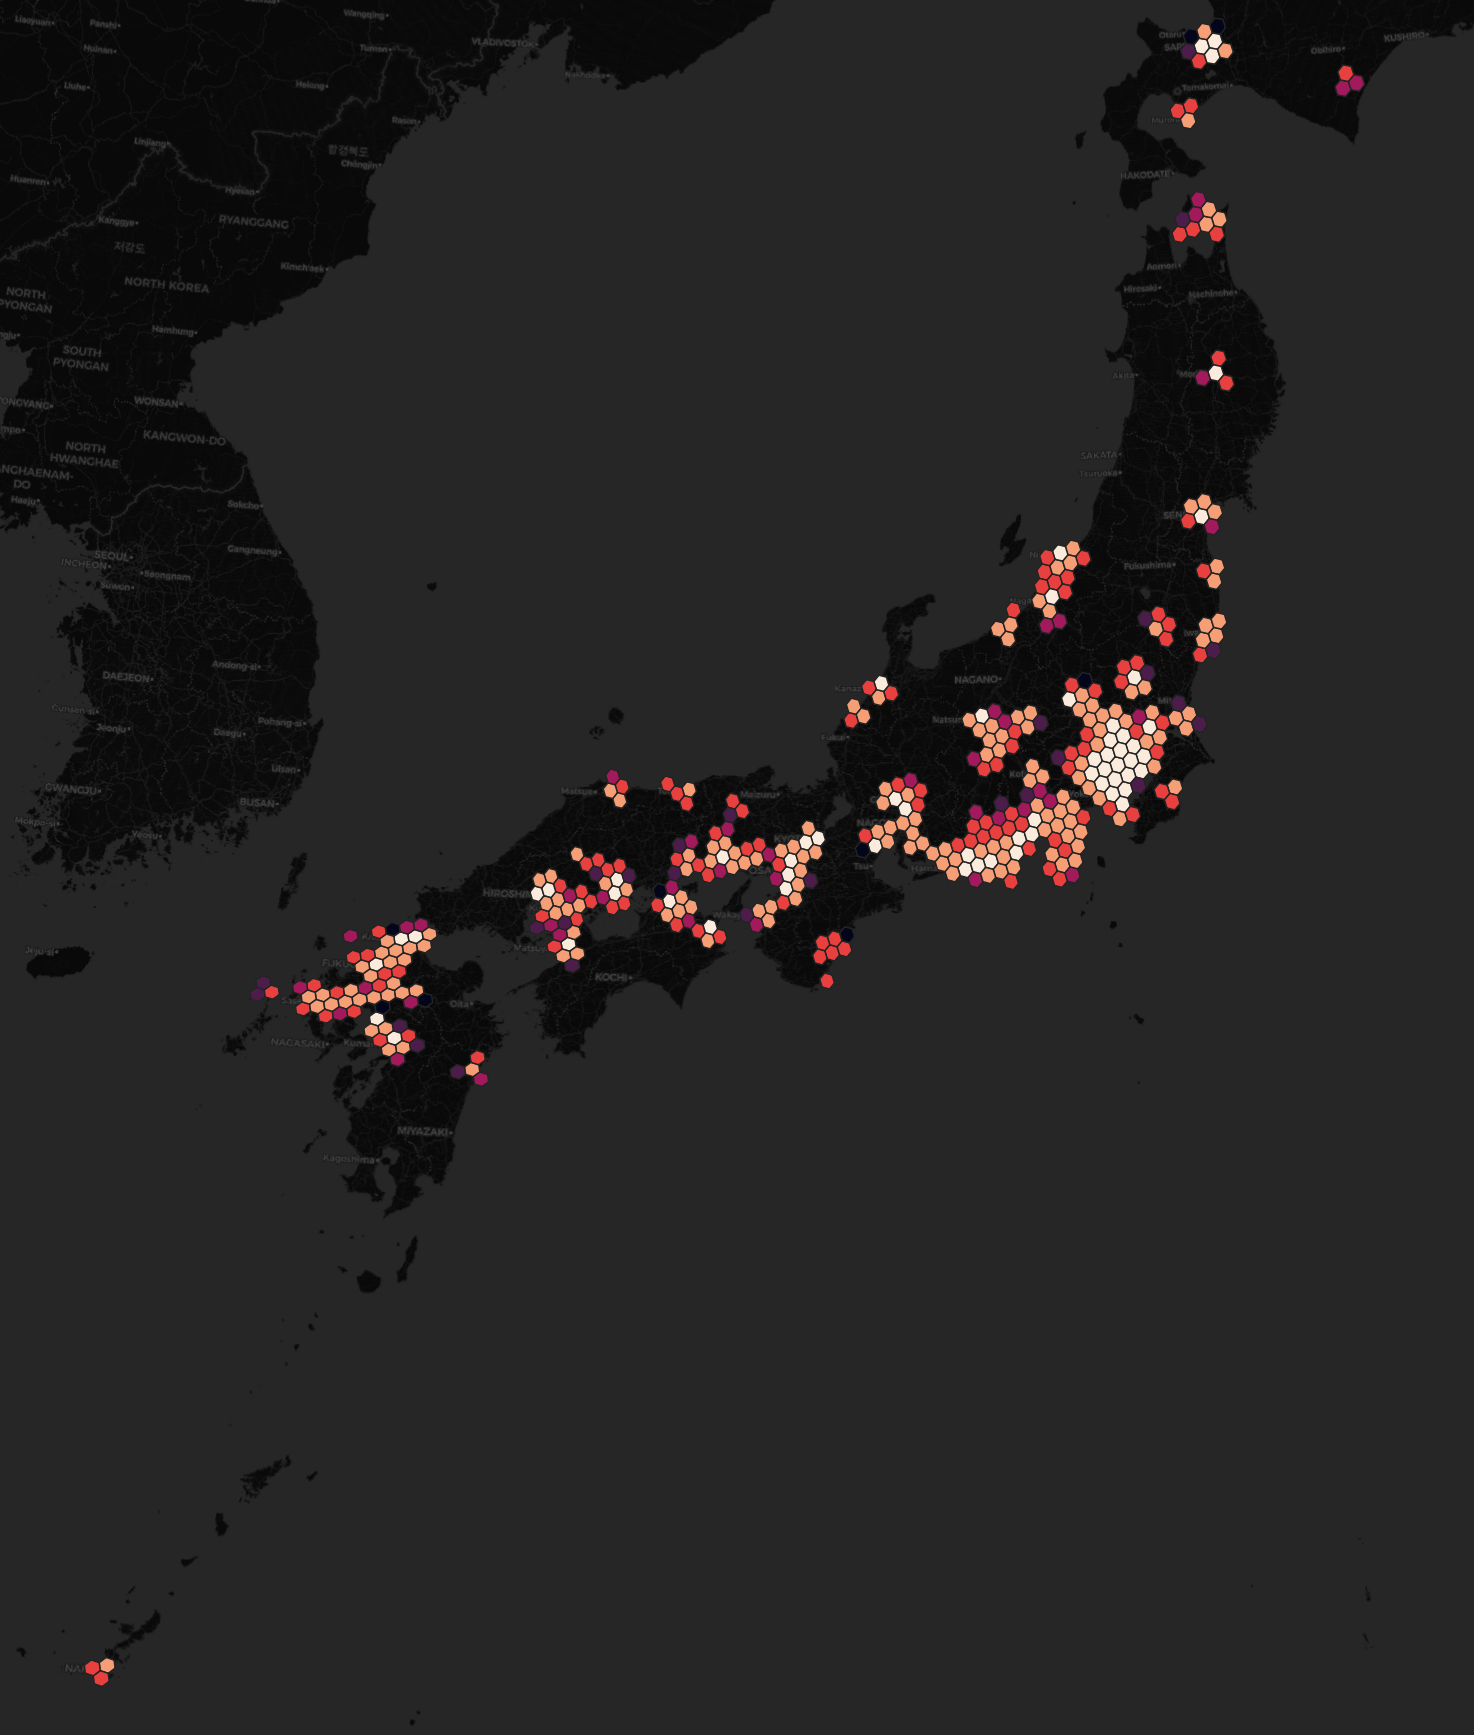
Some areas seem to get refreshed every year as the bounding boxes between years almost completely overlap. That said, I can't be certain of this nor what PLATEAU's policy on refreshes are.
$ ~/duckdb flateau.duckdb
COPY (
    SELECT REPLACE(SPLIT_PART(filename, '/', -1),
                   '_building_lod0.parquet',
                   '') as file_name,
           {min_x: MIN(cal_xmin),
            min_y: MIN(cal_ymin),
            max_x: MAX(cal_xmax),
            max_y: MAX(cal_ymax)}::BOX_2D::GEOMETRY AS geom
    FROM READ_PARQUET('flateau/*/buildings/gpqt/*building_lod0.parquet',
                      filename=true)
    GROUP BY filename
) TO 'bboxes.gpkg'
        WITH (FORMAT GDAL,
              DRIVER 'GPKG',
              LAYER_CREATION_OPTIONS 'WRITE_BBOX=YES');
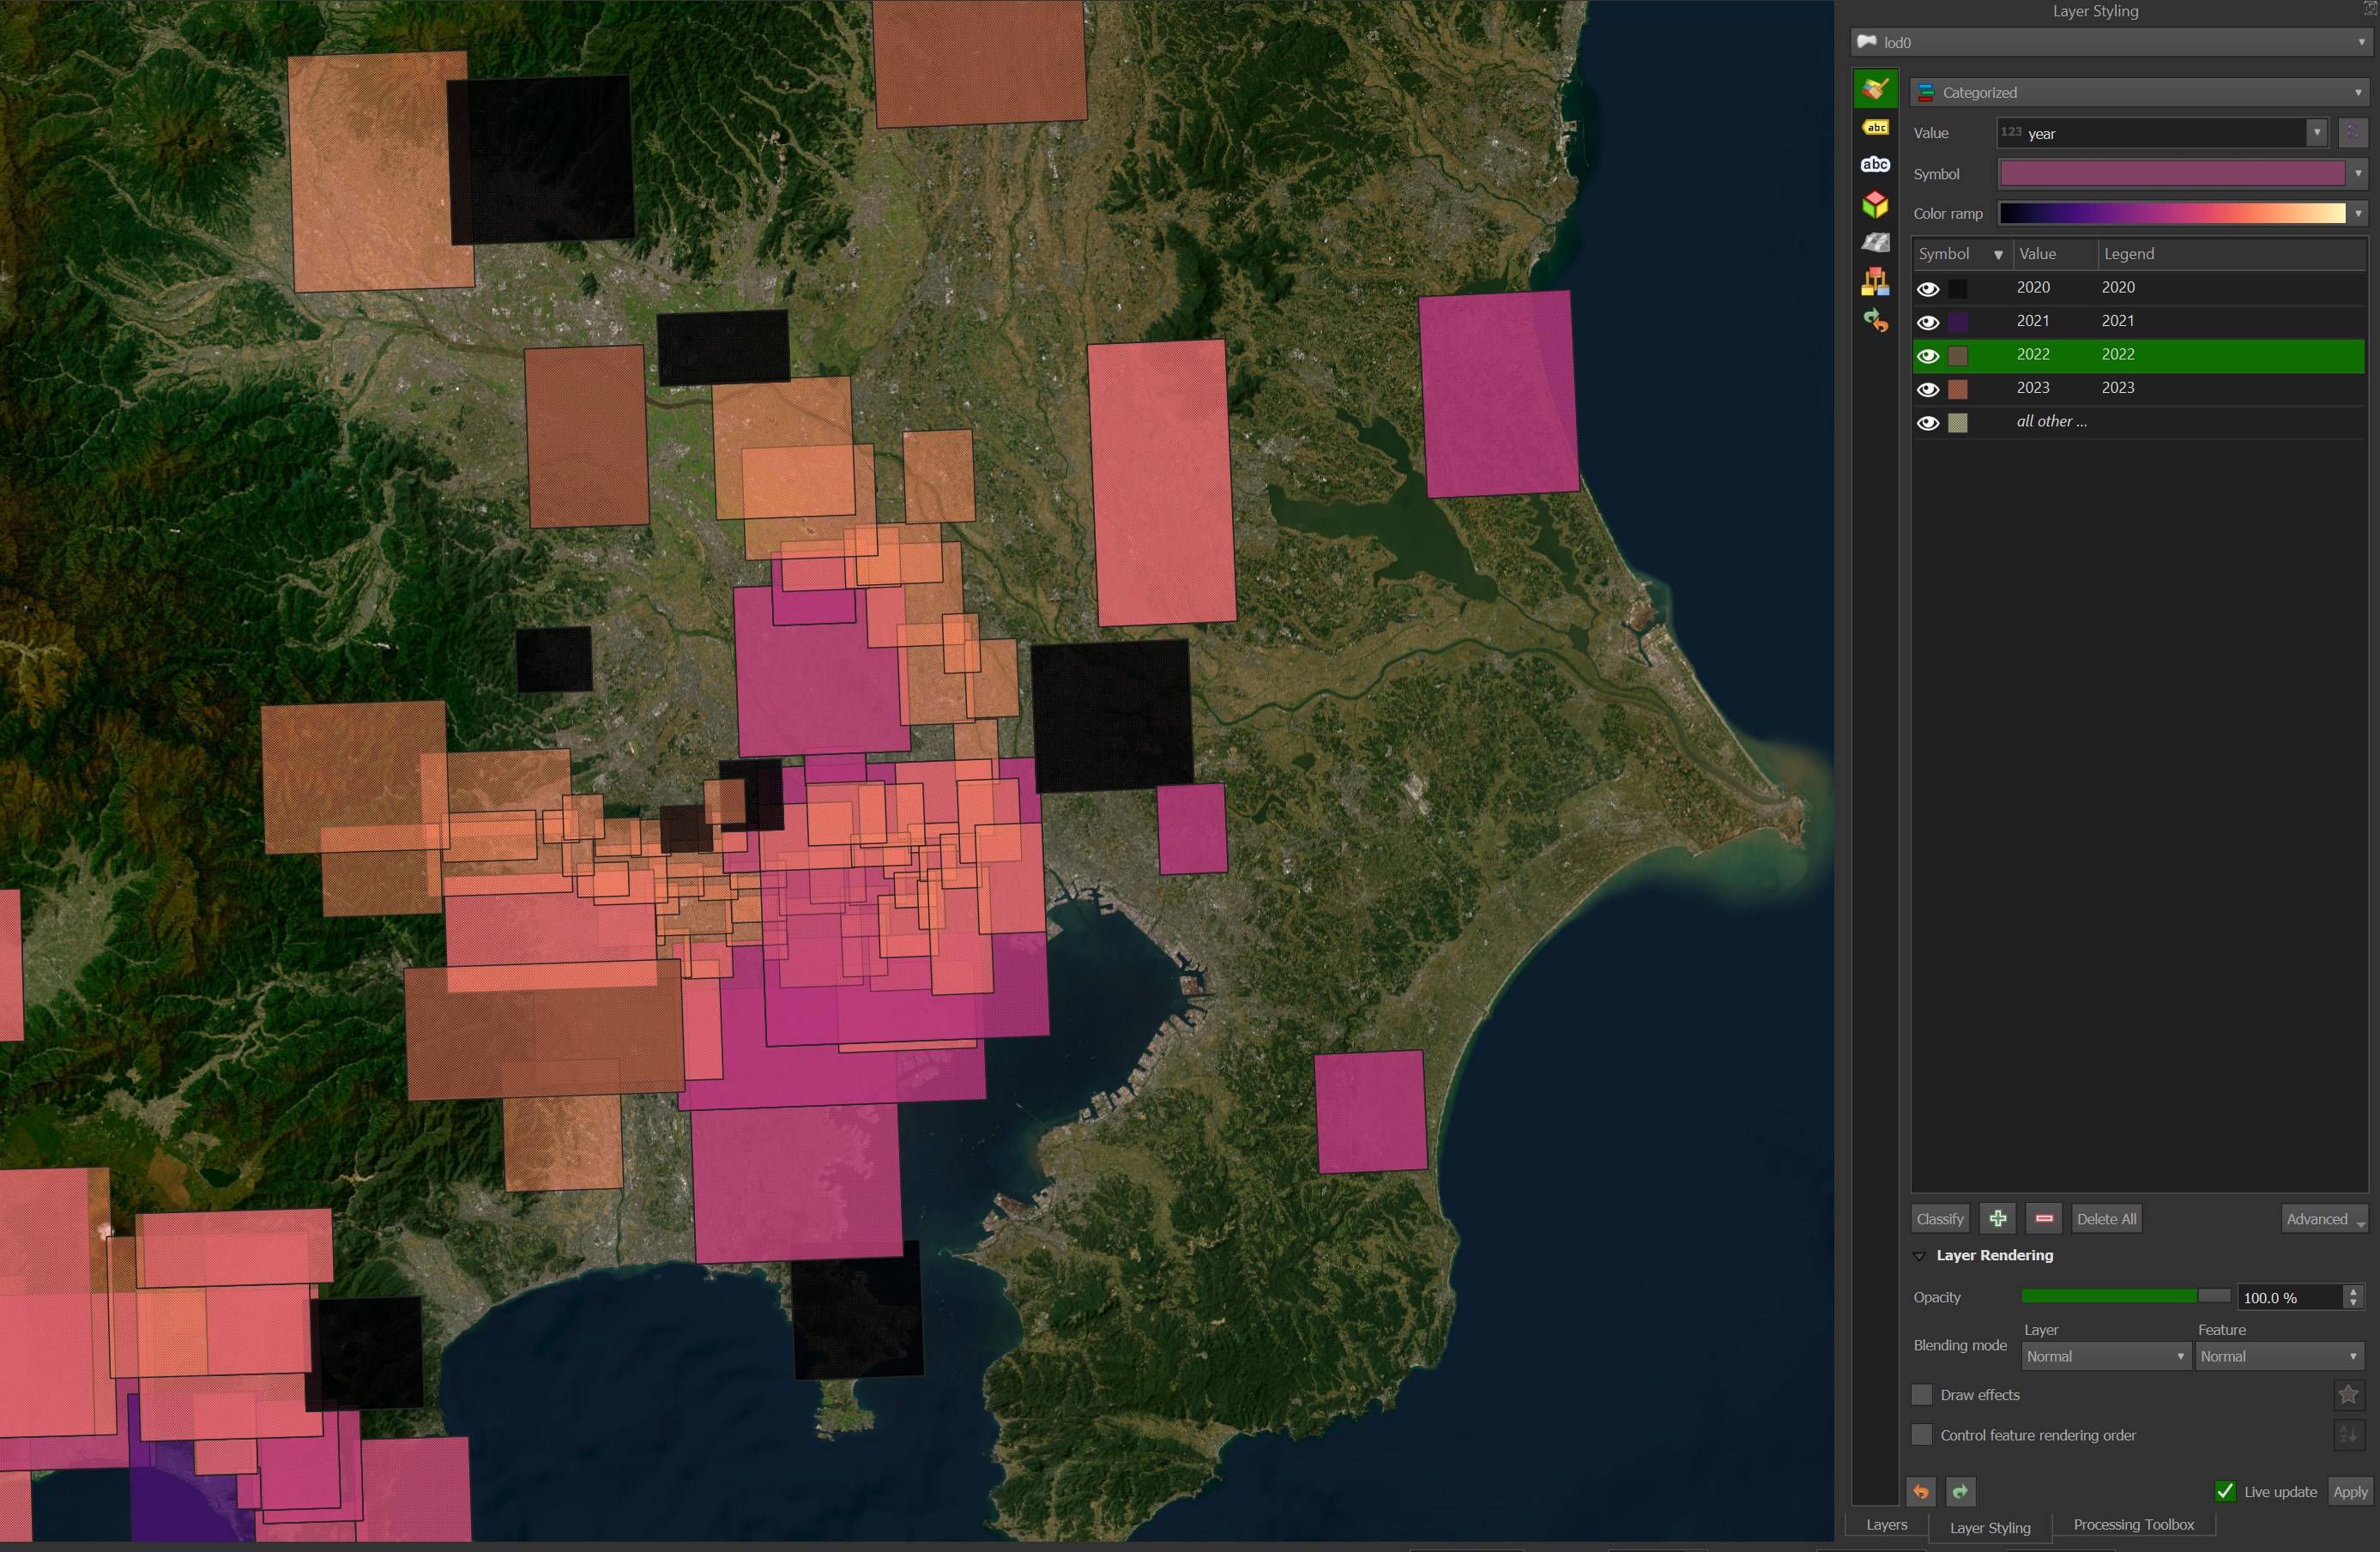
Within any one year, the bounding boxes don't completely overlap so if there is a policy to refresh data, it isn't on a sub-yearly basis.
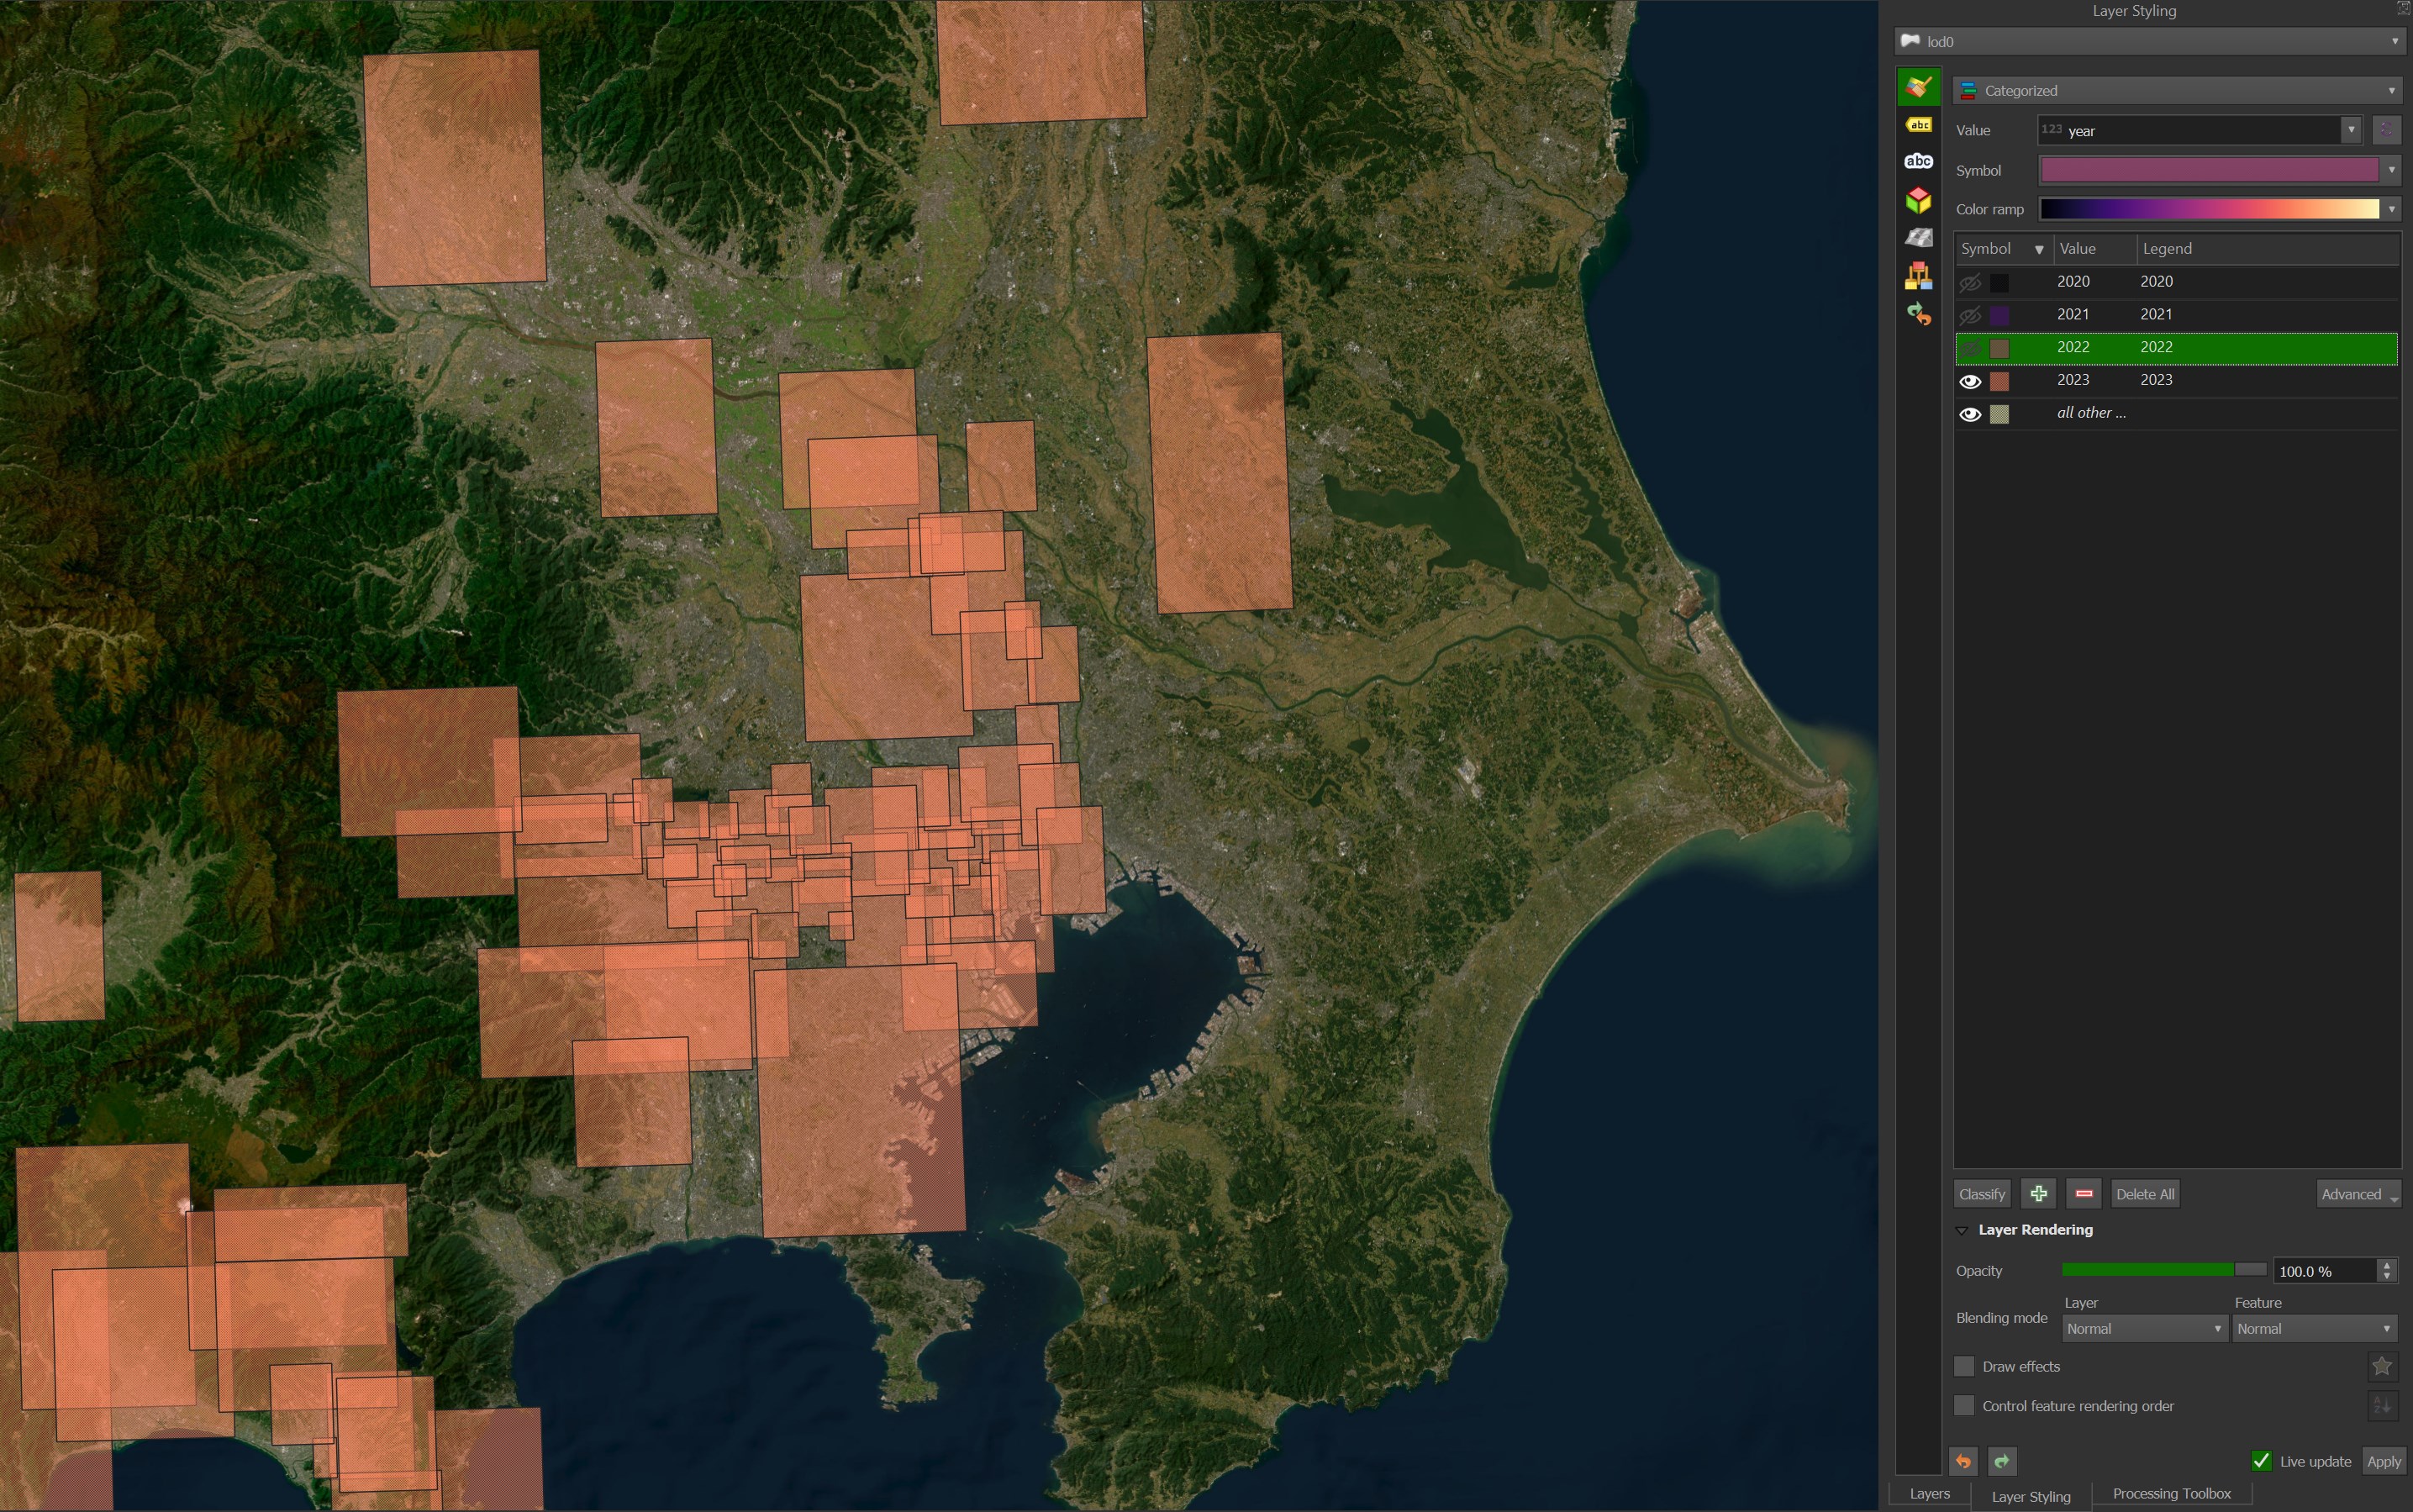
Bounding boxes can partially overlap but this is often down to the organic layout of Japan's settlements.
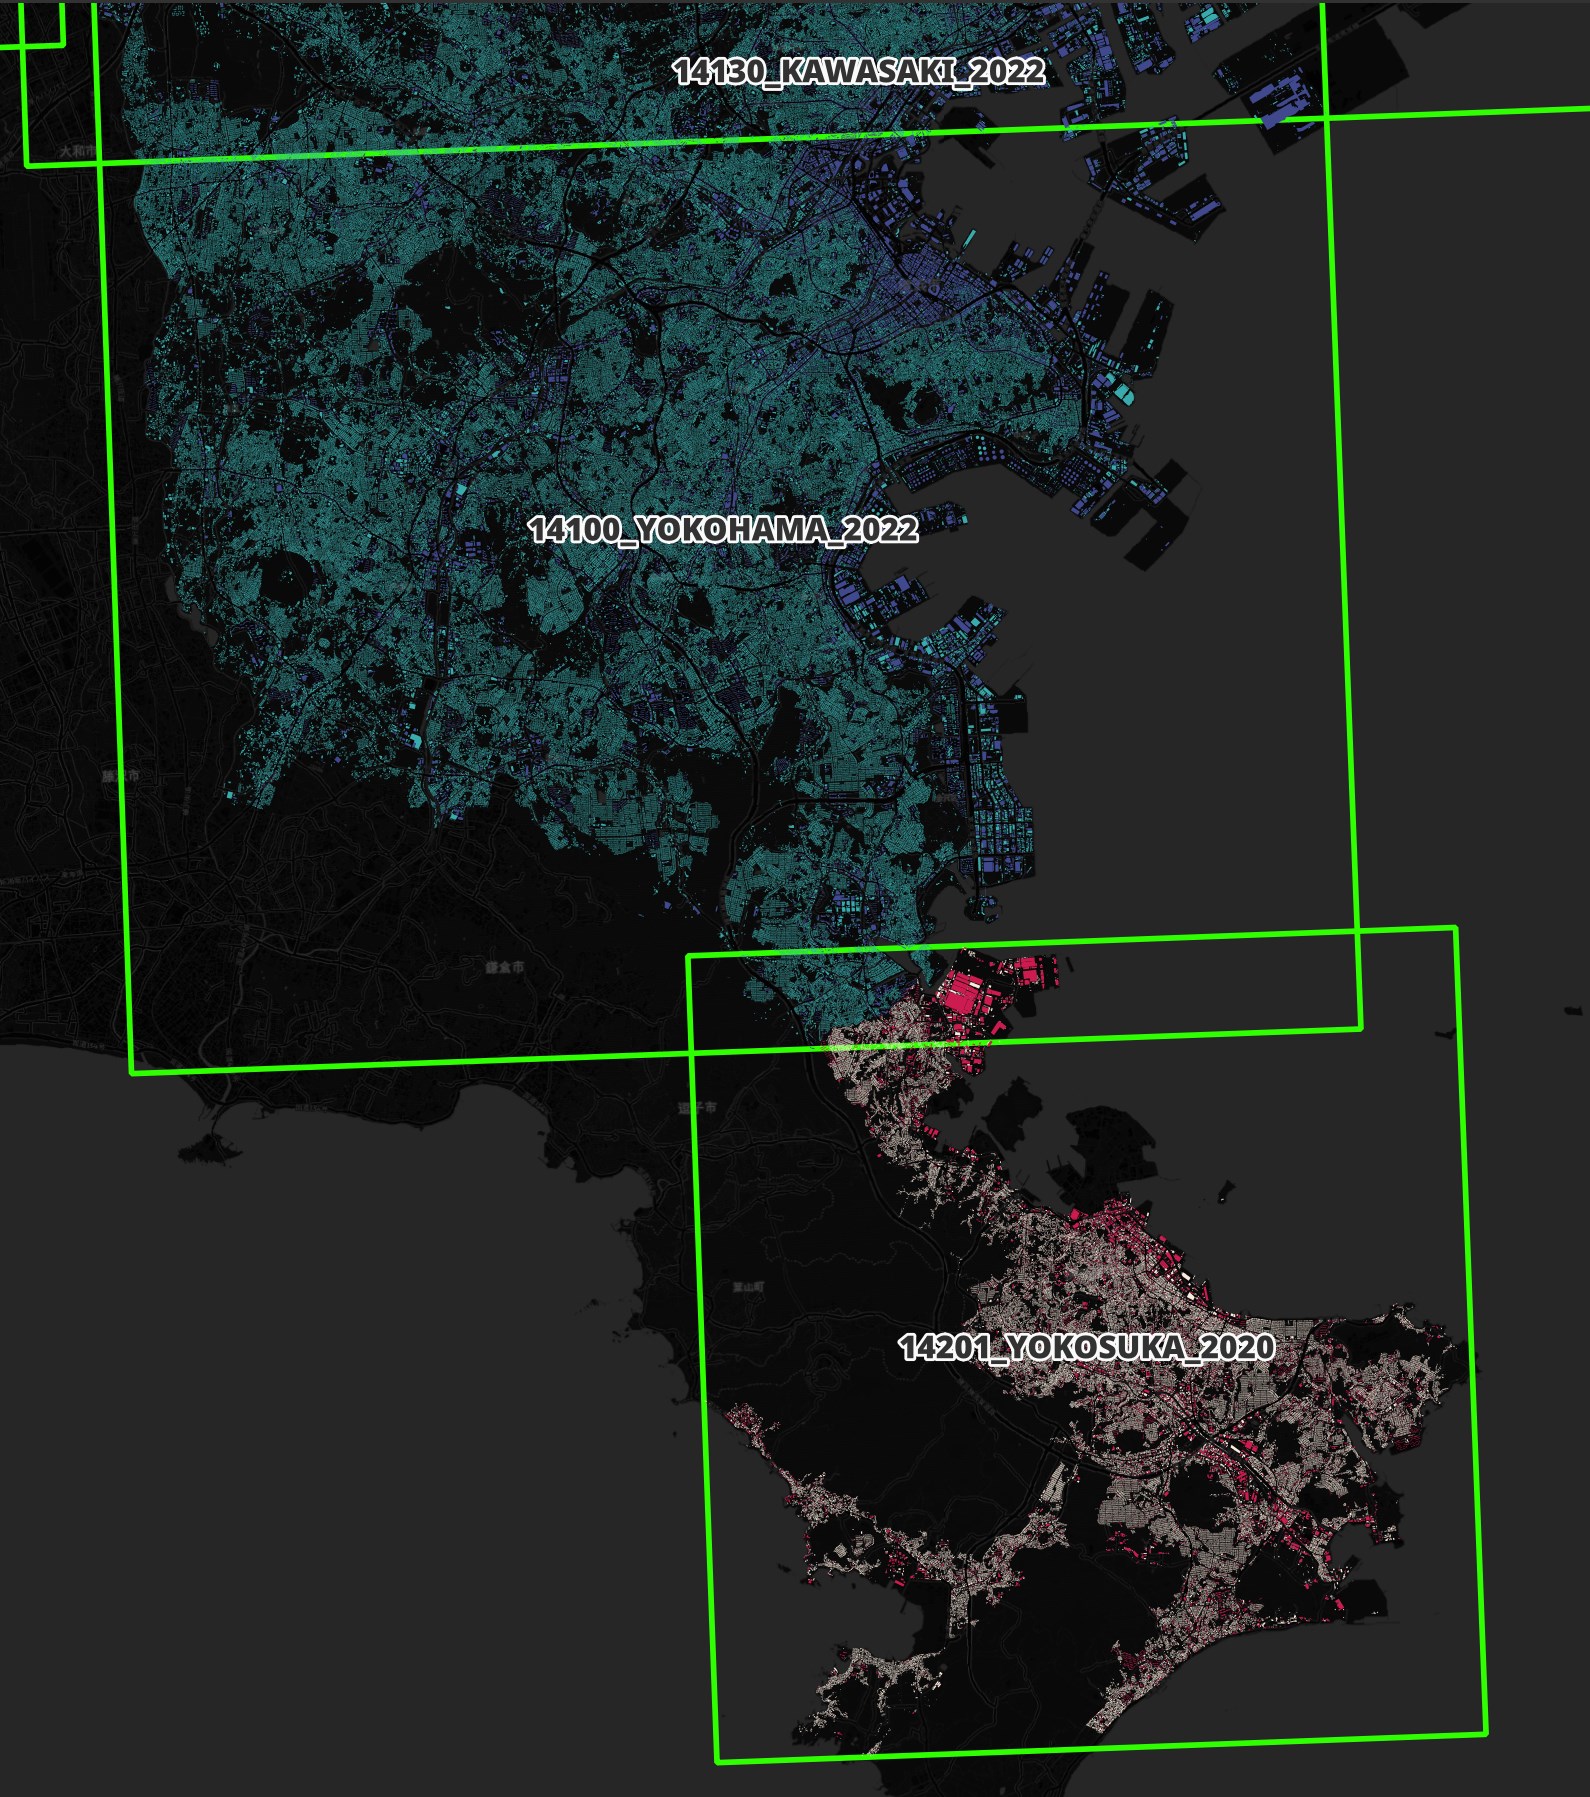
I did run a test where I looked at how many Parquet files intersected with a single point in Tokyo and I got back six files. I'm not sure if these files are meant to be refreshed datasets.
The last three might just happen to partially overlap the first three.
SELECT   year,
         filename
FROM     stats
WHERE    ST_CONTAINS(ST_FlipCoordinates(bbox::GEOMETRY),
                     ST_POINT(139.6411, 35.6800))
AND      subject = 'lod0'
ORDER BY 1, 2;
┌───────┬───────────────────────────────────────────────────────────────────────────────────────────────┐
│ year │ filename │
│ int64 │ varchar[] │
├───────┼───────────────────────────────────────────────────────────────────────────────────────────────┤
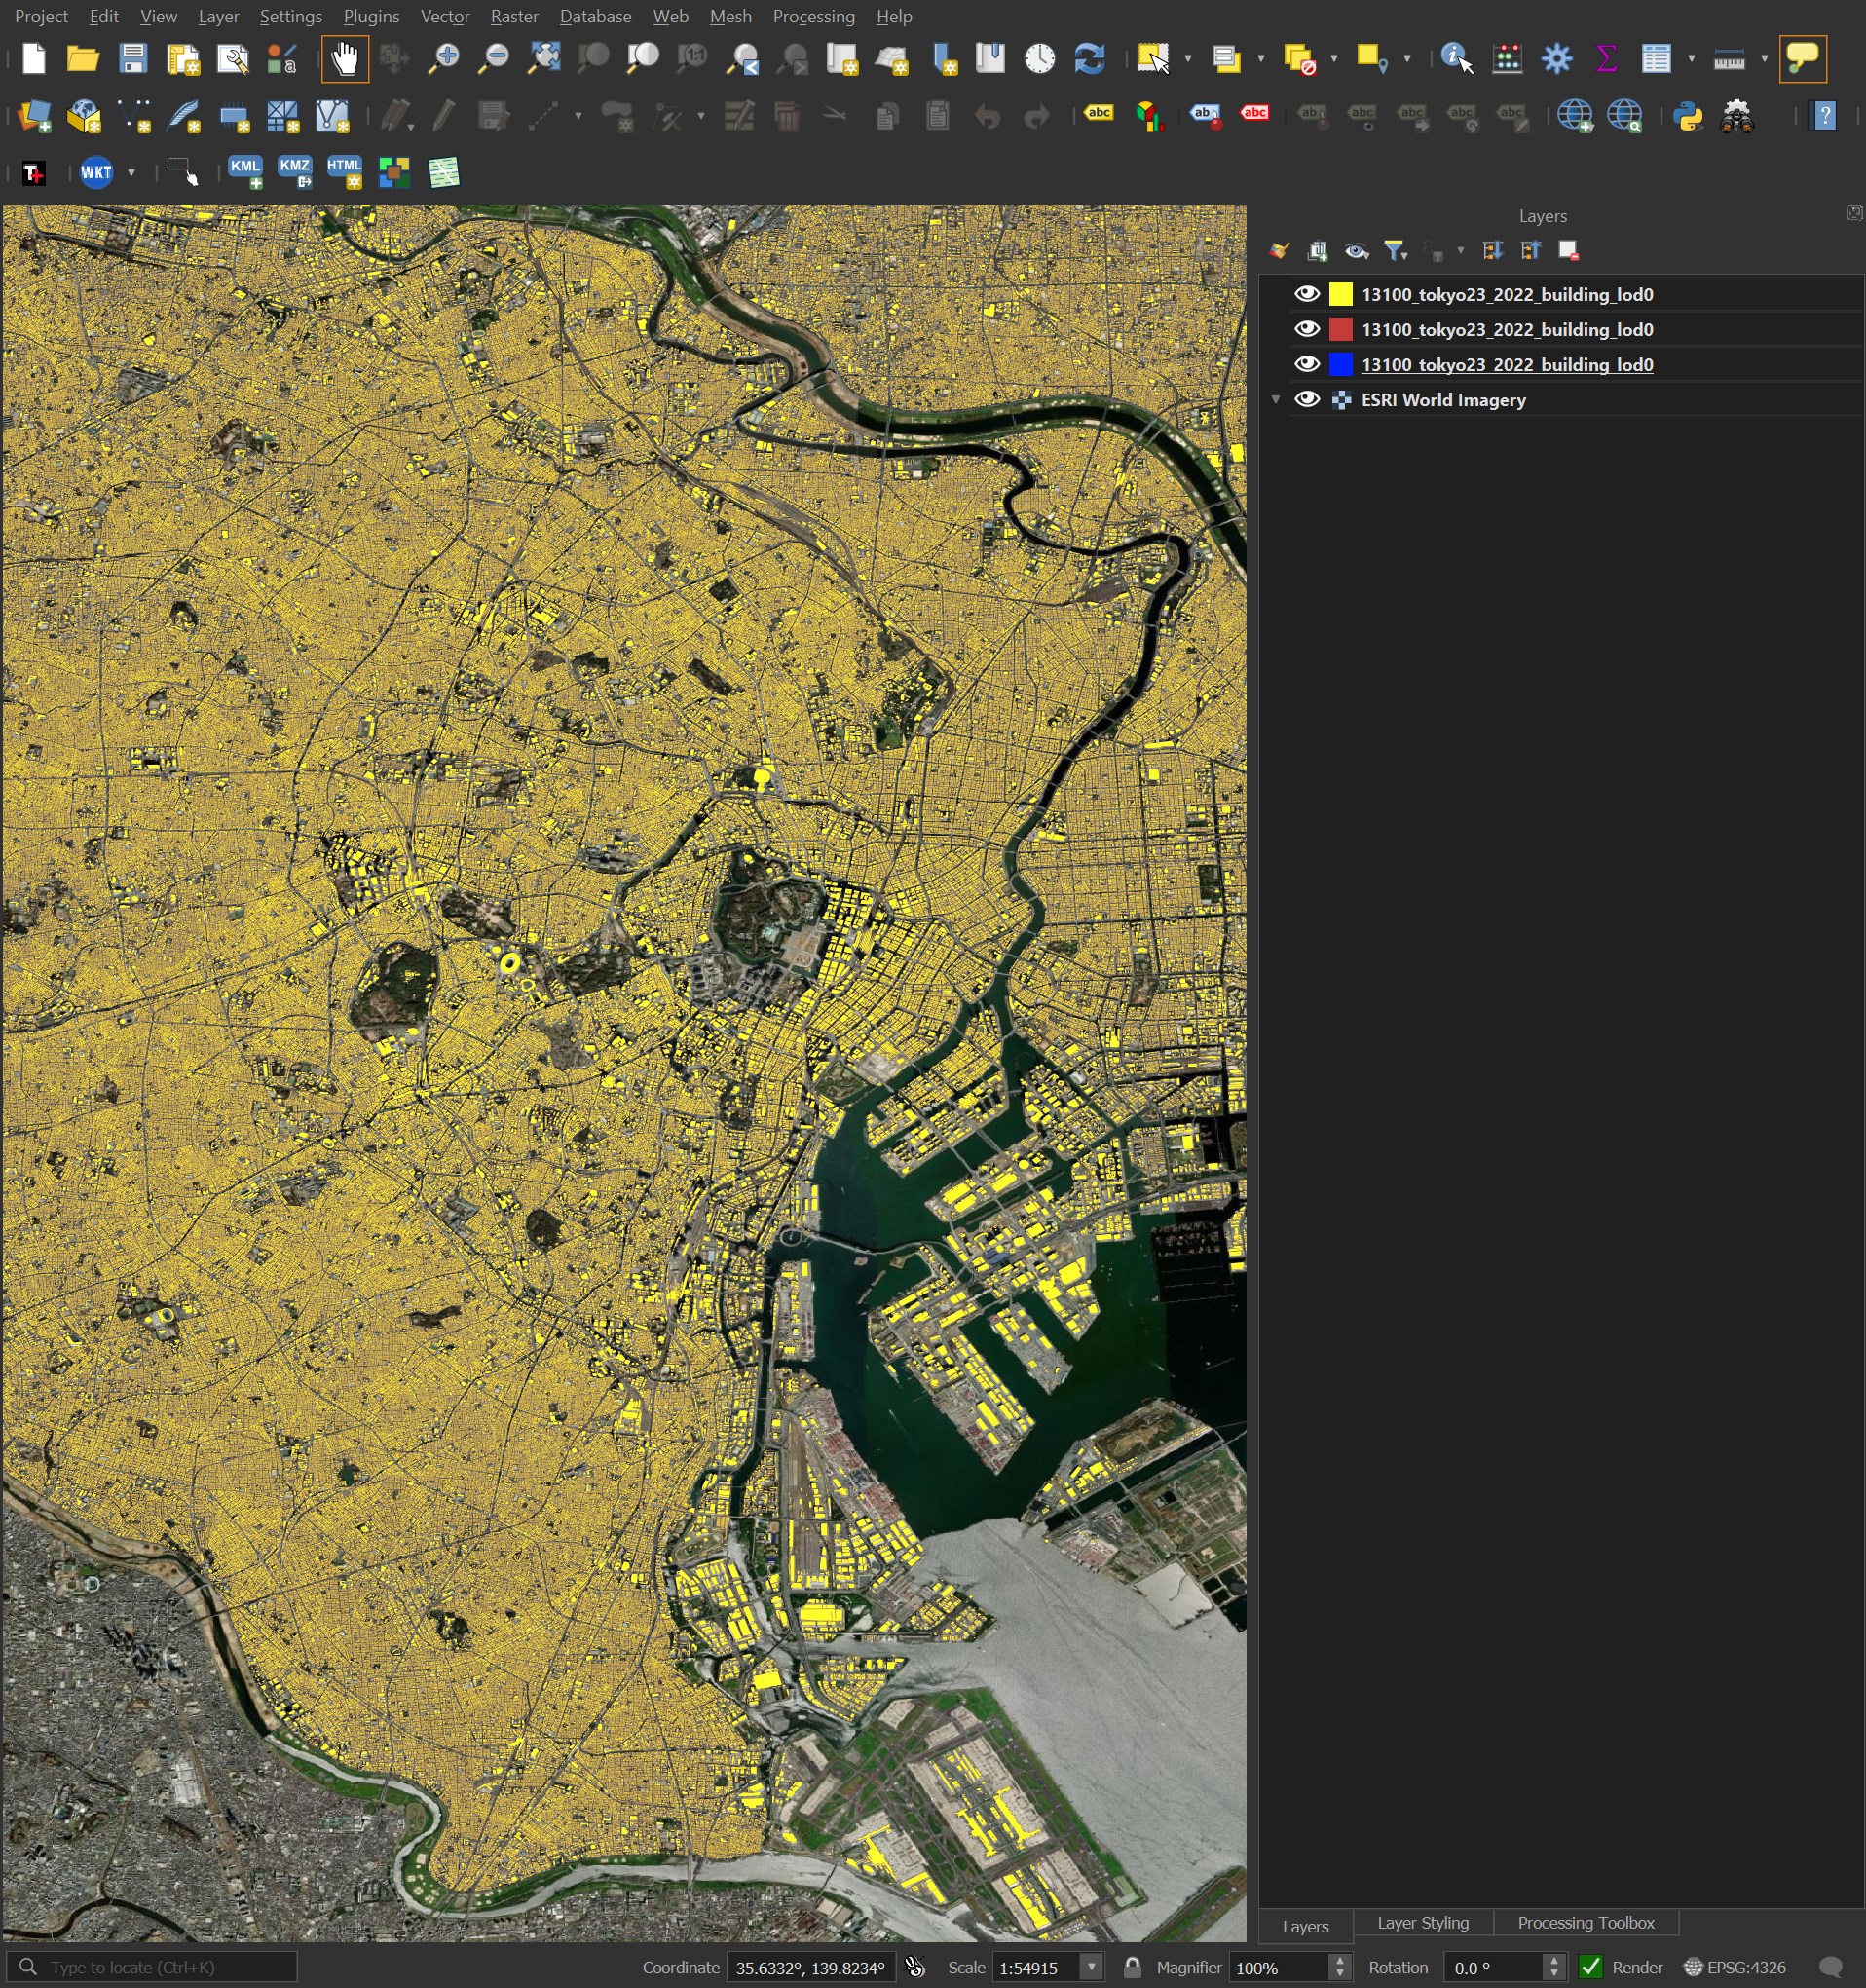
│ 2022 │ [flateau/2022/buildings/gpqt/13100_tokyo23_2022_building_lod0.parquet] │
│ 2022 │ [flateau/2022/buildings202312/gpqt/13100_tokyo23_2022_building_lod0.parquet] │
│ 2022 │ [flateau/tokyo23/2022/buildings/20231217/geoparquet/13100_tokyo23_2022_building_lod0.parquet] │
│ 2023 │ [flateau/2023/parquet/13112_setagaya-ku_2023_building_lod0.parquet] │
│ 2023 │ [flateau/2023/parquet/13114_nakano-ku_2023_building_lod0.parquet] │
│ 2023 │ [flateau/2023/parquet/13115_suginami-ku_2023_building_lod0.parquet] │
└───────┴───────────────────────────────────────────────────────────────────────────────────────────────┘
When I load the first three Parquet files into QGIS, their geometry appears to be completely identical. Two of these three files use "exterior" for the geometry field name while the other one uses "geom".
Schema Variations
Looking across all subjects, most have at least 3 schema variations.
SELECT   subject,
         COUNT(DISTINCT column_name) num_schemas
FROM     stats
GROUP BY 1
ORDER BY 1;
┌─────────────────────────┬─────────────┐
│         subject         │ num_schemas │
│         varchar         │    int64    │
├─────────────────────────┼─────────────┤
│ centroid                │           1 │
│ centroid lod0           │           3 │
│ data quality            │           4 │
│ detail                  │           4 │
│ extended attributes     │          23 │
│ generic attributes      │          28 │
│ large customer facility │           3 │
│ lod0                    │           3 │
│ polygon                 │           1 │
│ risk flooding           │           4 │
│ risk high tide          │           3 │
│ risk internal overflow  │           3 │
│ risk land slide         │           4 │
│ risk tsunami            │           3 │
├─────────────────────────┴─────────────┤
│ 14 rows                     2 columns │
└───────────────────────────────────────┘
Building Footprints
The following is an example "lod0" record. These contain building footprint polygons.
$ function first_record () {
      echo "SELECT * EXCLUDE($1),
                     ST_GEOMFROMWKB($1) $1
            FROM   READ_PARQUET('$2')
            LIMIT  1" \
          | ~/duckdb -json \
          | grep '\[' \
          | jq -S .
  }

$ first_record \
    GEOM \
    flateau/2023/parquet/13115_suginami-ku_2023_building_lod0.parquet
[
  {
    "GEOM": "POLYGON ((139.63703765450623 35.66611166159665, 139.63705386036838 35.666169556119975, 139.6369525256863 35.666188319724284, 139.63693599161584 35.666129162730975, 139.63696538619118 35.66612380243425, 139.63696429090044 35.66612001488412, 139.6370045154662 35.66611250894425, 139.63700593903752 35.666117558950596, 139.63703765450623 35.66611166159665))",
    "address": "東京都杉並区下高井戸一丁目",
    "branch_id": null,
    "building_id": "13115-bldg-6088",
    "cal_area_m2": 64.48399423239218,
    "cal_height_m": 7.453775405800002,
    "cal_xmax": 139.63705386036838,
    "cal_xmin": 139.63693599161584,
    "cal_ymax": 35.666188319724284,
    "cal_ymin": 35.66611166159665,
    "cal_zmax_m": 53.973775863600004,
    "cal_zmin_m": 46.5200004578,
    "city": "東京都杉並区",
    "city_code": "13115",
    "class": "普通建物",
    "class_code": "3001",
    "creation_date": "2024-03-15",
    "gml_description": null,
    "gml_id": "bldg_045cea9d-814d-4055-9e11-e3dedb188218",
    "gml_name": null,
    "matching_score": null,
    "measured_height": 8.8,
    "measured_height_uom": "m",
    "number_of_building_unit_ownership": null,
    "number_of_real_estate_id_of_land": null,
    "prefecture": "東京都",
    "prefecture_code": "13",
    "real_estate_id_of_building": null,
    "real_estate_id_of_building_unit_ownership": null,
    "real_estate_id_of_land": null,
    "roof_type": null,
    "roof_type_code": null,
    "source_filename": "53393590_bldg_6697_op.gml",
    "storeys_above_ground": 3,
    "storeys_below_ground": 0,
    "termination_date": null,
    "usage": "住宅",
    "usage_code": "411",
    "year_of_construction": null,
    "year_of_demolition": null
  }
]
The metadata within these files is very rich, albeit in Japanese. Below are the classes of buildings within the above Parquet file.
$ ~/duckdb
SELECT   COUNT(*),
         class
FROM     READ_PARQUET('flateau/2023/parquet/13115_suginami-ku_2023_building_lod0.parquet')
WHERE    LENGTH(class)
GROUP BY 2
ORDER BY 1 DESC
LIMIT    20;
┌──────────────┬──────────────┐
│ count_star() │    class     │
│    int64     │   varchar    │
├──────────────┼──────────────┤
│       121885 │ 普通建物     │
│        13423 │ 堅ろう建物   │
│         6503 │ 普通無壁舎   │
│           11 │ 堅ろう無壁舎 │
└──────────────┴──────────────┘
These are the English language translations of the above classes.
Normal building
Solid building
Ordinary wall-less building
Robust wall building
Below are the top building uses in the above Parquet file.
SELECT   COUNT(*),
         usage
FROM     READ_PARQUET('flateau/2023/parquet/13115_suginami-ku_2023_building_lod0.parquet')
WHERE    LENGTH(usage)
GROUP BY 2
ORDER BY 1 DESC
LIMIT    20;
┌──────────────┬────────────────┐
│ count_star() │     usage      │
│    int64     │    varchar     │
├──────────────┼────────────────┤
│        76057 │ 住宅           │
│        23520 │ 共同住宅       │
│         5917 │ 店舗等併用住宅 │
│         1455 │ 文教厚生施設   │
│         1013 │ 業務施設       │
│          752 │ 商業施設       │
│          352 │ 作業所併用住宅 │
│          303 │ 運輸倉庫施設   │
│          152 │ 官公庁施設     │
│          105 │ 工場           │
│           81 │ 供給処理施設   │
│           43 │ その他         │
│           16 │ 宿泊施設       │
│           15 │ 農林漁業用施設 │
├──────────────┴────────────────┤
│ 14 rows             2 columns │
└───────────────────────────────┘
These are the English language translations of the above usage descriptions.
Housing
Communal housing
Housing used for stores etc.
Educational welfare facility
Business facilities
Commercial facility
Housing combined with workshop
Transportation warehouse facility
Government facilities
Factory
Supply processing facility
Other
Accommodation
Agriculture, forestry and fishery facilities
Risk Datasets
There are five risk datasets within Flateau. The following is an example flood risk record.
$ first_record \
        GEOM \
        flateau/2022/buildings/gpqt/01205_muroran_2022_building_risk_flooding.parquet
[
  {
    "GEOM": null,
    "admin_type": "2",
    "admin_type_code": "2",
    "branch_id": null,
    "building_id": "01205-bldg-15295",
    "depth": "0.036000000000000004",
    "depth_uom": "m",
    "description": "1",
    "description_code": "1",
    "duration": null,
    "duration_uom": null,
    "gml_id": "bldg_660dca28-cee8-11ed-81ca-088e90e0d0d1",
    "part_id": null,
    "rank": "1",
    "rank_code": "1",
    "rank_org": null,
    "rank_org_code": null,
    "scale": "2",
    "scale_code": "2",
    "source_filename": "63404729_bldg_6697_op.gml"
  }
]
I'll sample 2,000 building records from the above area and join them with their flood risk record. I'll then take the highest value from each H3 hexagon partition.
$ ~/duckdb flateau.duckdb
CREATE OR REPLACE TABLE buildings AS
    SELECT * EXCLUDE(GEOM),
           ST_GEOMFROMWKB(GEOM) geom
    FROM   READ_PARQUET('flateau/tokyo23/2022/buildings/tokyo23_2022_buildings_centroid.parquet')
    USING SAMPLE 2000;

CREATE OR REPLACE TABLE flood_risk AS
    FROM READ_PARQUET('flateau/tokyo23/2022/buildings/tokyo23_2022_buildings_risk_flooding.parquet');

CREATE OR REPLACE TABLE building_flood_risk AS
    SELECT *
    FROM   buildings b
    JOIN   flood_risk r ON b.gml_id = r.gml_id;

COPY (
    SELECT   H3_CELL_TO_BOUNDARY_WKT(
                 H3_LATLNG_TO_CELL(
                     ST_Y(geom),
                     ST_X(geom),
                     7))::GEOMETRY geom,
             MAX(rank_code)        rank,
             MAX(depth)            depth,
             MAX(description_code) duration
    FROM     building_flood_risk
    GROUP BY 1
) TO 'building_flood_risk.h3.gpkg'
    WITH (FORMAT GDAL,
          DRIVER 'GPKG',
          LAYER_CREATION_OPTIONS 'WRITE_BBOX=YES');
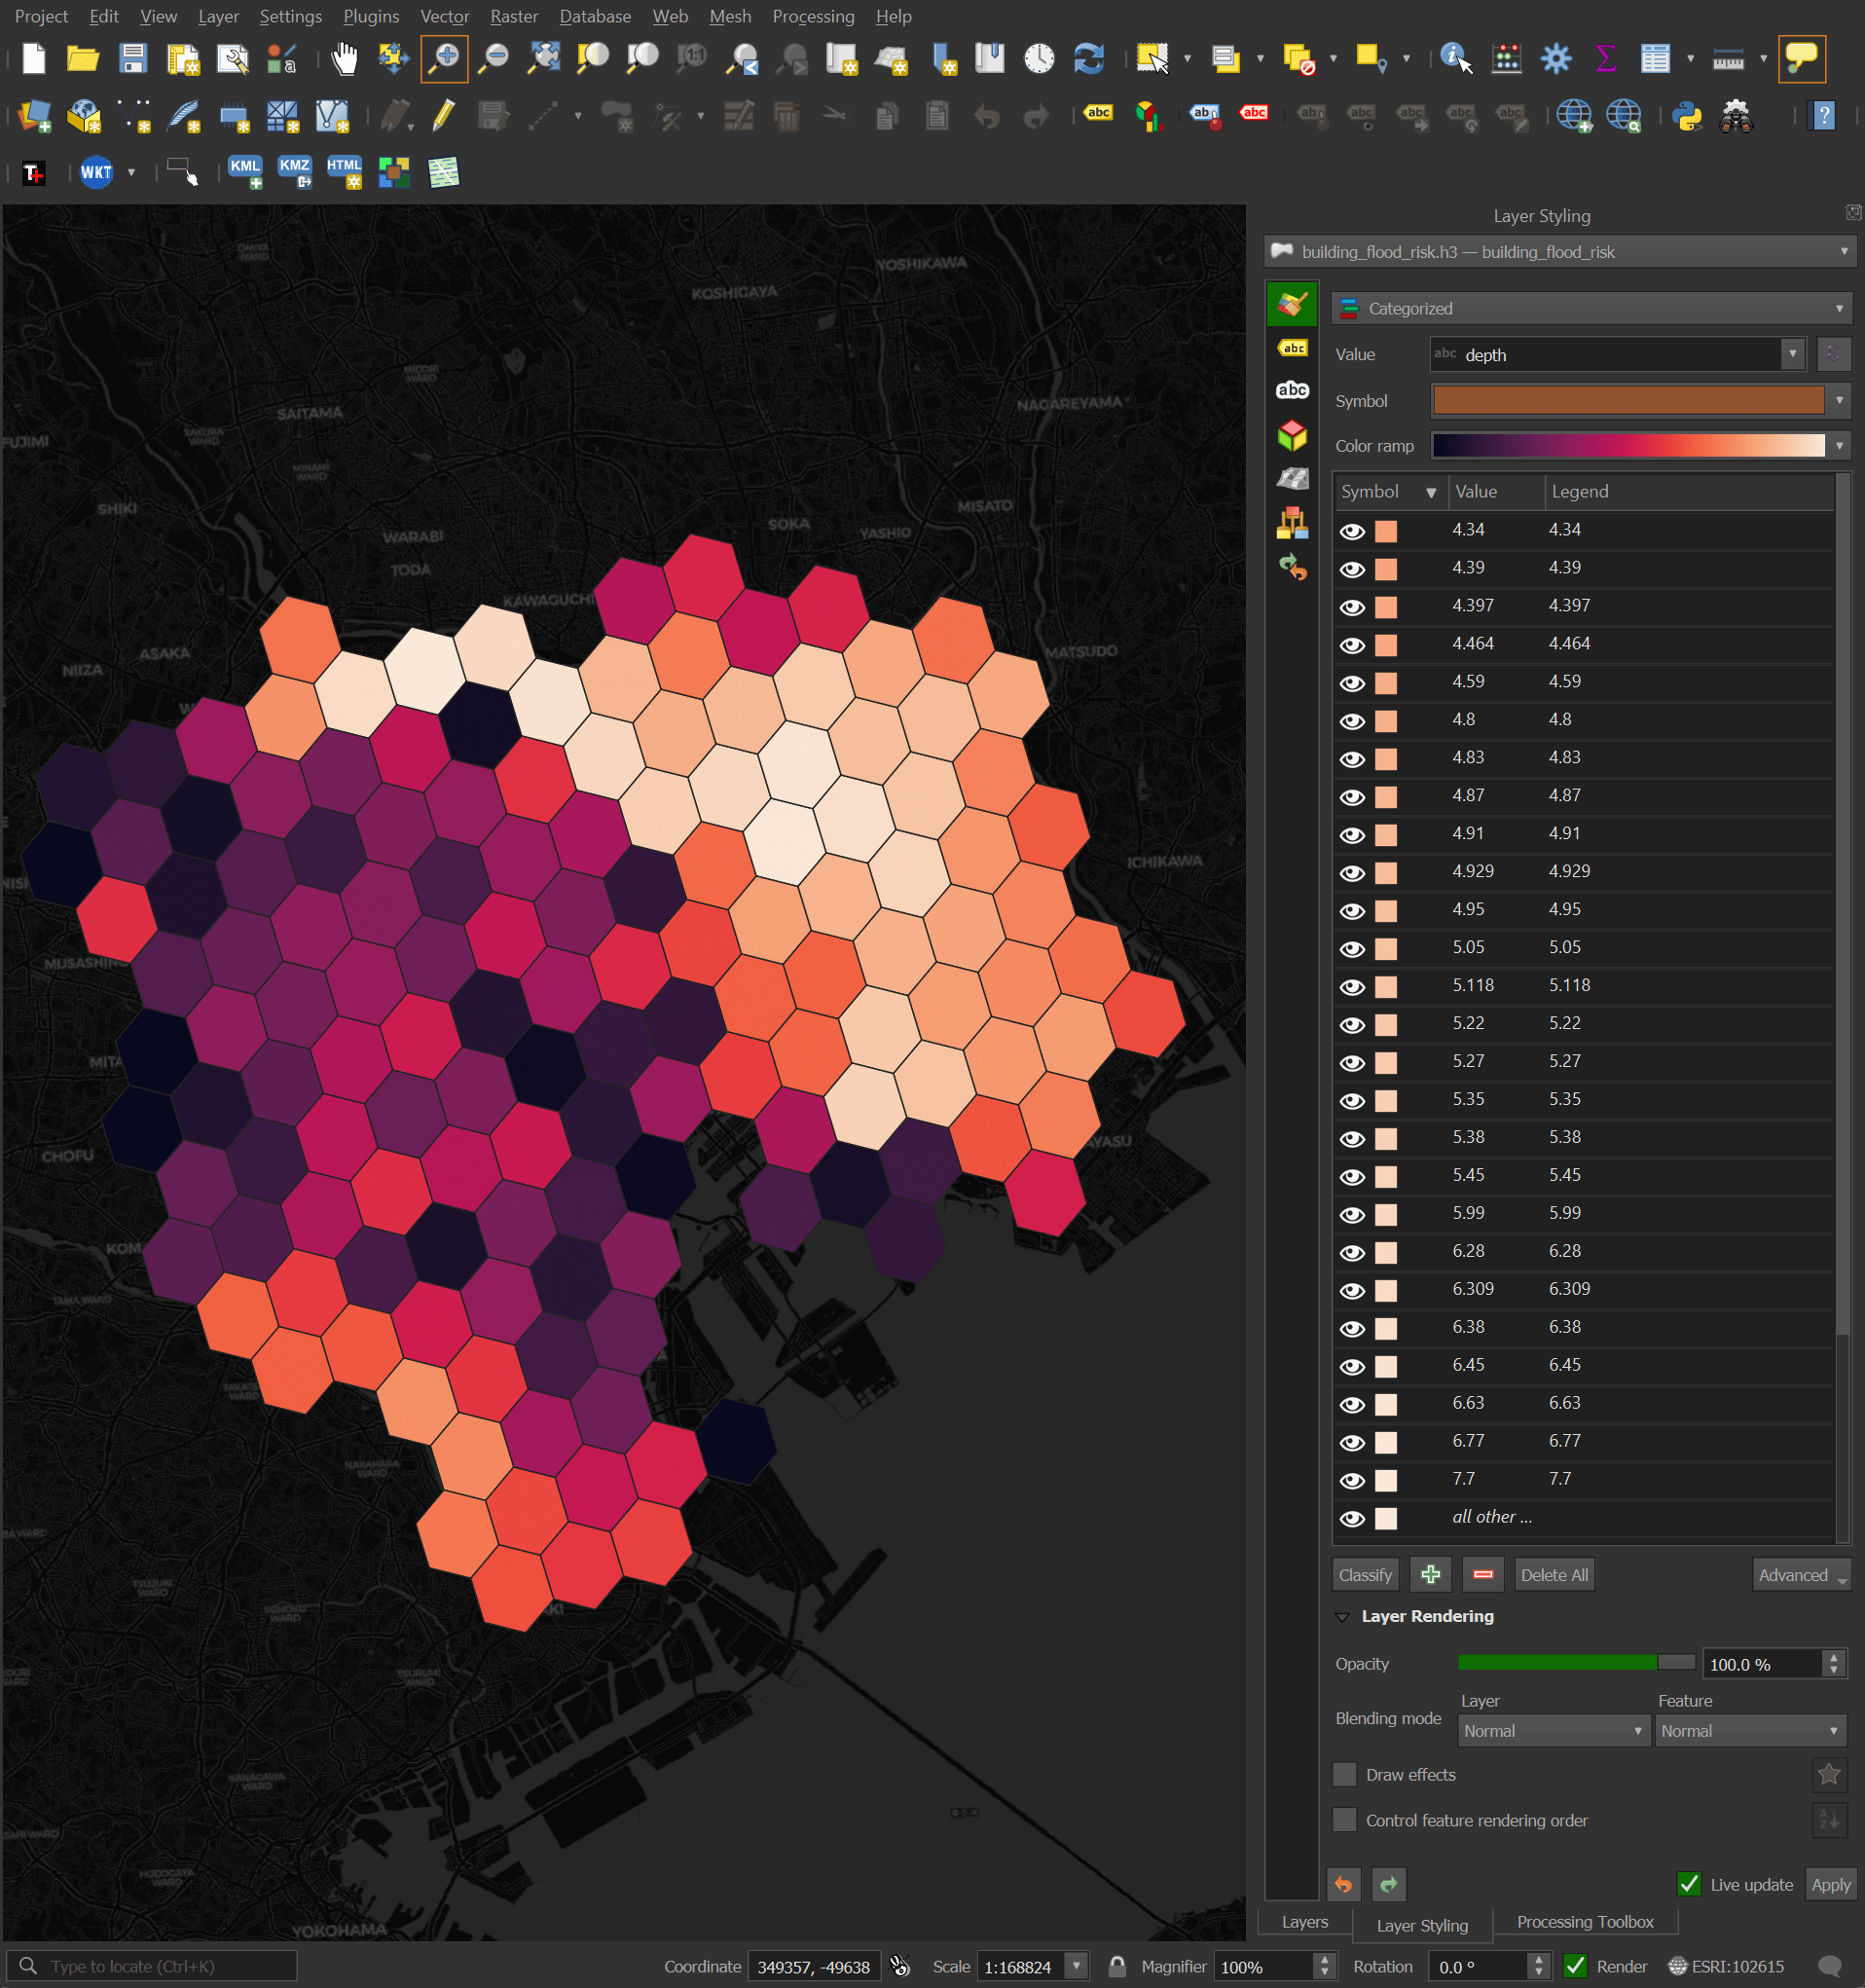
Below are the flooding depth risk levels within central Tokyo. The brightest hexagons have a maximum depth risk of 7.7 meters.
This is an example high-tide risk record.
$ first_record \
        GEOM \
        flateau/2022/buildings/gpqt/13100_tokyo23_2022_building_risk_high_tide.parquet
[
  {
    "GEOM": null,
    "branch_id": null,
    "building_id": "13101-bldg-9339",
    "depth": "0.43",
    "depth_uom": "m",
    "description": "1",
    "description_code": "1",
    "gml_id": "bldg_d36d2972-098d-4be1-b595-7fe8cd79994b",
    "part_id": null,
    "rank": "1",
    "rank_code": "1",
    "rank_org": null,
    "rank_org_code": null,
    "source_filename": "53394539_bldg_6697_2_op.gml"
  }
]
This is an example internal overflow risk record.
$ first_record \
        GEOM \
        flateau/2022/buildings/gpqt/24202_yokkaichi_2022_building_risk_internal_overflow.parquet
[
  {
    "GEOM": null,
    "branch_id": null,
    "building_id": "24202-bldg-175892",
    "depth": "0.076",
    "depth_uom": "m",
    "description": "1",
    "description_code": "1",
    "gml_id": "bldg_7a69ff2f-a672-45e8-b743-b0323014ed46",
    "part_id": null,
    "rank": "1",
    "rank_code": "1",
    "rank_org": null,
    "rank_org_code": null,
    "source_filename": "52362487_bldg_6697_op.gml"
  }
]
This is an example land slide risk record.
$ first_record \
        GEOM \
        flateau/2022/buildings/gpqt/01205_muroran_2022_building_risk_land_slide.parquet
[
  {
    "GEOM": null,
    "area_type": "2",
    "area_type_code": "2",
    "branch_id": null,
    "building_id": "01205-bldg-29966",
    "description": "1",
    "description_code": "1",
    "gml_id": "bldg_16161e8e-cee9-11ed-8930-088e90e0d0d1",
    "part_id": null,
    "source_filename": "63403769_bldg_6697_op.gml"
  }
]
This is an example tsunami risk record.
$ first_record \
        GEOM \
        flateau/2022/buildings/gpqt/01205_muroran_2022_building_risk_tsunami.parquet
[
  {
    "GEOM": null,
    "branch_id": null,
    "building_id": "01205-bldg-53824",
    "depth": "3.67",
    "depth_uom": "m",
    "description": "1",
    "description_code": "1",
    "gml_id": "bldg_1bada0d1-cee9-11ed-bae2-088e90e0d0d1",
    "part_id": null,
    "rank": "3",
    "rank_code": "3",
    "rank_org": null,
    "rank_org_code": null,
    "source_filename": "63403767_bldg_6697_op.gml"
  }
]
Further Research
As I uncover more insights, I'll update this post with my findings.