Last week I completed Esri's Imagery in Action MOOC. This course focused on analysing and building predictive models using satellite, point cloud and drone imagery.
I covered Esri's background in my Spatial Data Science review a few weeks ago.
In this post, I'll walk over the material that was covered in this six week course.
Satellite Imagery
The first two weeks were spent locating areas of interest in imagery sourced from both the European Space Agency's Sentinel 2 satellite feed as well as NASA and the USGS' Landsat 9 feed.
The Landsat 8 and 9 satellites collect eleven different wavelength bands. These can be useful for detecting snow, rocks, volcanic eruptions, agricultural land usage and many other events and materials that would be difficult to measure from a regular RGB image alone.
Below you can see a scatter plot of Landsat's band #8 (Panchromatic) and #11 (Thermal Infrared Sensor 2) above a Volcano. Snow on the Volcano has been highlighted in blue.
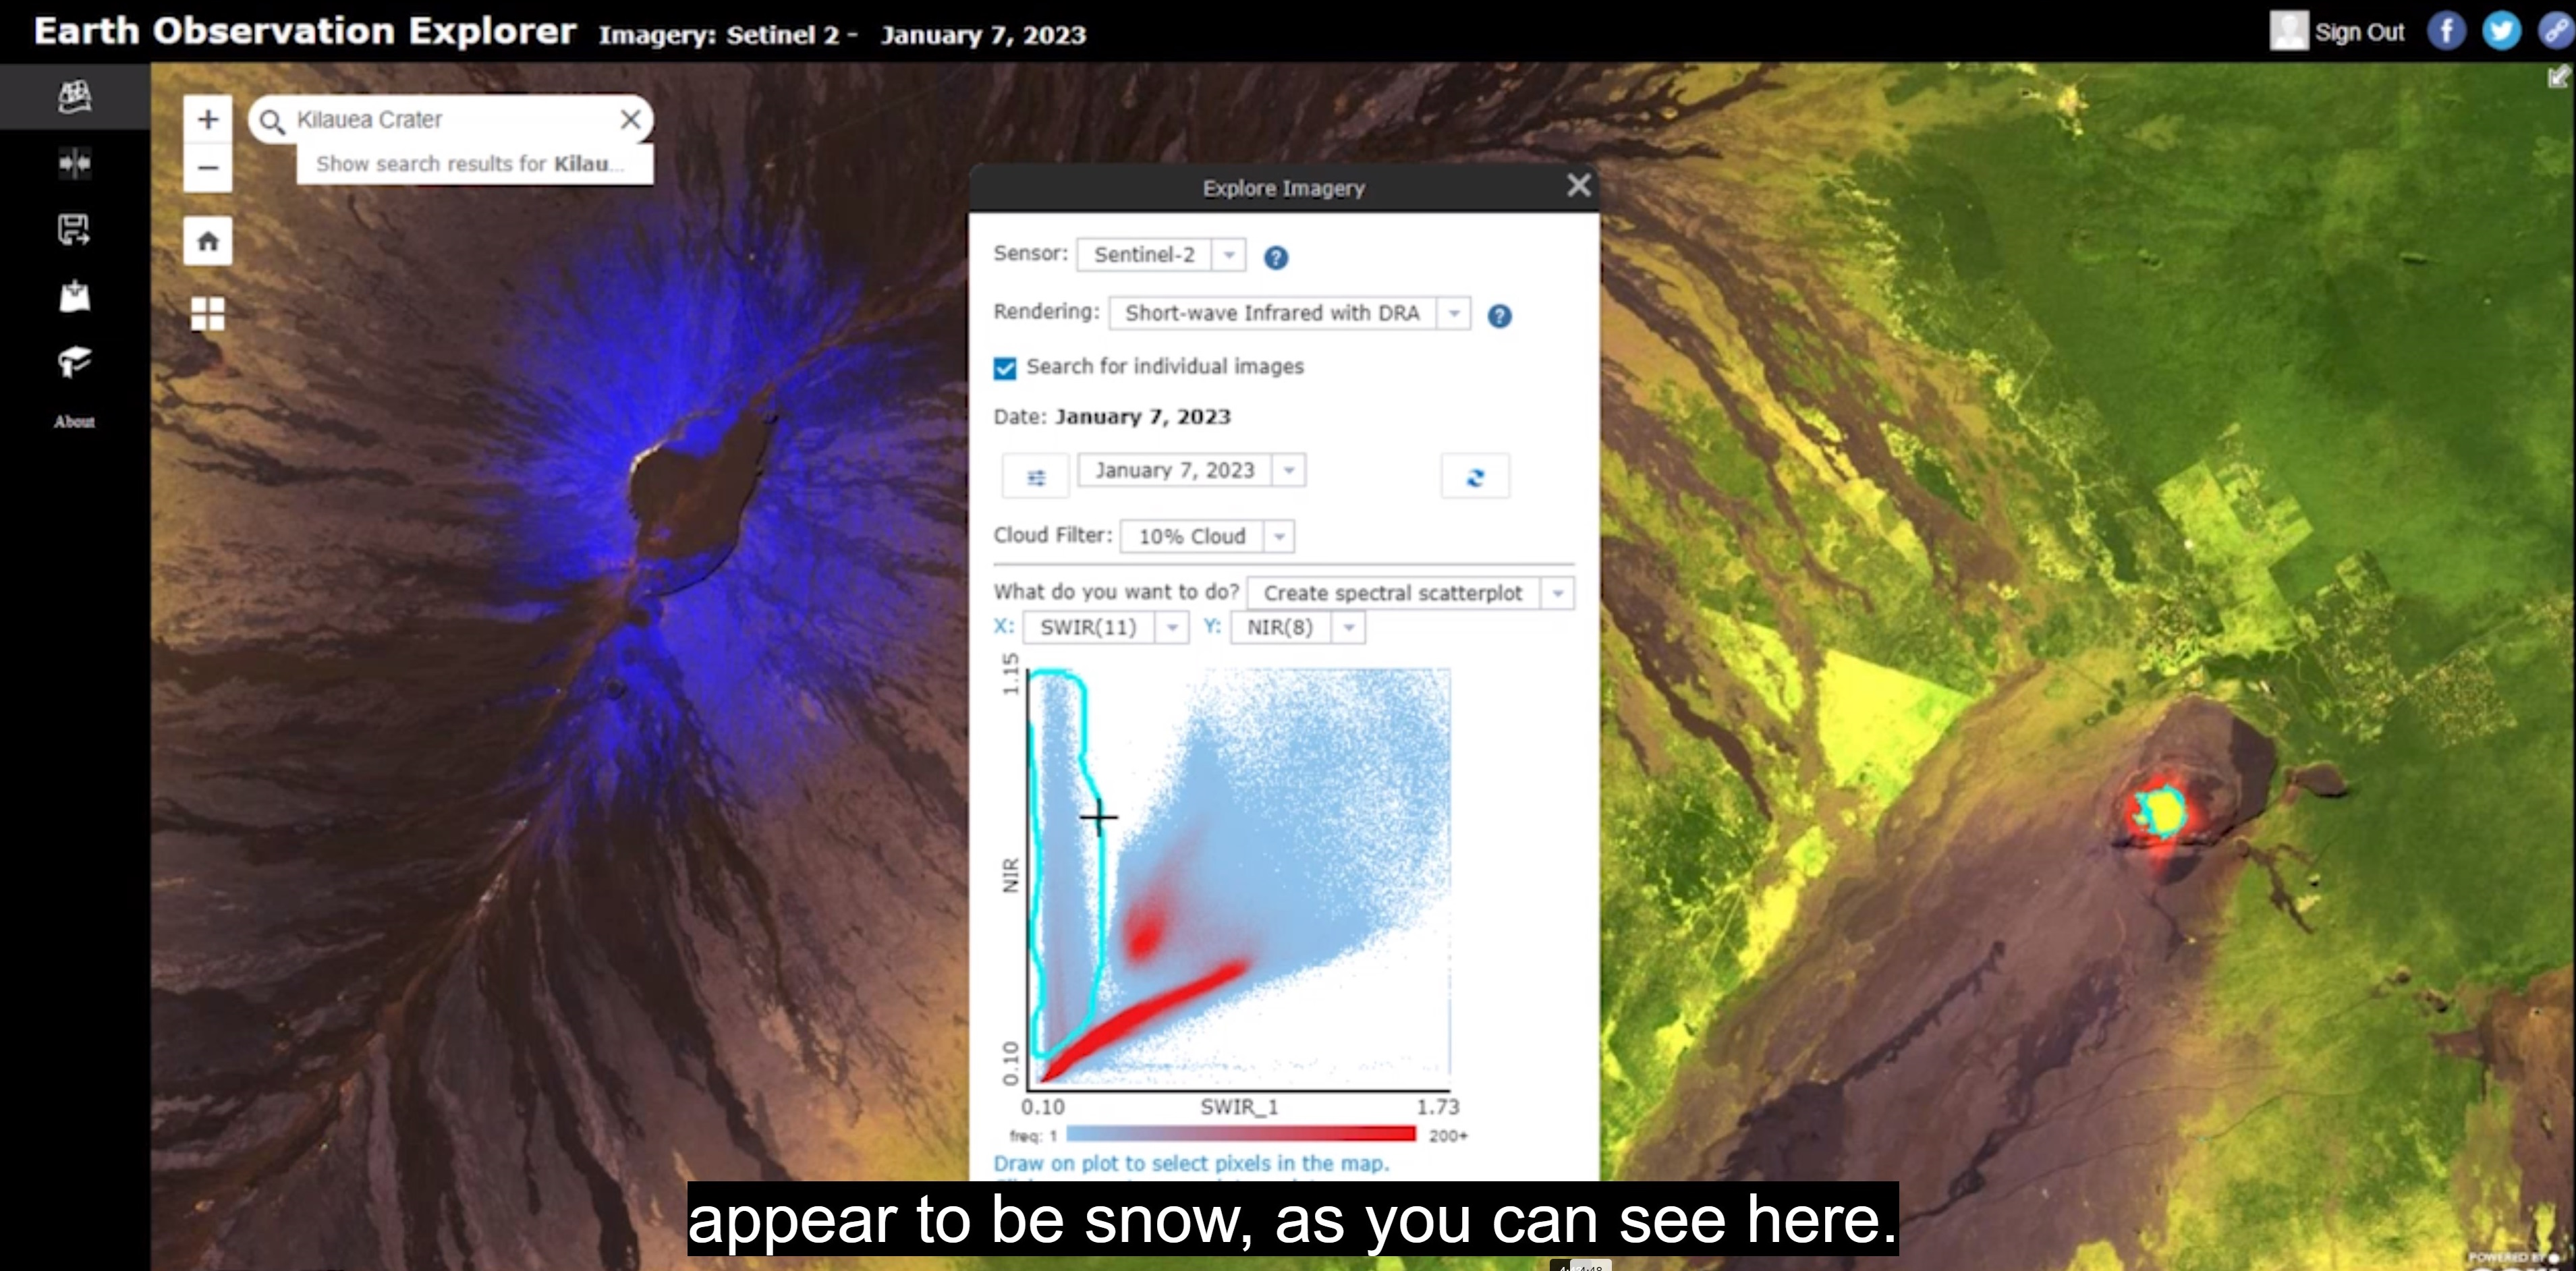
Esri has an online web app for exploring Landsat imagery where you can filter by date and amount of cloud cover and compare Landsat imagery, which has a resolution of 30cm2, against Sentinel 2 imagery, which has a resolution of 10cm2. You can also overlay rasters produced by deep learning models.


The Imagery extension of ArcGIS Pro does a good job of reminding users which Landsat band combinations pair best for various applications.

Point Clouds & Drones
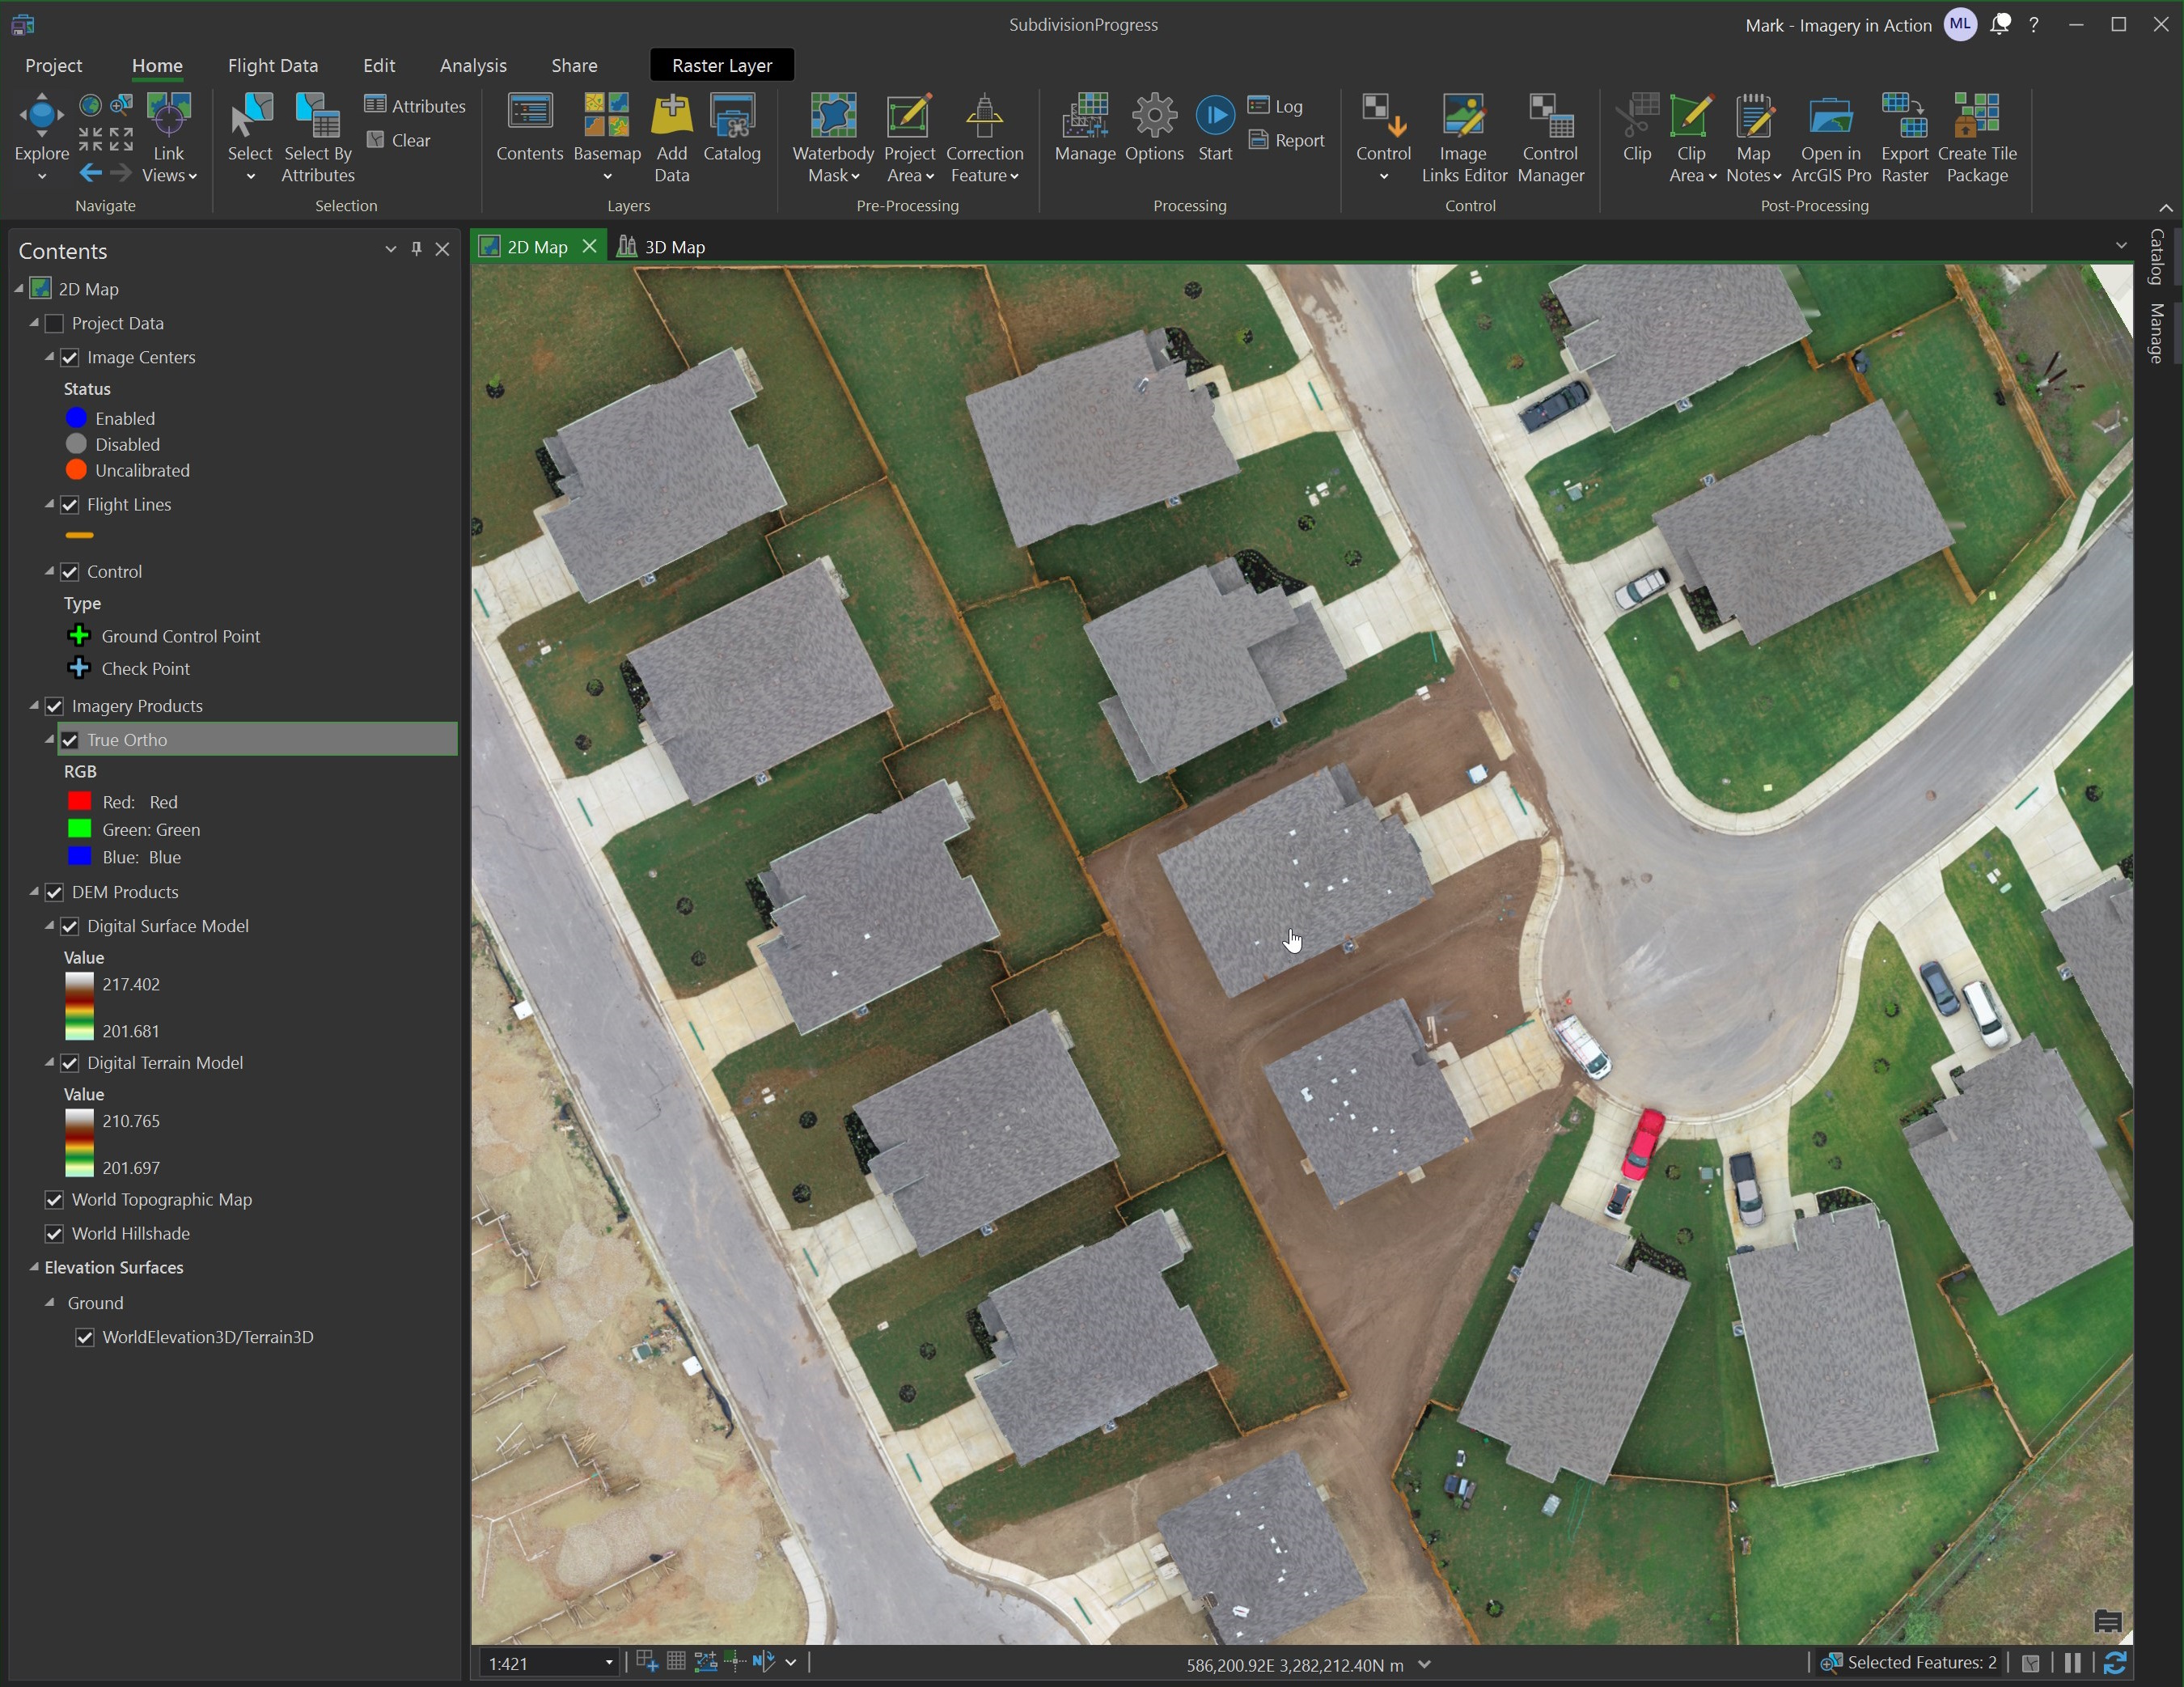
The third week focused on Esri's ArcGIS Drone2Map offering. There was a set of images a DJI Phantom 4 drone took above a neighbourhood looking straight down and then again at an angle. These images are combined into a 3D scene.
The process of combining these images can be computationally expensive but the software thankfully is GPU-accelerated.

High-resolution orthogonal height maps can be generated from drone imagery as well.

When Drone2Map finishes running, it produces an 11-page report. This can be very insightful for improving future missions.

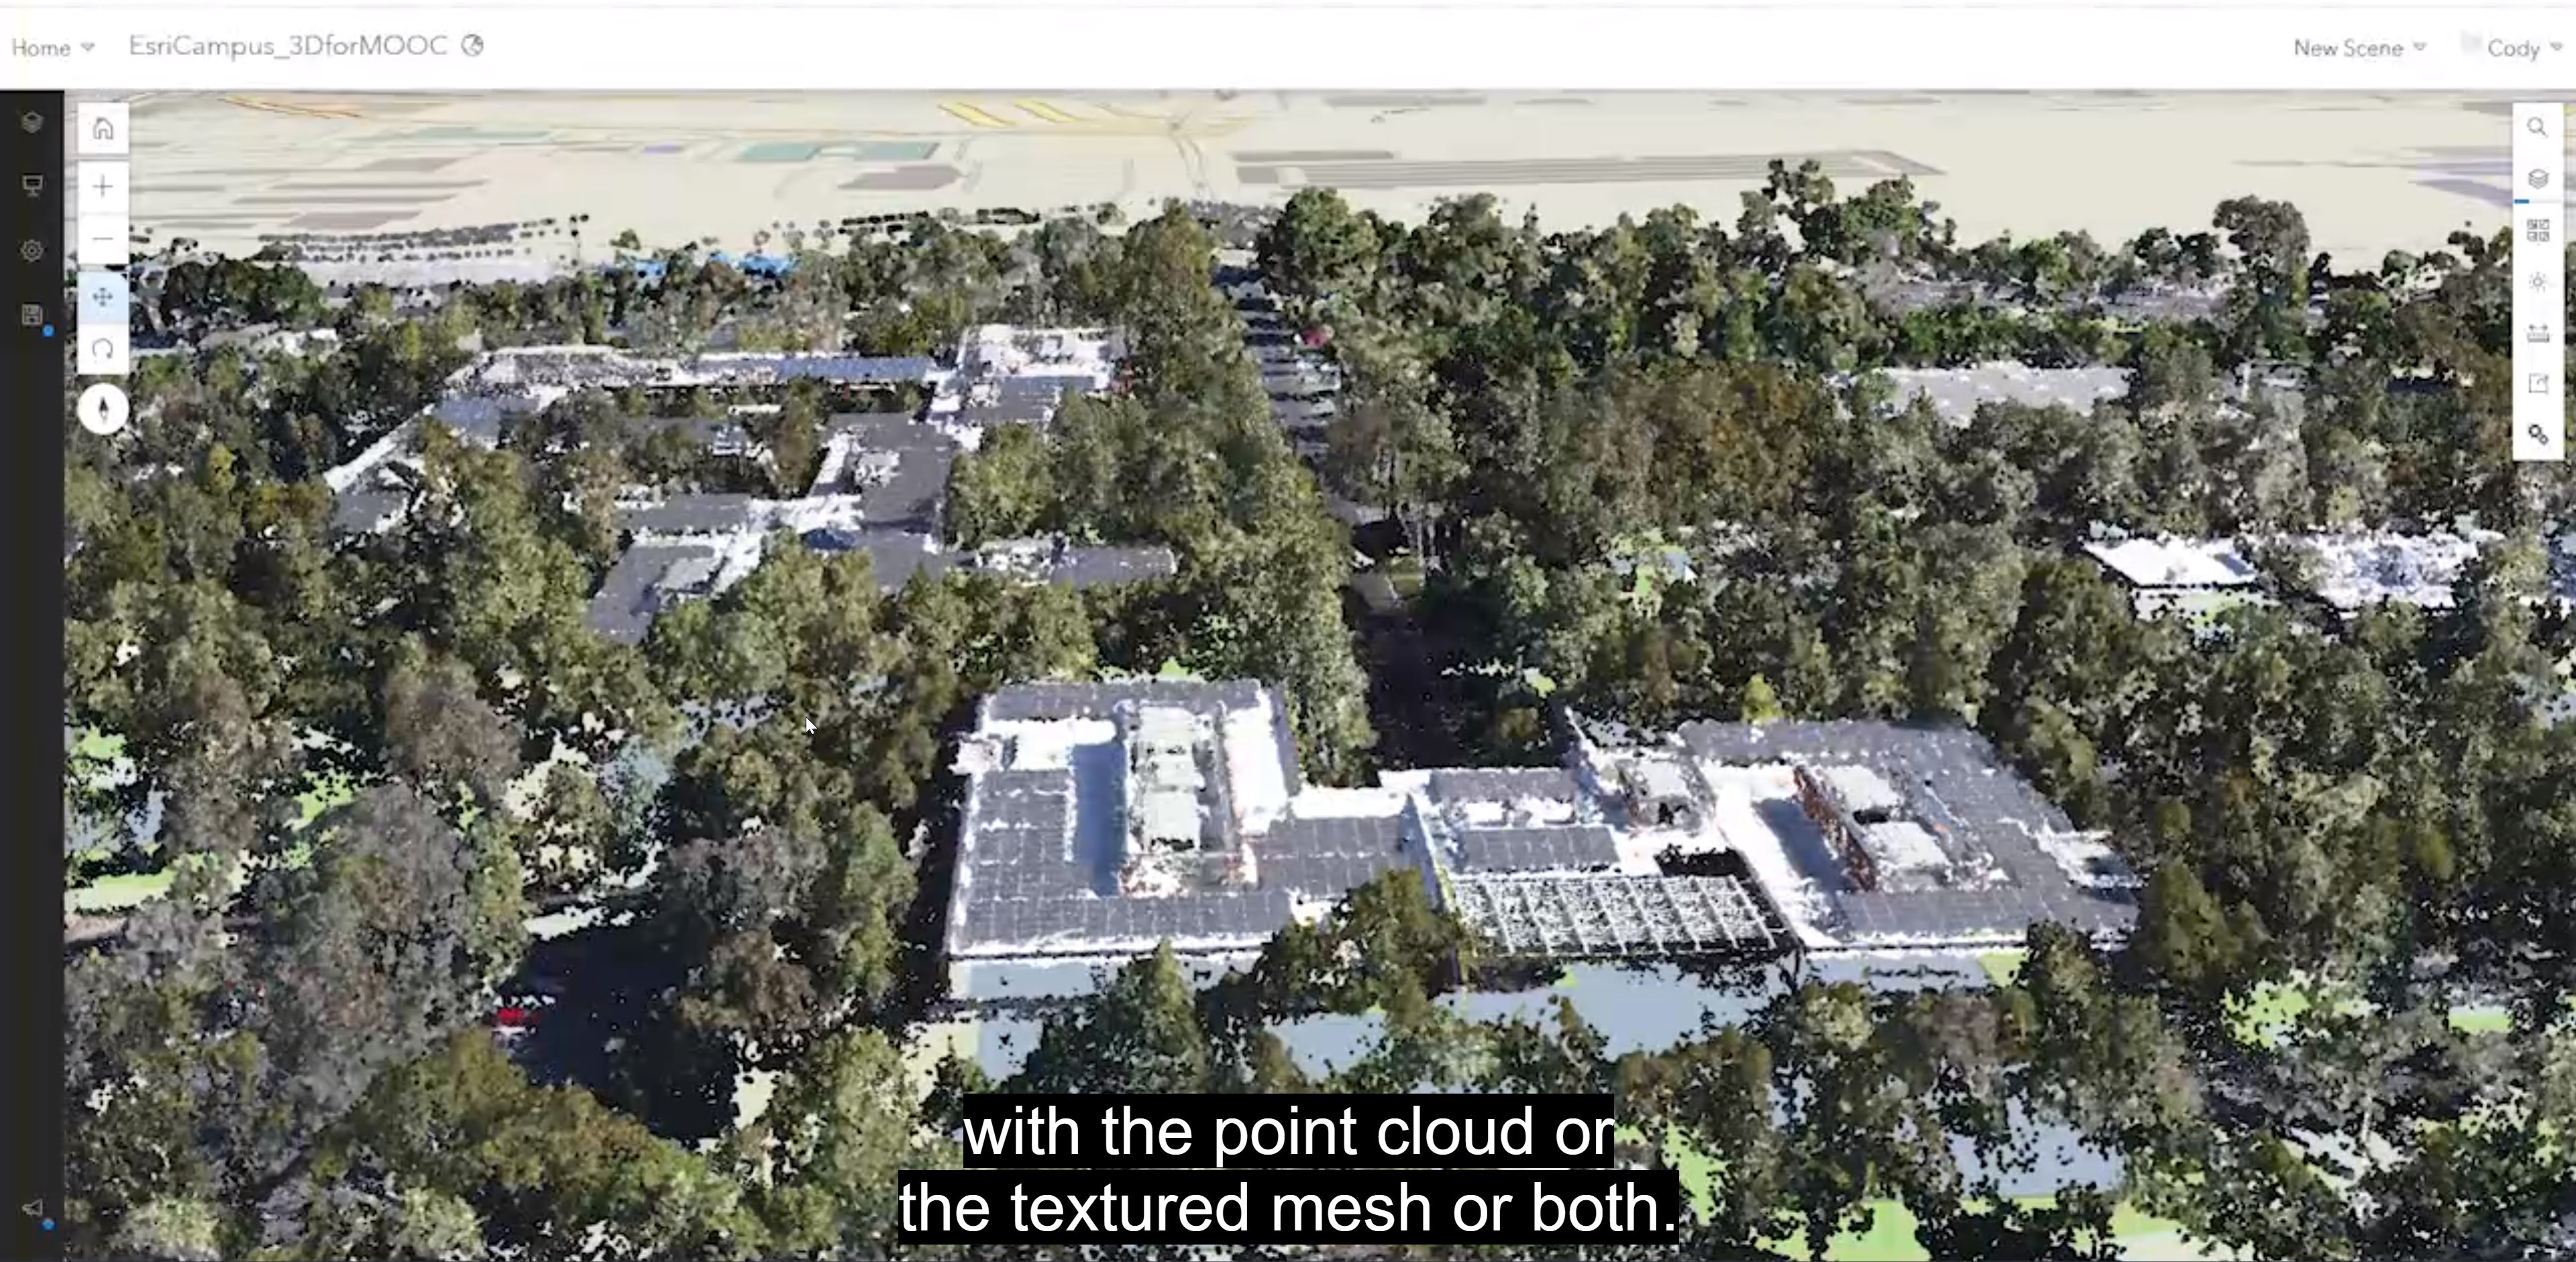
There was also a section discussing Point Clouds. Below you can see a 3D rendering of one of Esri's campuses in California.
Drones vs Satellites
One thing that struck me was how crisp and clear the drone imagery was. I looked at a satellite imagery provider's price list and for the price of a single overpass producing 30cm2 imagery of a 30KM2 area, that potentially could be obstructed by clouds, you could buy a medium to high-end drone and collect much more detailed imagery. Even if you only wanted to cover a 5KM2 area, after six flights, you're still coming out ahead.
Below you can see in the DJI-sourced drone imagery, which can be viewed in 3D as well, not only are the cars clearly visible but the rubbish and debris from the building sites on the left are as well.
To compare, this is a 50cm2-resolution satellite image Planet Labs took of a parking lot in Atlanta for Bellingcat.

This is a 30cm2-resolution image taken by Maxar on the island of Maui. I discuss how to download their open data feed in my Segmenting Satellite Images post.

Both satellite images above could still be invaluable and deep learning models could still use them to produce the results you're looking for but in terms of clarity and cost, it'll be hard to beat using an off-the-shelf drone.
To add to that, I've also seen LiDAR cameras attached to drones which can go a long way to classifying what material they're scanning (water, stone, trees, etc..) so the multiple bands of satellite imagery have competition in this area as well.
That being said, there are cases where the area you want to survey is too large to either justify the labour costs of flying a drone, which you might potentially want to do repeatedly over a long time period, or the area is inaccessible or not fully available for flight clearance. In these situations, I can see satellite imagery being the best source. But outside of these circumstances, drone imagery looks very competitive.
Measuring Change
The fourth week focused on measuring change over time and predicting future changes. Below shows how much Lake Powell, which sits on the border between Utah and Arizona, has receded over the past 20 years. This was produced from Normalized Difference Water Index (NDWI) calculations on imagery from Landsat's Green and Near Infrared bands. The calculations were able to show a loss of 13 million acre-feet of water (around 60% of 2000 levels).

The second task was measuring land use changes in Dallas over a 15-year period.

Forecasting the Future
The third task in the fourth week was producing a model predicting ocean and sea temperature changes around Central America over the next few years based on data from the past few decades. The model's output was rendered as an animation over time.

Predicting Locations & Detecting Buildings
In the 5th week, we predicted where dinosaur fossils might be found along the US/Canada border area using satellite imagery.

There was also an exercise where Deep Learning was used to identify buildings in satellite imagery.

Sharing Spatial Insights
The final week went over producing online reports for the analysis that had been produced in this MOOC.

My Certificate
