In April, Meta AI released Segment Anything, a 632M-parameter model that can detect objects in images. It was trained over the course of 5 days on 256 Nvidia A100 GPUs. It can detect objects in both regular phone images as well as aerial imagery like satellite photos.
There are three model sizes ranging from a few hundred MBs for the base version to 2.1 GB for the "huge" version. The multiple versions allow you to choose between accuracy and performance.
Maxar Technologies was founded in 2017 in Colorado. The company is a result of a merger between MDA Holdings Company and DigitalGlobe with DigitalGlobe being founded in 1992. They manufacture satellites and sell the resulting imagery they collect among other business activities. If you view Tallinn's Old Town on Google Maps, the satellite image is credited to Maxar and Airbus. Maxar also runs an open data programme that releases imagery from disaster-struck regions.
In this blog post, I'll run Segment Anything on one of Maxar's images of New Zealand taken last year.
Installing Dependencies
The following was run on Ubuntu for Windows which is based on Ubuntu 20.04 LTS. The system is powered by an Intel Core i5 4670K running at 3.40 GHz and has 32 GB of RAM. I'm using an Nvidia GTX 1080 GPU and the primary partition is a 2 TB Samsung 870 QVO SSD. Nvidia GPUs make a world of difference when working with segmentation models but one isn't essential for this exercise.
I'll first install Python as well as some data and image manipulation tools.
$ sudo apt update
$ sudo apt install \
    build-essential \
    csvkit \
    gdal-bin \
    imagemagick \
    jq \
    python3-pip \
    python3-virtualenv
I'll use DuckDB for calculating statistics.
$ wget -c https://github.com/duckdb/duckdb/releases/download/v0.9.1/duckdb_cli-linux-amd64.zip
$ unzip -j duckdb_cli-linux-amd64.zip
$ chmod +x duckdb
I'll create a Python Virtual Environment that will hold both Segment Anything as well as its dependencies.
$ virtualenv ~/.sam
$ source ~/.sam/bin/activate
The following will clone Meta AI's Segment Anything codebase.
$ git clone https://github.com/facebookresearch/segment-anything
$ cd ~/segment-anything
I found the following 3-stage installation got past any package version complaints.
$ python3 -m pip install .
$ python3 -m pip install \
    opencv-python \
    matplotlib \
    ipython \
    pygments \
    rich \
    shpyx \
    torch \
    torchvision \
    typer
$ python3 -m pip install pycocotools
The following are 2.4 GB, 1.2 GB and 358 MB respectively. The "vit_h" file is the "huge" version of the model, "vit_l" is the "large" version and "vit_b" is the "base" version. I'll be using the huge version in this post but you can swap it out for the others if you're okay with decreased accuracy for the sake of faster inference times.
$ wget -c https://dl.fbaipublicfiles.com/segment_anything/sam_vit_h_4b8939.pth
$ wget -c https://dl.fbaipublicfiles.com/segment_anything/sam_vit_l_0b3195.pth
$ wget -c https://dl.fbaipublicfiles.com/segment_anything/sam_vit_b_01ec64.pth
Maxar's Satellite Imagery
I'll clone a copy of Maxar's Open Data repository. This contains metadata describing their satellite imagery as well as URLs of where each image can be downloaded from on AWS S3.
$ cd ~
$ git clone https://github.com/opengeos/maxar-open-data
$ cd maxar-open-data
Below is the first record in a GeoJSON file describing the inventory of images from both before and after the flooding in New Zealand this year.
$ jq '.features[0]|del(.geometry)' \
    datasets/New-Zealand-Flooding23.geojson
{
  "type": "Feature",
  "properties": {
    "datetime": "2022-12-11T22:13:04Z",
    "platform": "WV02",
    "gsd": 0.56,
    "ard_metadata_version": "0.0.1",
    "catalog_id": "10300100DE4D9300",
    "utm_zone": 60,
    "quadkey": "213311212301",
    "view:off_nadir": 24.6,
    "view:azimuth": 81,
    "view:incidence_angle": 62.2,
    "view:sun_azimuth": 71.2,
    "view:sun_elevation": 60.6,
    "proj:epsg": 32760,
    "grid:code": "MXRA-Z60-213311212301",
    "proj:bbox": "288975.9589705394,5934843.75,290156.25,5936341.136010622",
    "tile:data_area": 1.7,
    "tile:clouds_area": 0,
    "tile:clouds_percent": 0,
    "visual": "https://maxar-opendata.s3.amazonaws.com/events/New-Zealand-Flooding23/ard/60/213311212301/2022-12-11/10300100DE4D9300-visual.tif"
  }
}
I imported datasets/New-Zealand-Flooding23.geojson into QGIS and set the labels for each feature to display its corresponding quadkey. This was all overlaid on Esri's World Imagery Basemap.
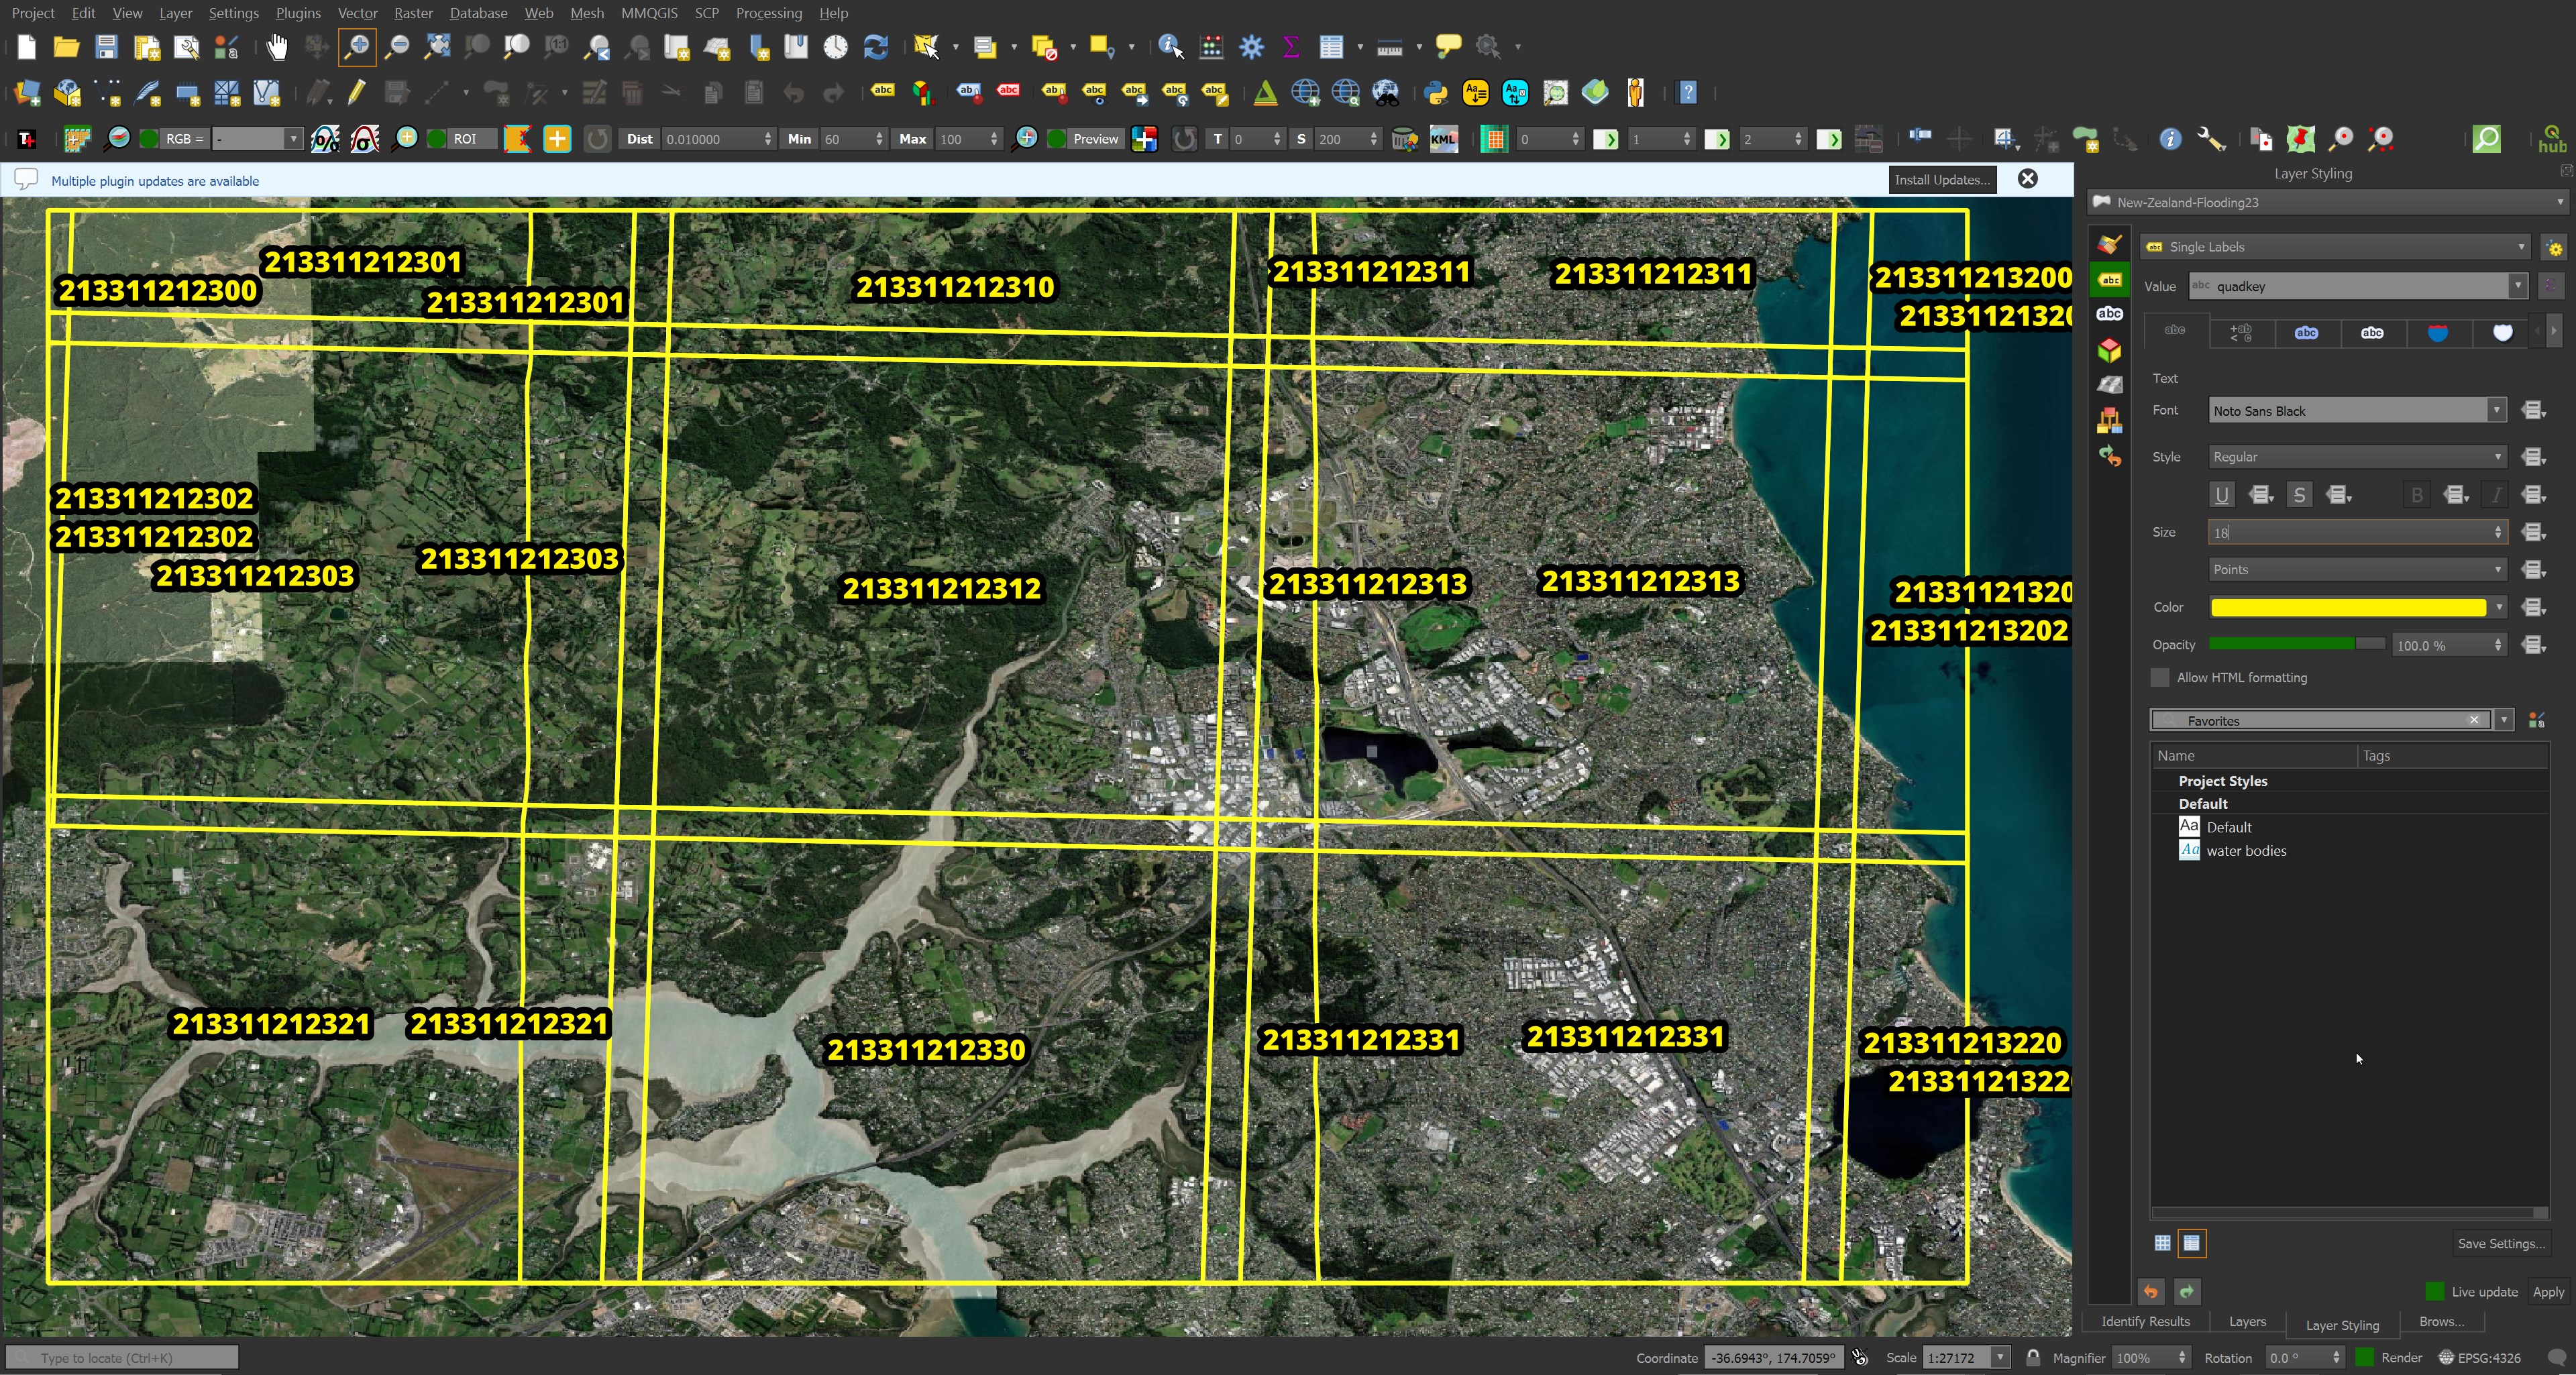
I'll pick out any images for the 213311212331 quadkey as it contains a number of buildings.
$ (head -n1 datasets/New-Zealand-Flooding23.tsv;
   grep 213311212331 datasets/New-Zealand-Flooding23.tsv) \
        | csvjson -t \
        | jq -S .
[
  {
    "ard_metadata_version": "0.0.1",
    "catalog_id": "104001007C86B200",
    "datetime": "2022-11-01T22:36:53",
    "grid:code": "MXRA-Z60-213311212331",
    "gsd": 0.34,
    "platform": "WV03",
    "proj:bbox": "294843.75,5925343.760246519,295807.13263462135,5930156.25",
    "proj:epsg": 32760,
    "quadkey": 213311212331,
    "tile:clouds_area": 0.2,
    "tile:clouds_percent": 4,
    "tile:data_area": 4.2,
    "utm_zone": 60,
    "view:azimuth": 264.4,
    "view:incidence_angle": 71,
    "view:off_nadir": 17.2,
    "view:sun_azimuth": 47.6,
    "view:sun_elevation": 60.5,
    "visual": "2001-11-01"
  },
  {
    "ard_metadata_version": "0.0.1",
    "catalog_id": "10300100DE4D9300",
    "datetime": "2022-12-11T22:13:03",
    "grid:code": "MXRA-Z60-213311212331",
    "gsd": 0.56,
    "platform": "WV02",
    "proj:bbox": "294843.75,5925343.760246519,300156.25,5930156.25",
    "proj:epsg": 32760,
    "quadkey": 213311212331,
    "tile:clouds_area": 0,
    "tile:clouds_percent": 0,
    "tile:data_area": 25.2,
    "utm_zone": 60,
    "view:azimuth": 78.2,
    "view:incidence_angle": 62.3,
    "view:off_nadir": 24.5,
    "view:sun_azimuth": 71.1,
    "view:sun_elevation": 60.6,
    "visual": "2001-12-11"
  },
  {
    "ard_metadata_version": "0.0.1",
    "catalog_id": "10300100E23B4300",
    "datetime": "2023-02-08T22:44:18",
    "grid:code": "MXRA-Z60-213311212331",
    "gsd": 0.58,
    "platform": "WV02",
    "proj:bbox": "294843.75,5925343.760246519,300156.25,5930156.25",
    "proj:epsg": 32760,
    "quadkey": 213311212331,
    "tile:clouds_area": 18.8,
    "tile:clouds_percent": 74,
    "tile:data_area": 25.2,
    "utm_zone": 60,
    "view:azimuth": 305.2,
    "view:incidence_angle": 59.3,
    "view:off_nadir": 27,
    "view:sun_azimuth": 56,
    "view:sun_elevation": 57,
    "visual": "2001-02-08"
  }
]
Three images are available for this location. I'll pick the one from November of 2022 and download it from AWS S3.
$ grep -o 'https://.*213311212331/2022-11.*.tif' \
    datasets/New-Zealand-Flooding23.tsv
$ wget -c https://maxar-opendata.s3.amazonaws.com/events/New-Zealand-Flooding23/ard/60/213311212331/2022-11-01/104001007C86B200-visual.tif
The resulting 104001007C86B200-visual.tif is 14.2 MB and is 17408 x 17408 pixels. Each pixel in the image is equivalent to 30cm2 on the ground.
$ gdalinfo 104001007C86B200-visual.tif
...
PROJCRS["WGS 84 / UTM zone 60S",
...
Pixel Size = (0.305175781250000,-0.305175781250000)
Only the top left 3300 x 16000 pixels had any imagery in it, the rest was black. I cropped out this area as it would reduce the model's RAM consumption.
Segmenting
When I originally tried to run this model on my Nvidia GTX 1080, the 8 GB of VRAM wasn't enough for the 3300 x 16000-pixel image and I got an out-of-memory error.
$ mkdir -p output

$ python ~/segment-anything/scripts/amg.py \
    --checkpoint ~/segment-anything/sam_vit_h_4b8939.pth \
    --model-type vit_h \
    --input ~/maxar-open-data/104001007C86B200-visual-cropped.tiff \
    --output output/
torch.cuda.OutOfMemoryError: CUDA out of memory. Tried to allocate 5.35 GiB (GPU 0; 8.00 GiB total capacity; 3.28 GiB already allocated; 3.39 GiB free; 3.61 GiB reserved in total by PyTorch) If reserved memory is >> allocated memory try setting max_split_size_mb to avoid fragmentation. See documentation for Memory Management and PYTORCH_CUDA_ALLOC_CONF
I then added a --device cpu flag to the above command to use my system's 32 GB of RAM and CPU for inference instead but I got an out-of-memory error there as well.
RuntimeError: [enforce fail at alloc_cpu.cpp:75] err == 0. DefaultCPUAllocator: can't allocate memory: you tried to allocate 40868077824 bytes. Error code 12 (Cannot allocate memory)
I ended up having to crop out the top left 2700 x 2700 pixels of the satellite image and resize it down to 512 x 512 pixels. This image was small enough for the huge version of the model to run on the 32 GB of RAM my system has.
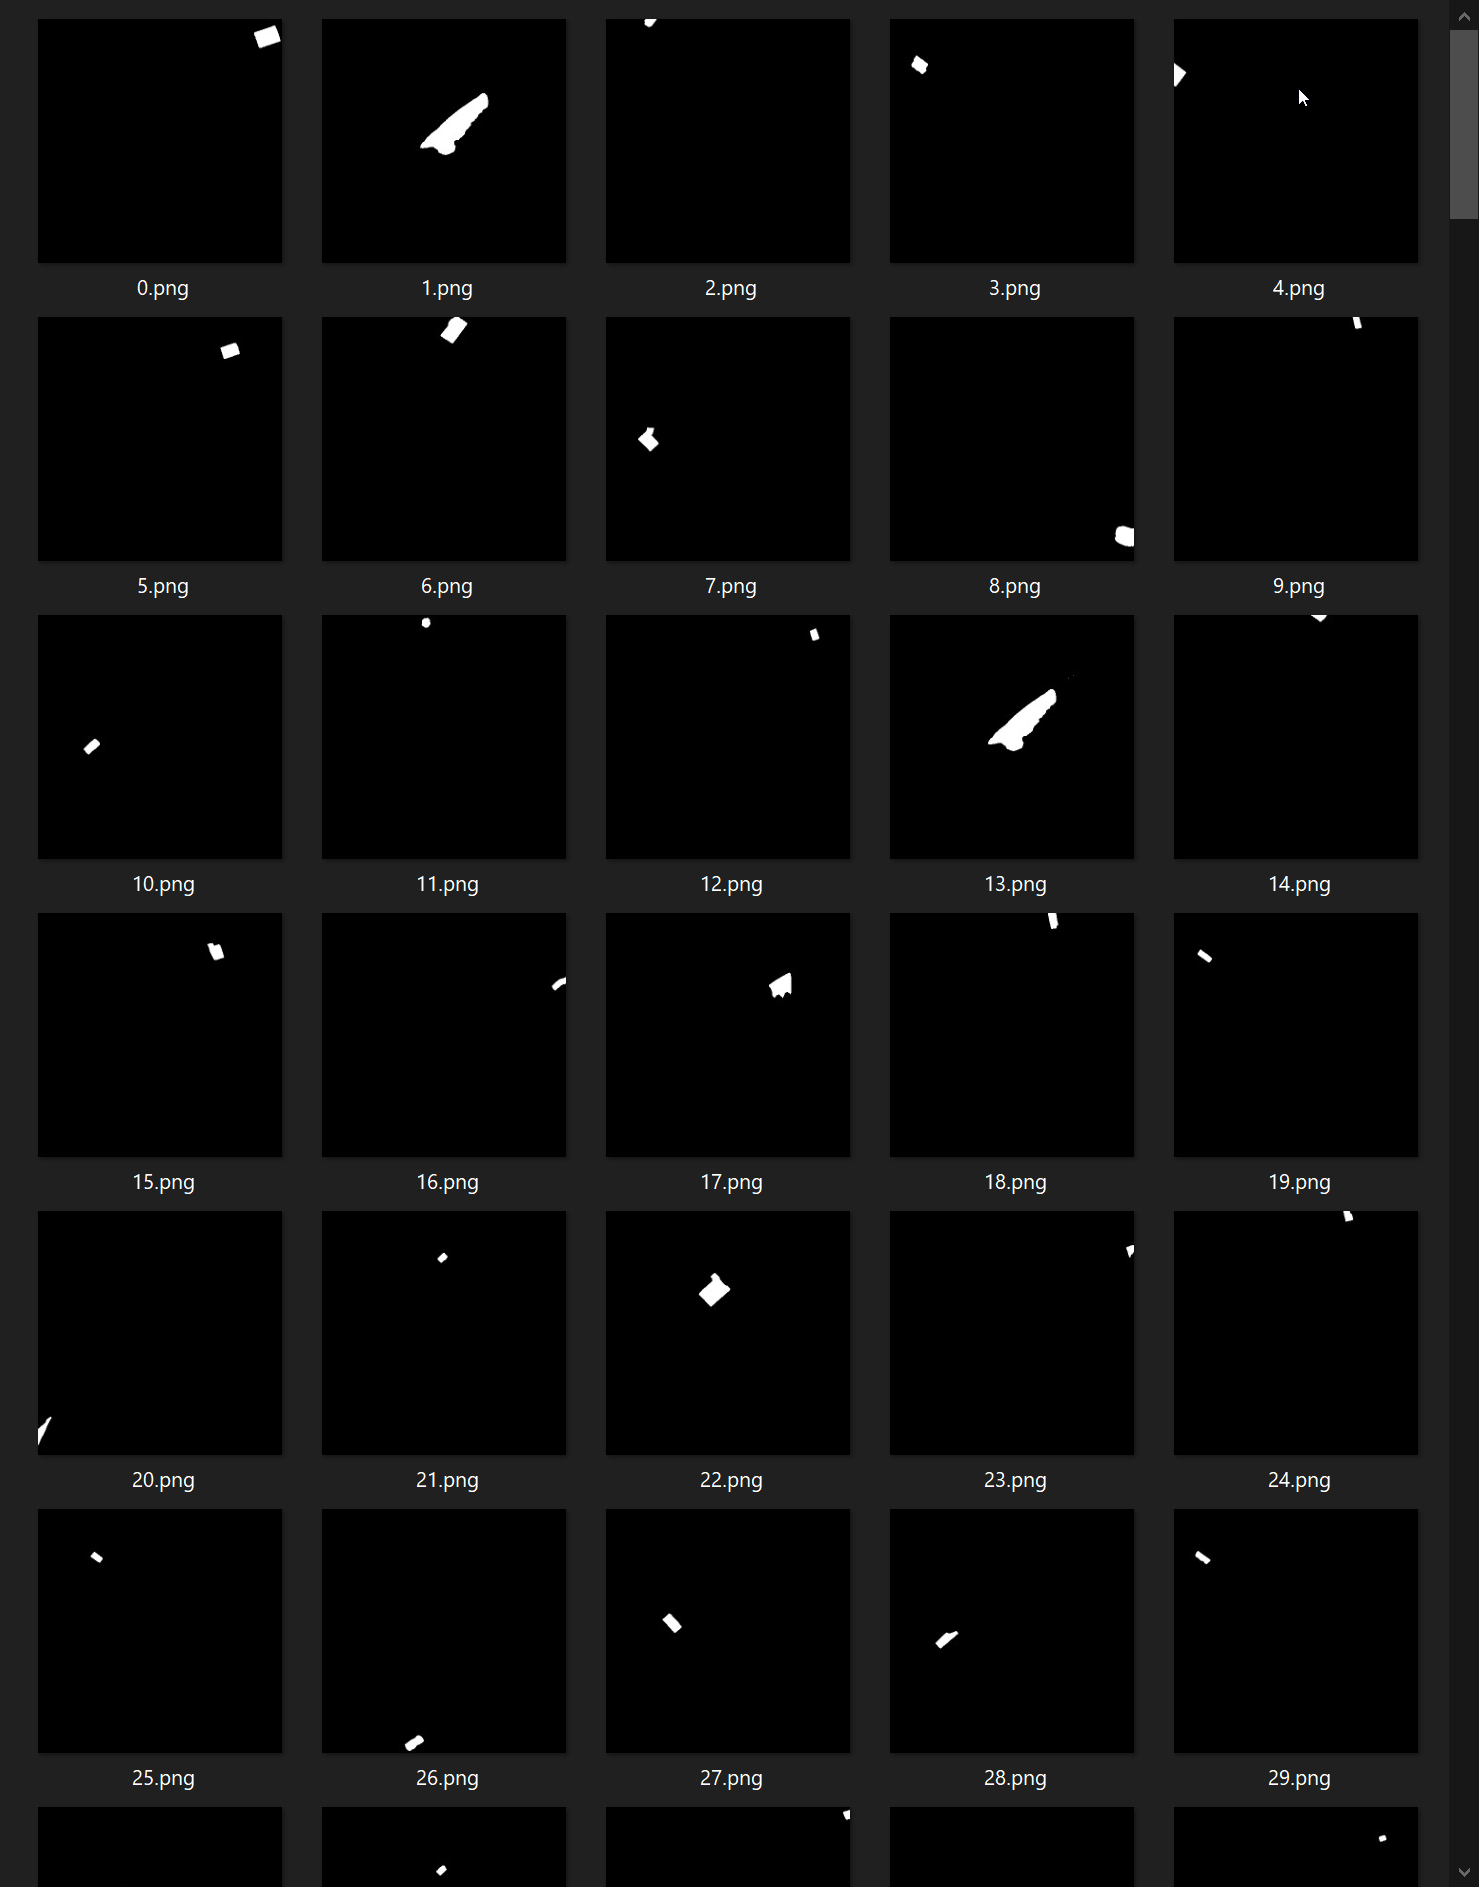
The segmentation job produced 430 PNG images between 1,116 and 1,753 bytes in size each. Below are the ten largest PNGs and their respective file sizes in bytes.
$ ls -lS output/104001007C86B200-visual-cropped-512/*.png | head
1753 ... 92.png
1680 ... 13.png
1671 ... 1.png
1556 ... 249.png
1491 ... 36.png
1445 ... 177.png
1429 ... 78.png
1403 ... 67.png
1399 ... 138.png
1399 ... 22.png
Each image is a black-and-white mask of the area an object was detected in.
There was also a 35 KB, 430-row CSV file produced with the resulting metadata from the job. Below is the first record.
$ head -n2 output/104001007C86B200-visual-cropped-512/metadata.csv \
    | csvjson \
    | jq -S .
[
  {
    "area": 1682,
    "bbox_h": 46,
    "bbox_w": 54,
    "bbox_x0": 454,
    "bbox_y0": 14,
    "crop_box_h": 512,
    "crop_box_w": 512,
    "crop_box_x0": false,
    "crop_box_y0": false,
    "id": false,
    "point_input_x": 472,
    "point_input_y": 24,
    "predicted_iou": 0.9976826906204224,
    "stability_score": 0.9882006049156189
  }
]
The average stability score was 0.9753147073956423.
$ echo "SELECT avg(stability_score)
        FROM 'output/104001007C86B200-visual-cropped-512/metadata.csv'" \
    | ~/duckdb
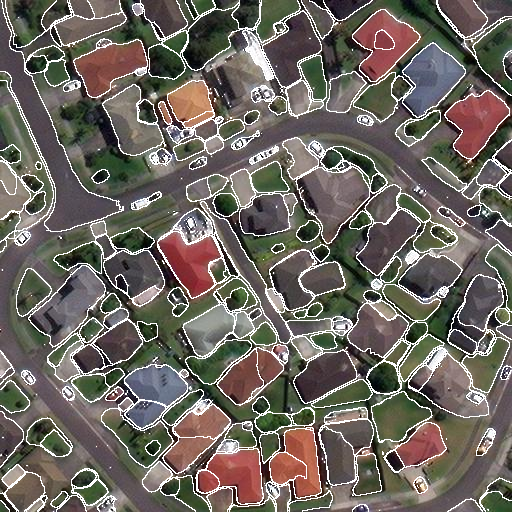
I used a script detailed below to merge each segment onto the original Maxar Satellite Imagery.
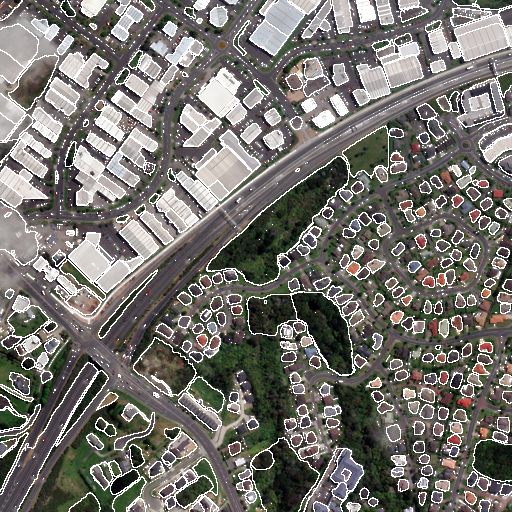
I'm impressed that just about every building and home was detected. The model doesn't label each segment with what the model believes the object to be, but the segments nonetheless could save a lot of time digitising with something like QGIS or ArcGIS Pro.
Tiling Imagery
I believe the resizing of the source image down 5x removed enough detail to cause the model to miss a few properties. I attempted to break the original GeoTIFF from Maxar up into 512 x 512-pixel tiles and process them individually. ImageMagick won't work on images this large by default so I had to modify its limits first.
$ sudo vi /etc/ImageMagick-6/policy.xml
These are the new values for their respective settings.
<policy domain="resource" name="memory" value="48GiB"/>
<policy domain="resource" name="map"    value="30GiB"/>
<policy domain="resource" name="width"  value="40MP"/>
<policy domain="resource" name="height" value="40MP"/>
<policy domain="resource" name="area"   value="40GB"/>
<policy domain="resource" name="disk"   value="30GiB"/>
My first attempt at tiling was with ImageMagick version 6.9.10-23 which is the latest version that Ubuntu for Windows will install via its packaging system. This version of the software complained that there were unsupported features in the GeoTIFF and it refused to create any tiles.
$ convert 104001007C86B200-visual.tif \
    +repage \
    -crop \
    512x512 \
    104001007C86B200-%04d.png
imagemagick Sorry, can not handle image with PhotometricInterpretation error/tiff.c/TIFFErrors/604
I ended up compiling the latest master branch of the project into a new folder so as to not overwrite my existing installation.
$ git clone https://github.com/ImageMagick/ImageMagick
$ cd ImageMagick
$ mkdir -p build
$ ./configure --prefix=`pwd`/build
$ make -j$(nproc)
$ sudo make install
$ build/bin/convert --version
Version: ImageMagick 7.1.1-21 (Beta) Q16-HDRI x86_64 98bb1d414:20231008 https://imagemagick.org
Copyright: (C) 1999 ImageMagick Studio LLC
License: https://imagemagick.org/script/license.php
Features: Cipher DPC HDRI OpenMP(4.5)
Delegates (built-in): fontconfig freetype heic jbig jng jp2 jpeg lcms lzma openexr png tiff webp x xml zlib
Compiler: gcc (9.4)
I was then able to produce tiles of the original GeoTIFF.
$ build/bin/convert \
    104001007C86B200-visual.tif \
    +repage \
    -crop \
    512x512 \
    104001007C86B200-%04d.tiff
There were many tiles that were completely black as much of the original source material was. I ran the following to remove those images.
$ for FILENAME in 104001007C86B200-*.tiff; do
    MEAN=`convert $FILENAME -format "%[mean]" info:`
    if [ "$MEAN" = 0 ]; then
        rm $FILENAME
    fi
  done
I then ran a segmentation automation script that will be described below.
$ for FILENAME in 104001007C86B200-[0-9]*.tiff; do
    python sam_merge.py $FILENAME
  done
All but one house has been identified correctly. The increased resolution is what the segmentation model needed.
The tiles are small enough that I'm able to run the segmentation model using my Nvidia GTX 1080. This greatly speeds up the process. The only downside of using tiles is that ImageMagick doesn't support carrying over and offsetting the geographic metadata found in the original GeoTIFF. This means I can't just drag these tiles into QGIS or another GIS application and have them place themselves in the right spots on the Globe automatically.
Below is a sample of some of the geospatial information present in the GeoTIFF Maxar published.
$ gdalinfo 104001007C86B200-visual.tif
Driver: GTiff/GeoTIFF
Files: /mnt/f/gis/Global/maxar-open-data/104001007C86B200-visual.tif
Size is 17408, 17408
Coordinate System is:
PROJCRS["WGS 84 / UTM zone 60S",
    BASEGEOGCRS["WGS 84",
        DATUM["World Geodetic System 1984",
            ELLIPSOID["WGS 84",6378137,298.257223563,
                LENGTHUNIT["metre",1]]],
        PRIMEM["Greenwich",0,
            ANGLEUNIT["degree",0.0174532925199433]],
        ID["EPSG",4326]],
...
Below shows that the above geospatial information is missing from the 512 x 512-pixel tiles.
$ gdalinfo 104001007C86B200-0000.tiff
Driver: GTiff/GeoTIFF
Files: /mnt/f/gis/Global/maxar-open-data/104001007C86B200-0000.tiff
Size is 512, 512
Image Structure Metadata:
  INTERLEAVE=PIXEL
Corner Coordinates:
Upper Left  (    0.0,    0.0)
Lower Left  (    0.0,  512.0)
Upper Right (  512.0,    0.0)
Lower Right (  512.0,  512.0)
Center      (  256.0,  256.0)
Band 1 Block=512x5 Type=Byte, ColorInterp=Red
Band 2 Block=512x5 Type=Byte, ColorInterp=Green
Band 3 Block=512x5 Type=Byte, ColorInterp=Blue
I raised the issue with the ImageMagick project.
Phone Camera Imagery
I wrote a Python script that wraps up the tasks of segmenting and merging the resulting masks onto the source imagery.
$ vi sam_merge.py
from   glob     import glob
from   os.path  import splitext
from   tempfile import mkdtemp
import time

from   pygments            import highlight
from   pygments.lexers     import BashLexer
from   pygments.formatters import TerminalFormatter
from   rich.progress       import Progress, track
from   shpyx               import run as _exec
import typer


app = typer.Typer(rich_markup_mode='rich')


def print_bash(cmd):
    print(highlight(cmd.strip(),
                    BashLexer(),
                    TerminalFormatter()))


remove_ext = lambda filename: splitext(filename)[0]


@app.command()
def build(source: str,
          amg: str =
            '/home/mark/segment-anything/scripts/amg.py',
          checkpoint: str =
            '/home/mark/segment-anything/sam_vit_h_4b8939.pth',
          model_type: str = 'vit_h',
          device: str     = 'cuda',
          max_height: int = 512,
          verbose: bool   = False):
    output_folder = mkdtemp()

    if verbose:
        print('Using %s' % output_folder)

    cmd = 'convert %s -resize x%d\\> %s/input.png' % (
                source,
                max_height,
                output_folder)

    if verbose:
        print_bash(cmd)

    _exec(cmd)

    cmd = 'python %(amg)s ' \
          '--checkpoint %(checkpoint)s ' \
          '--model-type %(model_type)s ' \
          '--device %(device)s ' \
          '--input %(source)s ' \
          '--output %(output)s/' % {
            'amg':        amg,
            'checkpoint': checkpoint,
            'model_type': model_type,
            'device':     device,
            'source':     '%s/input.png' % output_folder,
            'output':     output_folder}

    if verbose:
        print_bash(cmd)

    _exec(cmd)

    overlay = r'-edge 1 -colorspace RGB -fill black -fuzz 10% ' \
              r'+opaque "#FFFFFF" -transparent black -composite'

    joins = ' '.join(['%s %s' % (x, overlay)
                      for x in glob('%s/*/[0-9]*.png' % output_folder)])
    outlines = remove_ext(source) + '_outlines.png'
    output = '%s_%s_%d.png' % (remove_ext(source),
                               model_type,
                               int(time.time()))

    cmds = [
        "convert %s %s %s" % (
            '%s/input.png' % output_folder,
            joins,
            outlines),
        "convert %s %s -compose Lighten -composite %s" % (
            '%s/input.png' % output_folder,
            outlines,
            output),
        'rm %s' % outlines,
        'rm -fr %s' % output_folder]

    for cmd in cmds:
        if verbose:
            print_bash(cmd)

        _exec(cmd)


if __name__ == "__main__":
    app()
I used the above script on several photos I took around Tallinn and some surrounding areas this summer. I wanted to run the huge model so I opted to use my system's 32 GB of RAM rather than the 8 GB of VRAM on my Nvidia GTX 1080.
$ for FILENAME in 202*.jpg; do
    python sam_merge.py $FILENAME --device=cpu --verbose
  done
The halftone shading you're seeing is an artefact from my overlaying script and not the model. The source images were resized to 512 pixels tall while retaining their aspect ratio. This was done to speed up segmentation. This doesn't appear to have affected the model's ability to detect objects for the most part.
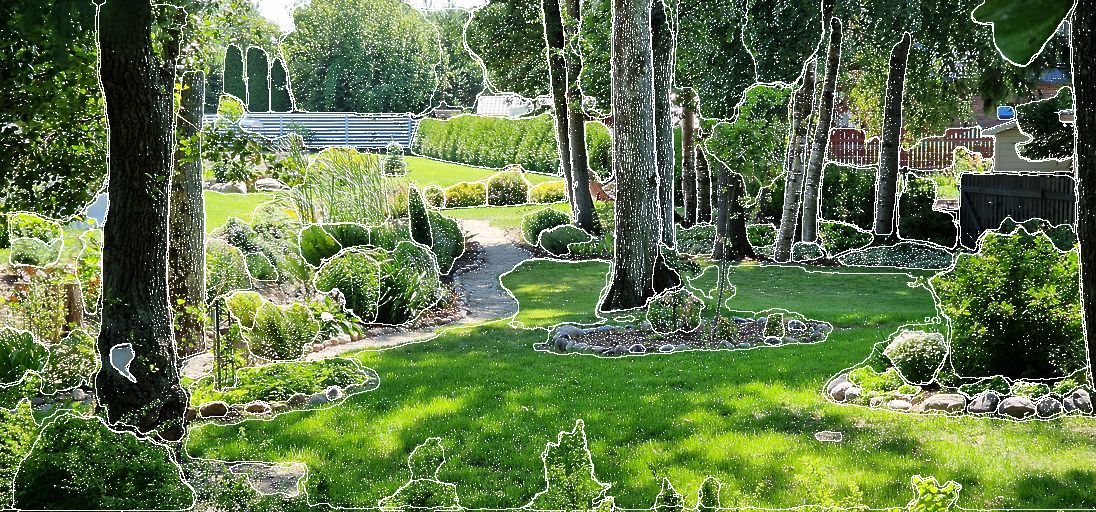
The following was taken in a garden outside of Tallinn. All of the trees, plant life, rocks and fencing are identified extremely well.
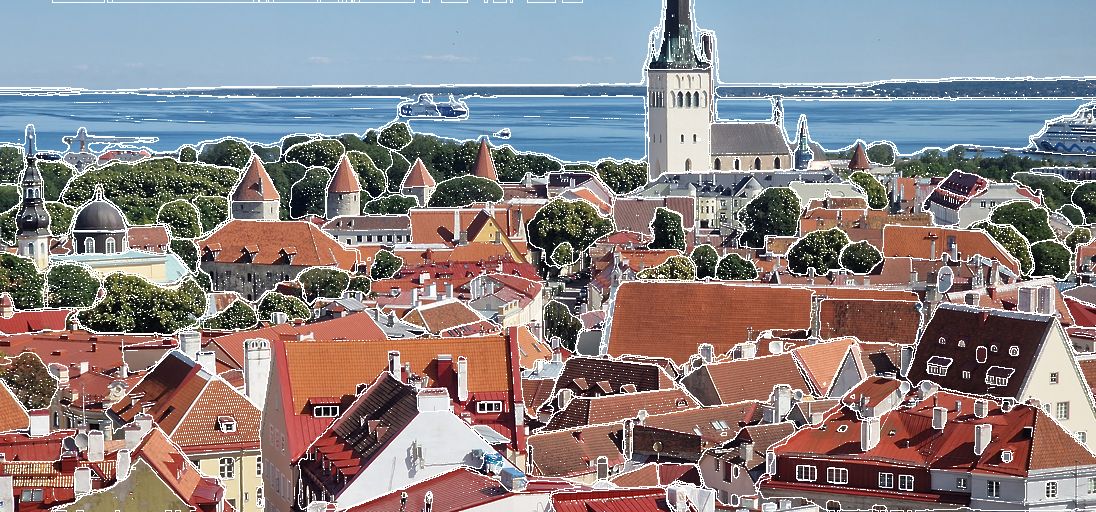
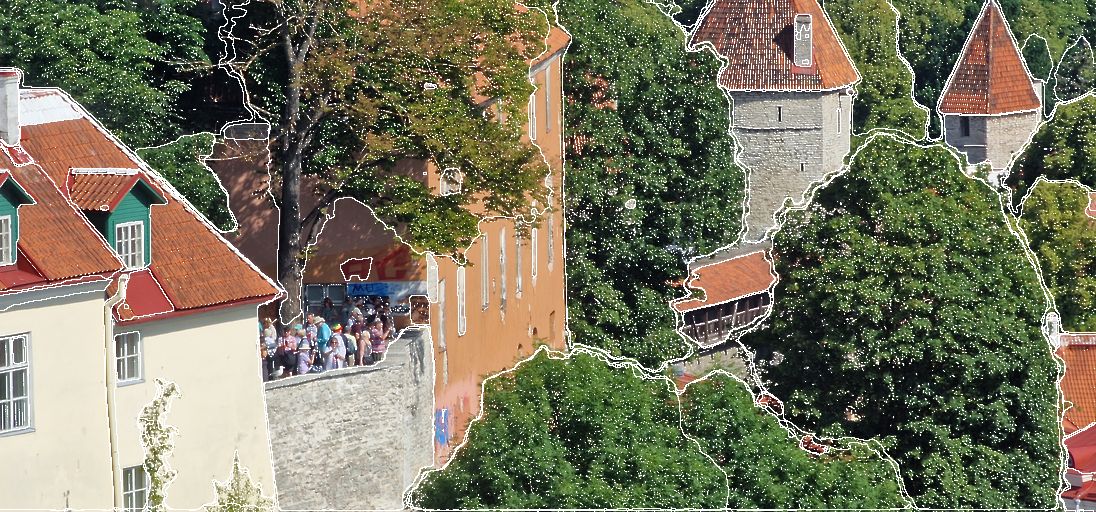
The following was taken from the observation area of St. Nicholas' Church in Tallinn's Old Town. All of the uniquely shaped buildings are clearly picked out in what is a very busy image.
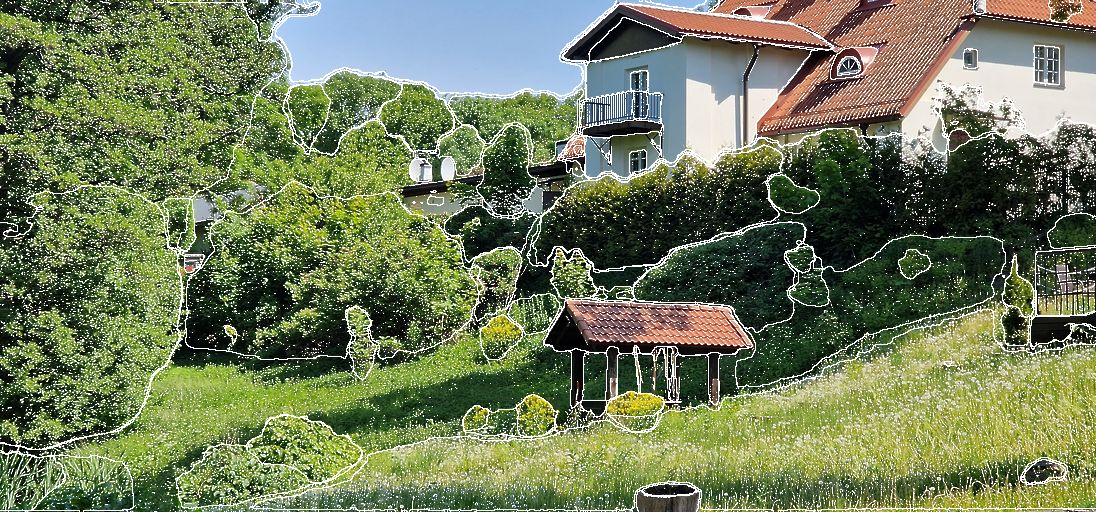
Below was taken outside of Tallinn and again, does a remarkable job of detecting individual plant life and features on the building in the background.
The people standing at the lookout in the image below aren't individually segmented. This could be due to a lack of resolution in the image.
Each individual has been segmented in this image though.
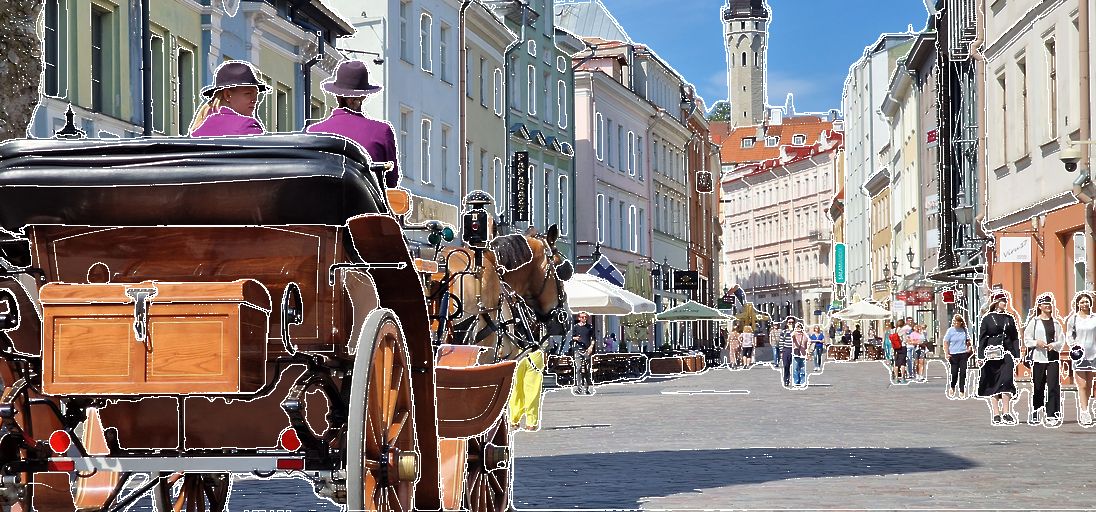
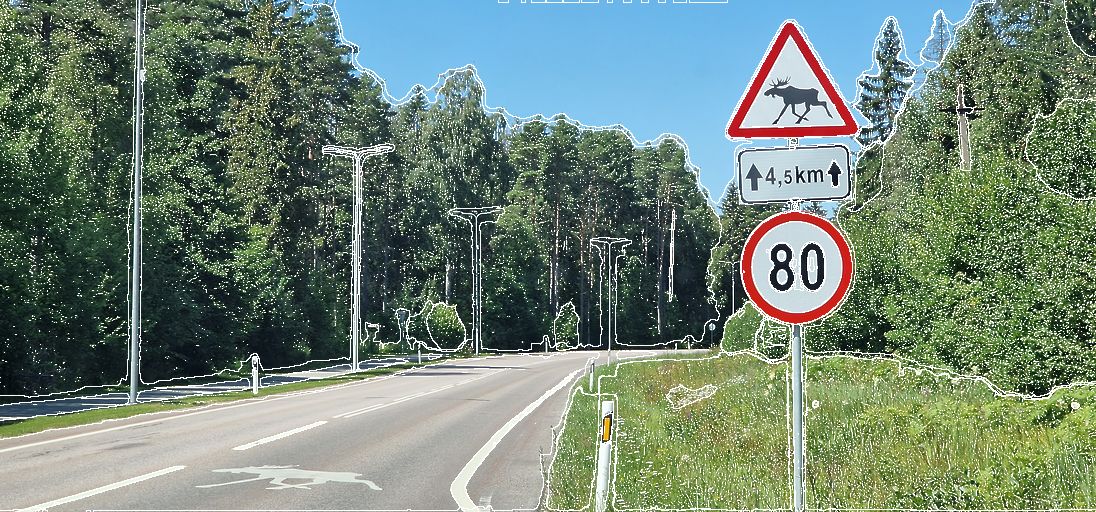
The road sign was picked out but both its border and inner symbology are separate segments rather than a single segment. The painted moose sign on the road was missed by the model as well.