In 2009, Skybox Imaging was founded. They built and launched two satellites before being acquired by Google in 2014. Google went on to launch another five satellites before selling the firm to Planet Labs in 2017.
Planet Labs is a 13-year-old, San Francisco-based satellite manufacturer and constellation operator. They have around 1,000 employees, operate or have operated four different constellations throughout their history and they take a photo of the entire Earth every day using 100s of satellites. Planet Labs has since added another 14 satellites to the SkySat constellation.
The satellite that took the imagery in this post is SkySat-6, also known as SkySat-C4 or "SSC4". It was launched on the 16th of September, 2016 from Kourou, French Guiana. This satellite is much heavier than the "cellphone parts in space" Dove satellites Planet Labs is famous for. It weighs around 100 KG whereas the Dove satellites are around 4 KG.
Originally these satellites could collect imagery at a resolution of 80cm until Planet Labs lowered their altitude from 500 KM to 450 KM above the Earth's surface in 2020. This resulted in their resolution improving to 50cm.
In this post, I'll examine an image SkySat-6 took of Kiribati in 2020 and see how much I can reduce its filesize with WebP compression.
I'd like to thank Chris Holmes at Planet Labs for suggesting the imagery used in this post.
A Pacific Nation
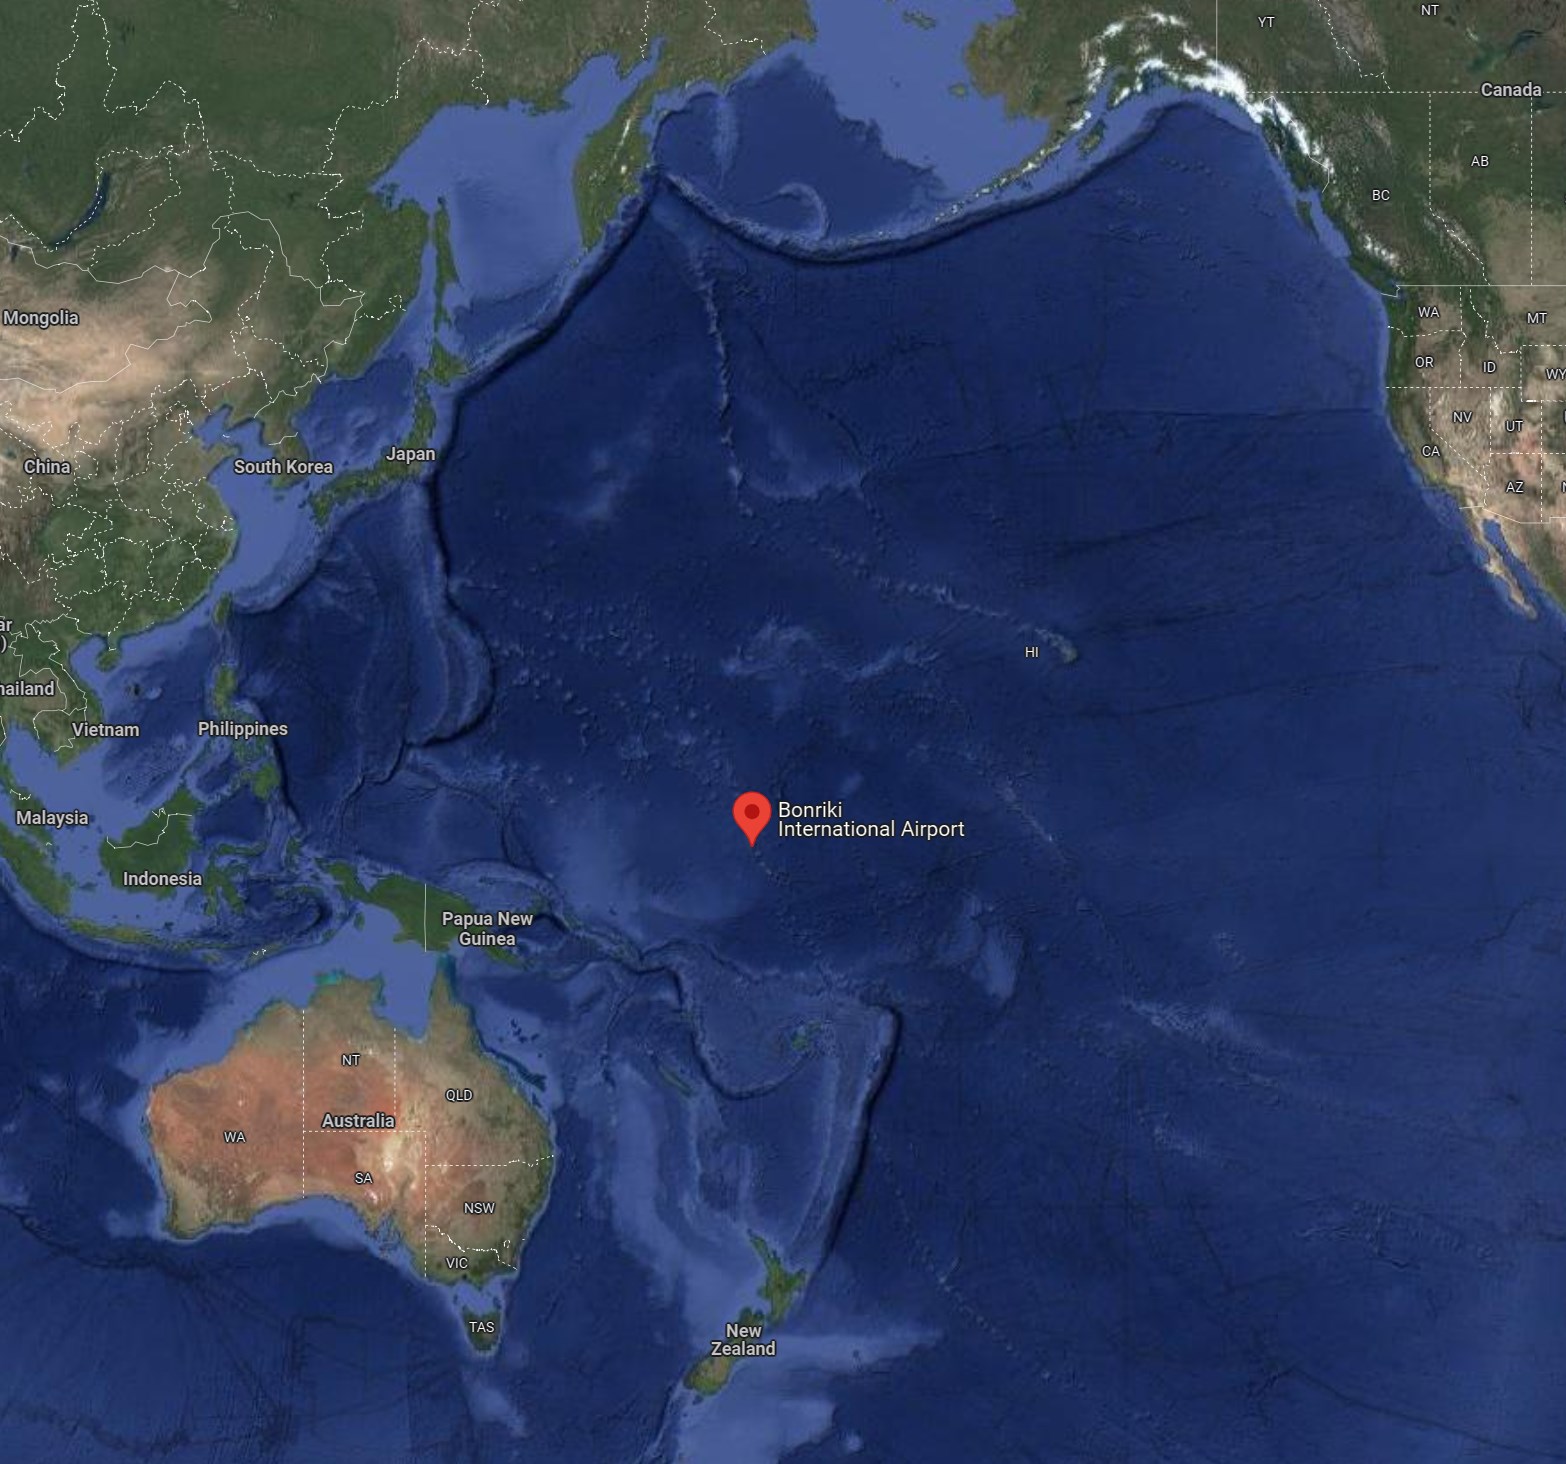
Kiribati sits in the middle of the Pacific Ocean close to the equator. It is almost 4,000 KM southwest of Hawaii, 5,775 KM east of the Philippines and 4,700 KM north of New Zealand.
The country is made up of 32 atolls and one remote raised coral island. Half of their population lives on Tarawa atoll, the subject of the imagery in this blog post.
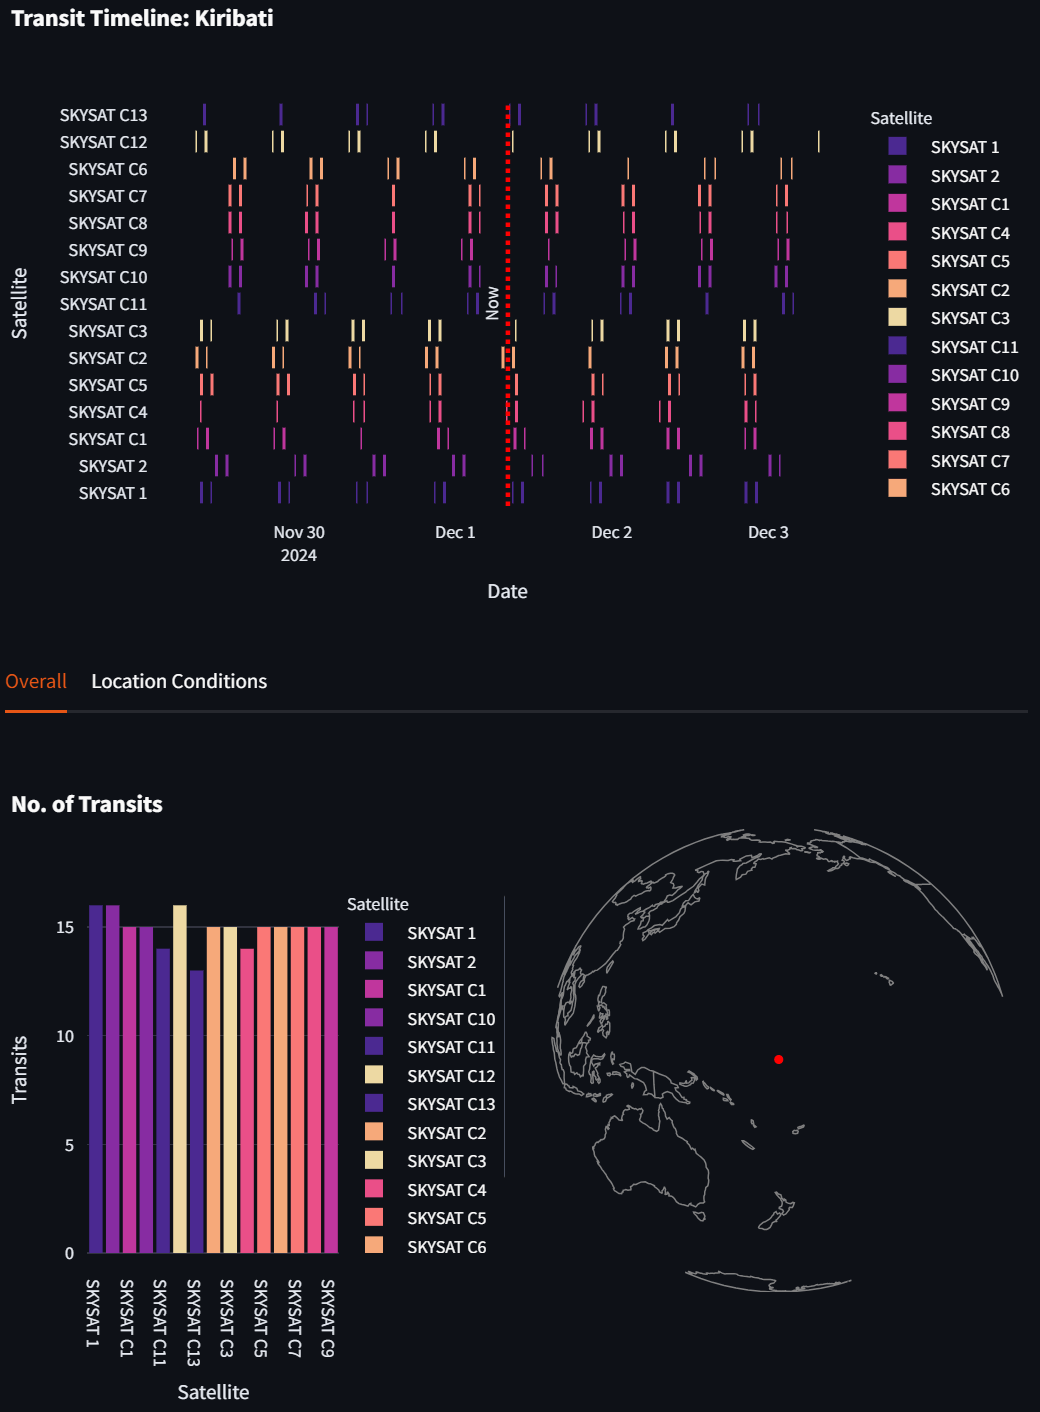
Below is PulseOrbital's list of estimated Kiribati flyovers by Planet Lab's SkySat constellation over the next few days.
My Workstation
I'm using a 6 GHz Intel Core i9-14900K CPU. It has 8 performance cores and 16 efficiency cores with a total of 32 threads and 32 MB of L2 cache. It has a liquid cooler attached and is housed in a spacious, full-sized, Cooler Master HAF 700 computer case. I've come across videos on YouTube where people have managed to overclock the i9-14900KF to 9.1 GHz.
The system has 96 GB of DDR5 RAM clocked at 6,000 MT/s and a 5th-generation, Crucial T700 4 TB NVMe M.2 SSD which can read at speeds up to 12,400 MB/s. There is a heatsink on the SSD to help keep its temperature down. This is my system's C drive.
The system is powered by a 1,200-watt, fully modular, Corsair Power Supply and is sat on an ASRock Z790 Pro RS Motherboard.
I'm running Ubuntu 22 LTS via Microsoft's Ubuntu for Windows on Windows 11 Pro. In case you're wondering why I don't run a Linux-based desktop as my primary work environment, I'm still using an Nvidia GTX 1080 GPU which has better driver support on Windows and I use ArcGIS Pro from time to time which only supports Windows natively.
Installing Prerequisites
I'll use GDAL 3.4.1, Python 3.8 and a few other tools to help analyse the data in this post.
$ sudo apt update
$ sudo apt install \
    gdal-bin \
    jq \
    libimage-exiftool-perl \
    libtiff-tools \
    python3-pip \
    python3-virtualenv
I'll set up a Python Virtual Environment and install some dependencies.
$ python3 -m venv ~/.planetlabs
$ source ~/.planetlabs/bin/activate
I'll use my GeoTIFFs analysis utility in this post.
$ git clone https://github.com/marklit/geotiffs \
    ~/geotiffs
$ python3 -m pip install \
          -r ~/geotiffs/requirements.txt
I'll also use my OSM vector tile extraction utility.
$ git clone https://github.com/marklit/tiles2columns \
    ~/tiles2columns
$ python3 -m pip install \
          -r ~/tiles2columns/requirements.txt
The maps in this post were rendered with QGIS version 3.40. QGIS is a desktop application that runs on Windows, macOS and Linux. The application has grown in popularity in recent years and has ~15M application launches from users all around the world each month.
I used QGIS' Tile+ plugin to add geospatial context with Esri's World Imagery Basemap to the maps. Esri's imagery has been tinted blue to help contrast against Planet Lab's overlapping imagery.
Downloading Annotations
The following will download 380 tiles from OpenStreetMap's (OSM) new vector tile server. That data will be converted into named GeoPackage (GPKG) files. These files can be dropped onto QGIS projects and their attributes are easy to address and use for labels and styling.
$ mkdir -p ~/kiribati
$ cd ~/kiribati

$ python ~/tiles2columns/main.py \
    centroid \
    172.98279 1.45066 \
    --distance=0.2
Below are the GPKG files produced by the above command.
$ ls -lht *.gpkg
1.9M .. buildings.gpkg
324K .. ocean.gpkg
316K .. streets.gpkg
164K .. pois.gpkg
140K .. land.gpkg
132K .. street_labels.gpkg
124K .. water_polygons.gpkg
112K .. sites.gpkg
104K .. ferries.gpkg
104K .. water_lines.gpkg
 96K .. addresses.gpkg
 96K .. bridges.gpkg
 96K .. pier_lines.gpkg
 96K .. pier_polygons.gpkg
 96K .. place_labels.gpkg
 96K .. public_transport.gpkg
 96K .. water_lines_labels.gpkg
 96K .. water_polygons_labels.gpkg
I've downloaded a list of settlements in CSV format for Kiribati from SimpleMaps.com. I'll use these to identify the population centres on Tarawa Atoll.
Planet Lab's Open Satellite Data
Planet Labs host an Open SkySat STAC that includes imagery from Kiribati. I'll download the 876 MB "ortho visual" GeoTIFF for Kiribati.
$ wget https://storage.googleapis.com/open-cogs/planet-stac/20201211_223832_ssc4_u0001/20201211_223832_ssc4_u0001_visual_file_format.tif
I'll also download its GeoJSON metadata file which explains the circumstances under which the image was taken.
$ wget https://storage.googleapis.com/open-cogs/planet-stac/20201211_223832_ssc4_u0001/20201211_223832_ssc4_u0001_metadata.json
Planet Lab's Kiribati Imagery
I've highlighted the Planet Lab's Kiribati satellite image below in red. It's surrounded by Esri's imagery for geospatial context. Esri's imagery has been tinted blue to help contrast it with Planet Lab's imagery. I used the OSM and SimpleMaps data above to annotate the imagery.
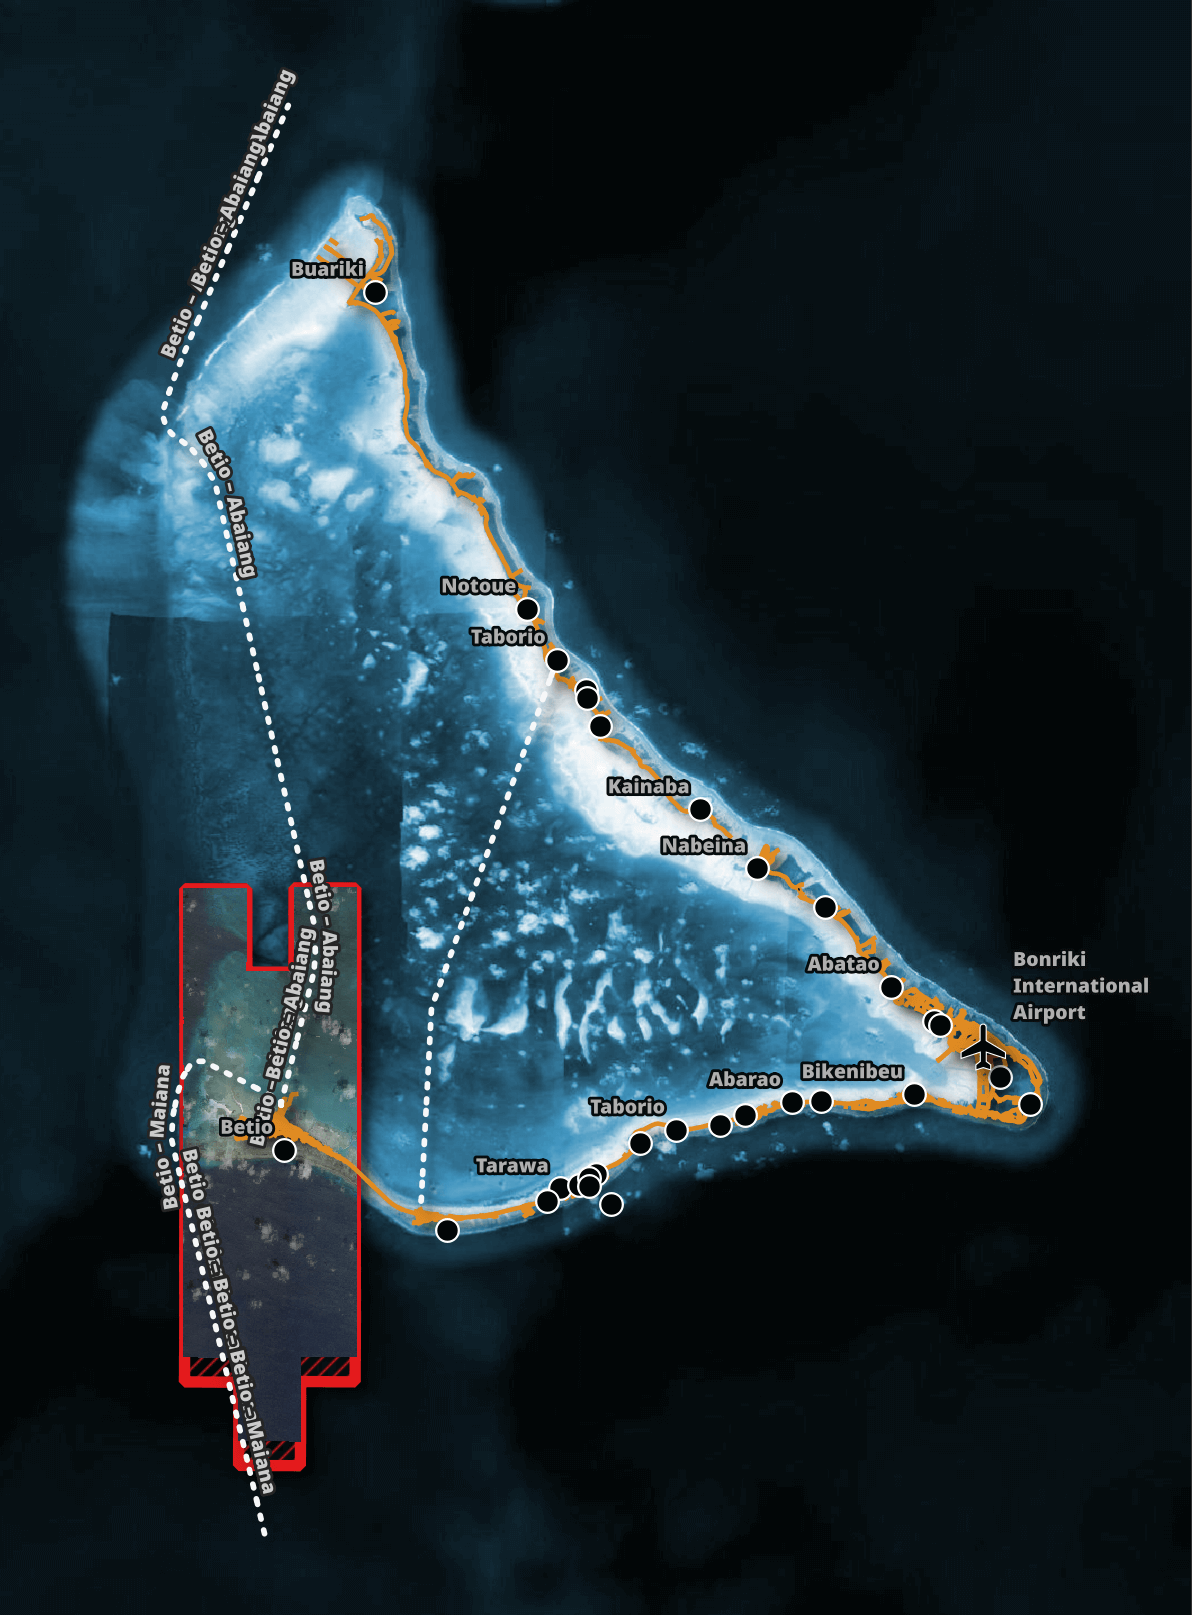
According to Planet Lab's metadata, the image only has 3% cloud cover, no haze or shadows, has a resolution of 50cm and was taken at 10:38 AM local time on December 11th, 2020.
Weather Underground says it was sunny and 27C at the time but there had been heavy rain two hours earlier.
$ jq -S .properties 20201211_223832_ssc4_u0001_metadata.json
{
  "acquired": "2020-12-11T22:38:32.125Z",
  "clear_confidence_percent": 93,
  "clear_percent": 96,
  "cloud_cover": 0.03,
  "cloud_percent": 3,
  "ground_control_ratio": 0.09,
  "gsd": 0.66,
  "heavy_haze_percent": 0,
  "item_type": "SkySatCollect",
  "light_haze_percent": 0,
  "pixel_resolution": 0.5,
  "provider": "skysat",
  "published": "2020-12-12T02:34:52Z",
  "publishing_stage": "finalized",
  "quality_category": "standard",
  "satellite_azimuth": 82.8,
  "satellite_id": "SSC4",
  "shadow_percent": 1,
  "snow_ice_percent": 0,
  "strip_id": "s104_20201211T223832Z",
  "sun_azimuth": 135.7,
  "sun_elevation": 54.9,
  "updated": "2020-12-12T02:34:52Z",
  "view_angle": 3.8,
  "visible_confidence_percent": 83,
  "visible_percent": 97
}
There are four different resolutions bundled into the GeoTIFF. This allows for smaller amounts of data to be read when the image is viewed at lower resolutions. This is handy for quickly loading low-resolution versions of the image on web pages before the user begins to zoom into the imagery.
The highest resolution image in this GeoTIFF is 11675 x 39108-pixels.
$ python3 ~/geotiffs/main.py \
    stack \
    20201211_223832_ssc4_u0001_visual_file_format.tif
[
    {
        "Compression Scheme": "LZW",
        "Extra Samples": "1<unassoc-alpha>",
        "Photometric Interpretation": "RGB color",
        "Planar Configuration": "single image plane",
        "Predictor": "horizontal differencing 2 (0x2)",
        "Sample Format": "unsigned integer",
        "stack_num": 1,
        "width": 11675
    },
    {
        "Compression Scheme": "LZW",
        "Extra Samples": "1<unassoc-alpha>",
        "Photometric Interpretation": "RGB color",
        "Planar Configuration": "single image plane",
        "Predictor": "horizontal differencing 2 (0x2)",
        "Sample Format": "unsigned integer",
        "Subfile Type": "reduced-resolution image (1 = 0x1)",
        "stack_num": 2,
        "width": 3892
    },
    {
        "Compression Scheme": "LZW",
        "Extra Samples": "1<unassoc-alpha>",
        "Photometric Interpretation": "RGB color",
        "Planar Configuration": "single image plane",
        "Predictor": "horizontal differencing 2 (0x2)",
        "Sample Format": "unsigned integer",
        "Subfile Type": "reduced-resolution image (1 = 0x1)",
        "stack_num": 3,
        "width": 1298
    },
    {
        "Compression Scheme": "LZW",
        "Extra Samples": "1<unassoc-alpha>",
        "Photometric Interpretation": "RGB color",
        "Planar Configuration": "single image plane",
        "Predictor": "horizontal differencing 2 (0x2)",
        "Sample Format": "unsigned integer",
        "Subfile Type": "reduced-resolution image (1 = 0x1)",
        "stack_num": 4,
        "width": 433
    }
]
The imagery SkySat satellites produce comes in three long columns with the middle column shifted either above or below the other two. Without an alpha channel, the imagery gaps could appear black and obstruct any basemap or other data underneath Planet Lab's imagery.
Certain compression codecs supported by GeoTIFF files don't support alpha channels so these should be avoided with SkySat imagery.
WebP Compression
GeoTIFFs can rely on a number of codecs and compression schemes. LZW is being used in this case with Planet Lab's imagery. LZW was originally developed in the mid-1980s and supported by a wide number of applications. That said, it lacks the compression efficiency of modern codecs.
Google introduced WebP in 2010 and by 2018, had released a stable library for it.
GDAL had already supported WebP for many years prior to the release of version 3.4.1 from January 2022 that Ubuntu for Windows installs.
Below I'll re-compress the imagery in Planet Lab's GeoTIFF using WebP. This will default to a quality setting of 75%.
$ gdal_translate \
    -co NUM_THREADS=ALL_CPUS \
    -of COG \
    -co COMPRESS=WEBP \
    -co PREDICTOR=2 \
    20201211_223832_ssc4_u0001_visual_file_format.tif \
    webp.tif
The LZW-compressed GeoTIFF was 877 MB and the WebP GeoTIFF is only 30 MB.
Below, you can see the four images for the resolution pyramid have been retained.
$ python3 ~/geotiffs/main.py \
    stack \
    webp.tif
[
    {
        "Compression Scheme": "WEBP",
        "Extra Samples": "1<unassoc-alpha>",
        "Photometric Interpretation": "RGB color",
        "Planar Configuration": "single image plane",
        "Sample Format": "unsigned integer",
        "stack_num": 1,
        "width": 11675
    },
    {
        "Compression Scheme": "WEBP",
        "Extra Samples": "1<unassoc-alpha>",
        "Photometric Interpretation": "RGB color",
        "Planar Configuration": "single image plane",
        "Sample Format": "unsigned integer",
        "Subfile Type": "reduced-resolution image (1 = 0x1)",
        "stack_num": 2,
        "width": 3892
    },
    {
        "Compression Scheme": "WEBP",
        "Extra Samples": "1<unassoc-alpha>",
        "Photometric Interpretation": "RGB color",
        "Planar Configuration": "single image plane",
        "Sample Format": "unsigned integer",
        "Subfile Type": "reduced-resolution image (1 = 0x1)",
        "stack_num": 3,
        "width": 1298
    },
    {
        "Compression Scheme": "WEBP",
        "Extra Samples": "1<unassoc-alpha>",
        "Photometric Interpretation": "RGB color",
        "Planar Configuration": "single image plane",
        "Sample Format": "unsigned integer",
        "Subfile Type": "reduced-resolution image (1 = 0x1)",
        "stack_num": 4,
        "width": 433
    }
]
And the metadata is still present in the WebP-compressed GeoTIFF.
$ gdalinfo -json webp.tif \
    | jq -r .coordinateSystem.wkt
PROJCRS["WGS 84 / UTM zone 59N",
    BASEGEOGCRS["WGS 84",
        DATUM["World Geodetic System 1984",
            ELLIPSOID["WGS 84",6378137,298.257223563,
                LENGTHUNIT["metre",1]]],
        PRIMEM["Greenwich",0,
            ANGLEUNIT["degree",0.0174532925199433]],
        ID["EPSG",4326]],
    CONVERSION["UTM zone 59N",
        METHOD["Transverse Mercator",
            ID["EPSG",9807]],
        PARAMETER["Latitude of natural origin",0,
            ANGLEUNIT["degree",0.0174532925199433],
            ID["EPSG",8801]],
        PARAMETER["Longitude of natural origin",171,
            ANGLEUNIT["degree",0.0174532925199433],
            ID["EPSG",8802]],
        PARAMETER["Scale factor at natural origin",0.9996,
            SCALEUNIT["unity",1],
            ID["EPSG",8805]],
        PARAMETER["False easting",500000,
            LENGTHUNIT["metre",1],
            ID["EPSG",8806]],
        PARAMETER["False northing",0,
            LENGTHUNIT["metre",1],
            ID["EPSG",8807]]],
    CS[Cartesian,2],
        AXIS["(E)",east,
            ORDER[1],
            LENGTHUNIT["metre",1]],
        AXIS["(N)",north,
            ORDER[2],
            LENGTHUNIT["metre",1]],
    USAGE[
        SCOPE["Engineering survey, topographic mapping."],
        AREA["Between 168°E and 174°E, northern hemisphere between equator and 84°N, onshore and offshore. Russian Federation; United States (USA) - Alaska."],
        BBOX[0,168,84,174]],
    ID["EPSG",32659]]
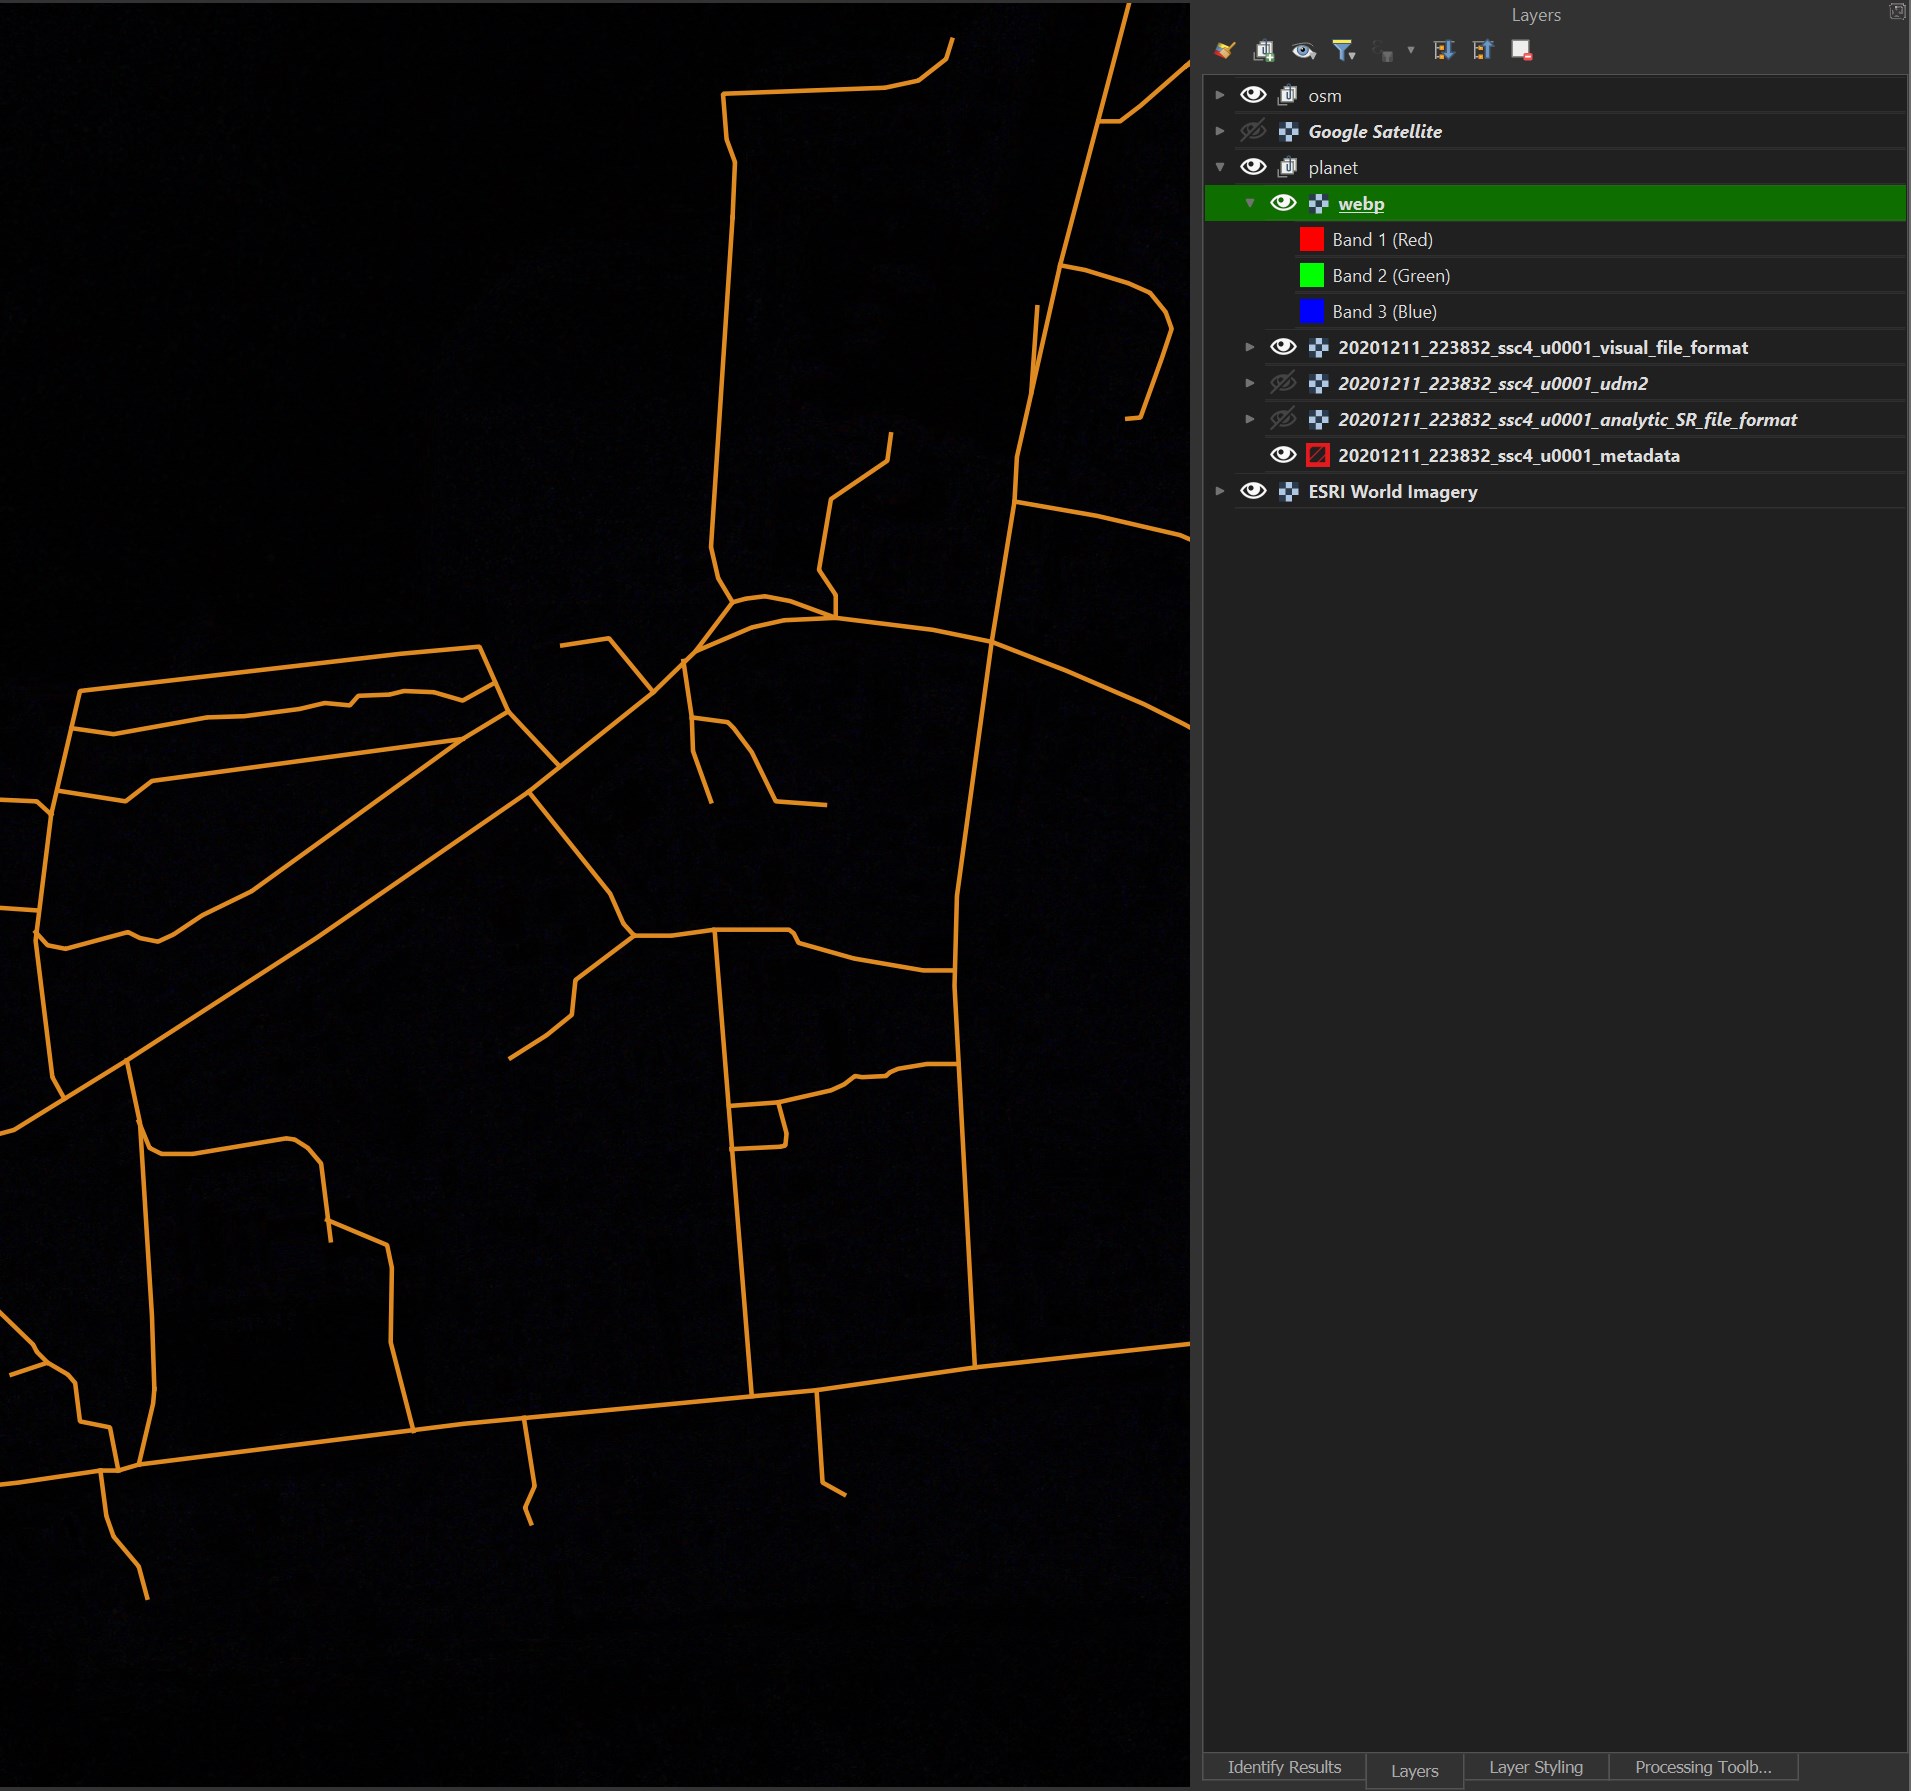
When I overlay the WebP image on top of the LZW-compressed image and apply a difference blending mode, no change in imagery is visible.
Exporting WebP from QGIS
If you want to export a raster layer in QGIS to a WebP-compressed GeoTIFF file, right click on its layer, click "Export" and then "Save As".
Then, tick the "Create Options" box in the middle of the UI. Regardless of the profile that is selected, clear out all of the options below it and add a "COMPRESS" option with "WEBP" as its value.
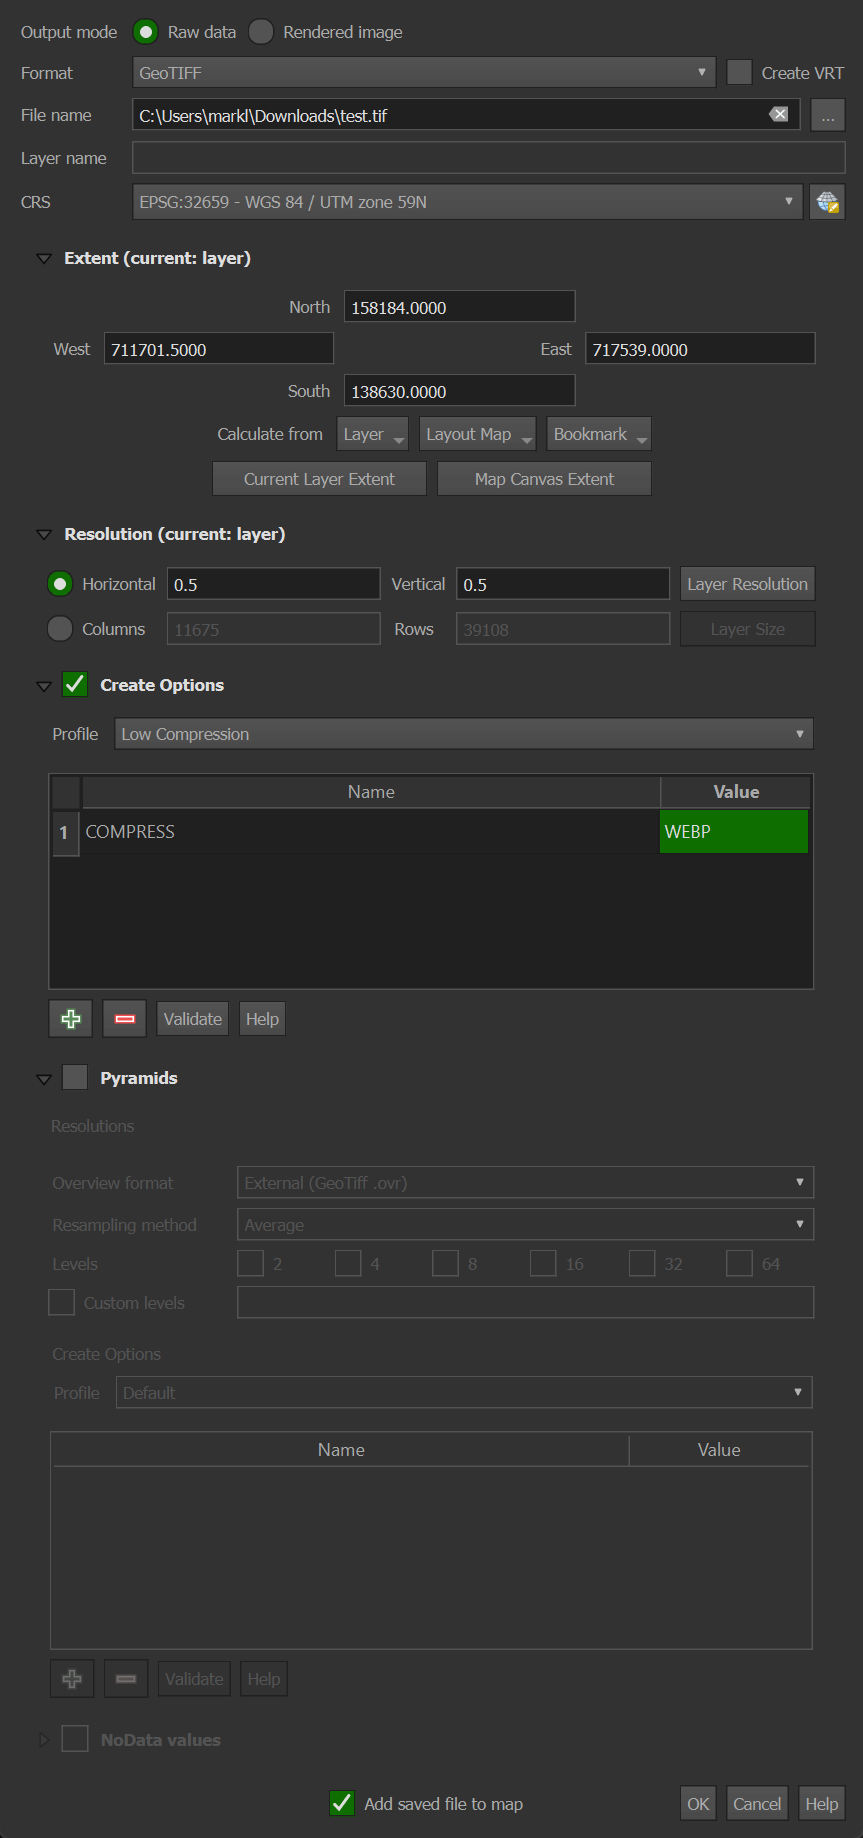
Without any other flags, it'll export the raster using lossy compression at 75%. WebP supports lossless and a few other options as well.
AVIF Comparison?
AVIF is a rival compression scheme to WebP. GDAL added support for it into their main branch in September. This code has yet to make its way into a stable GDAL release. When it does and QGIS begins shipping with its support, I'll put together a comparison between these two compression schemes.