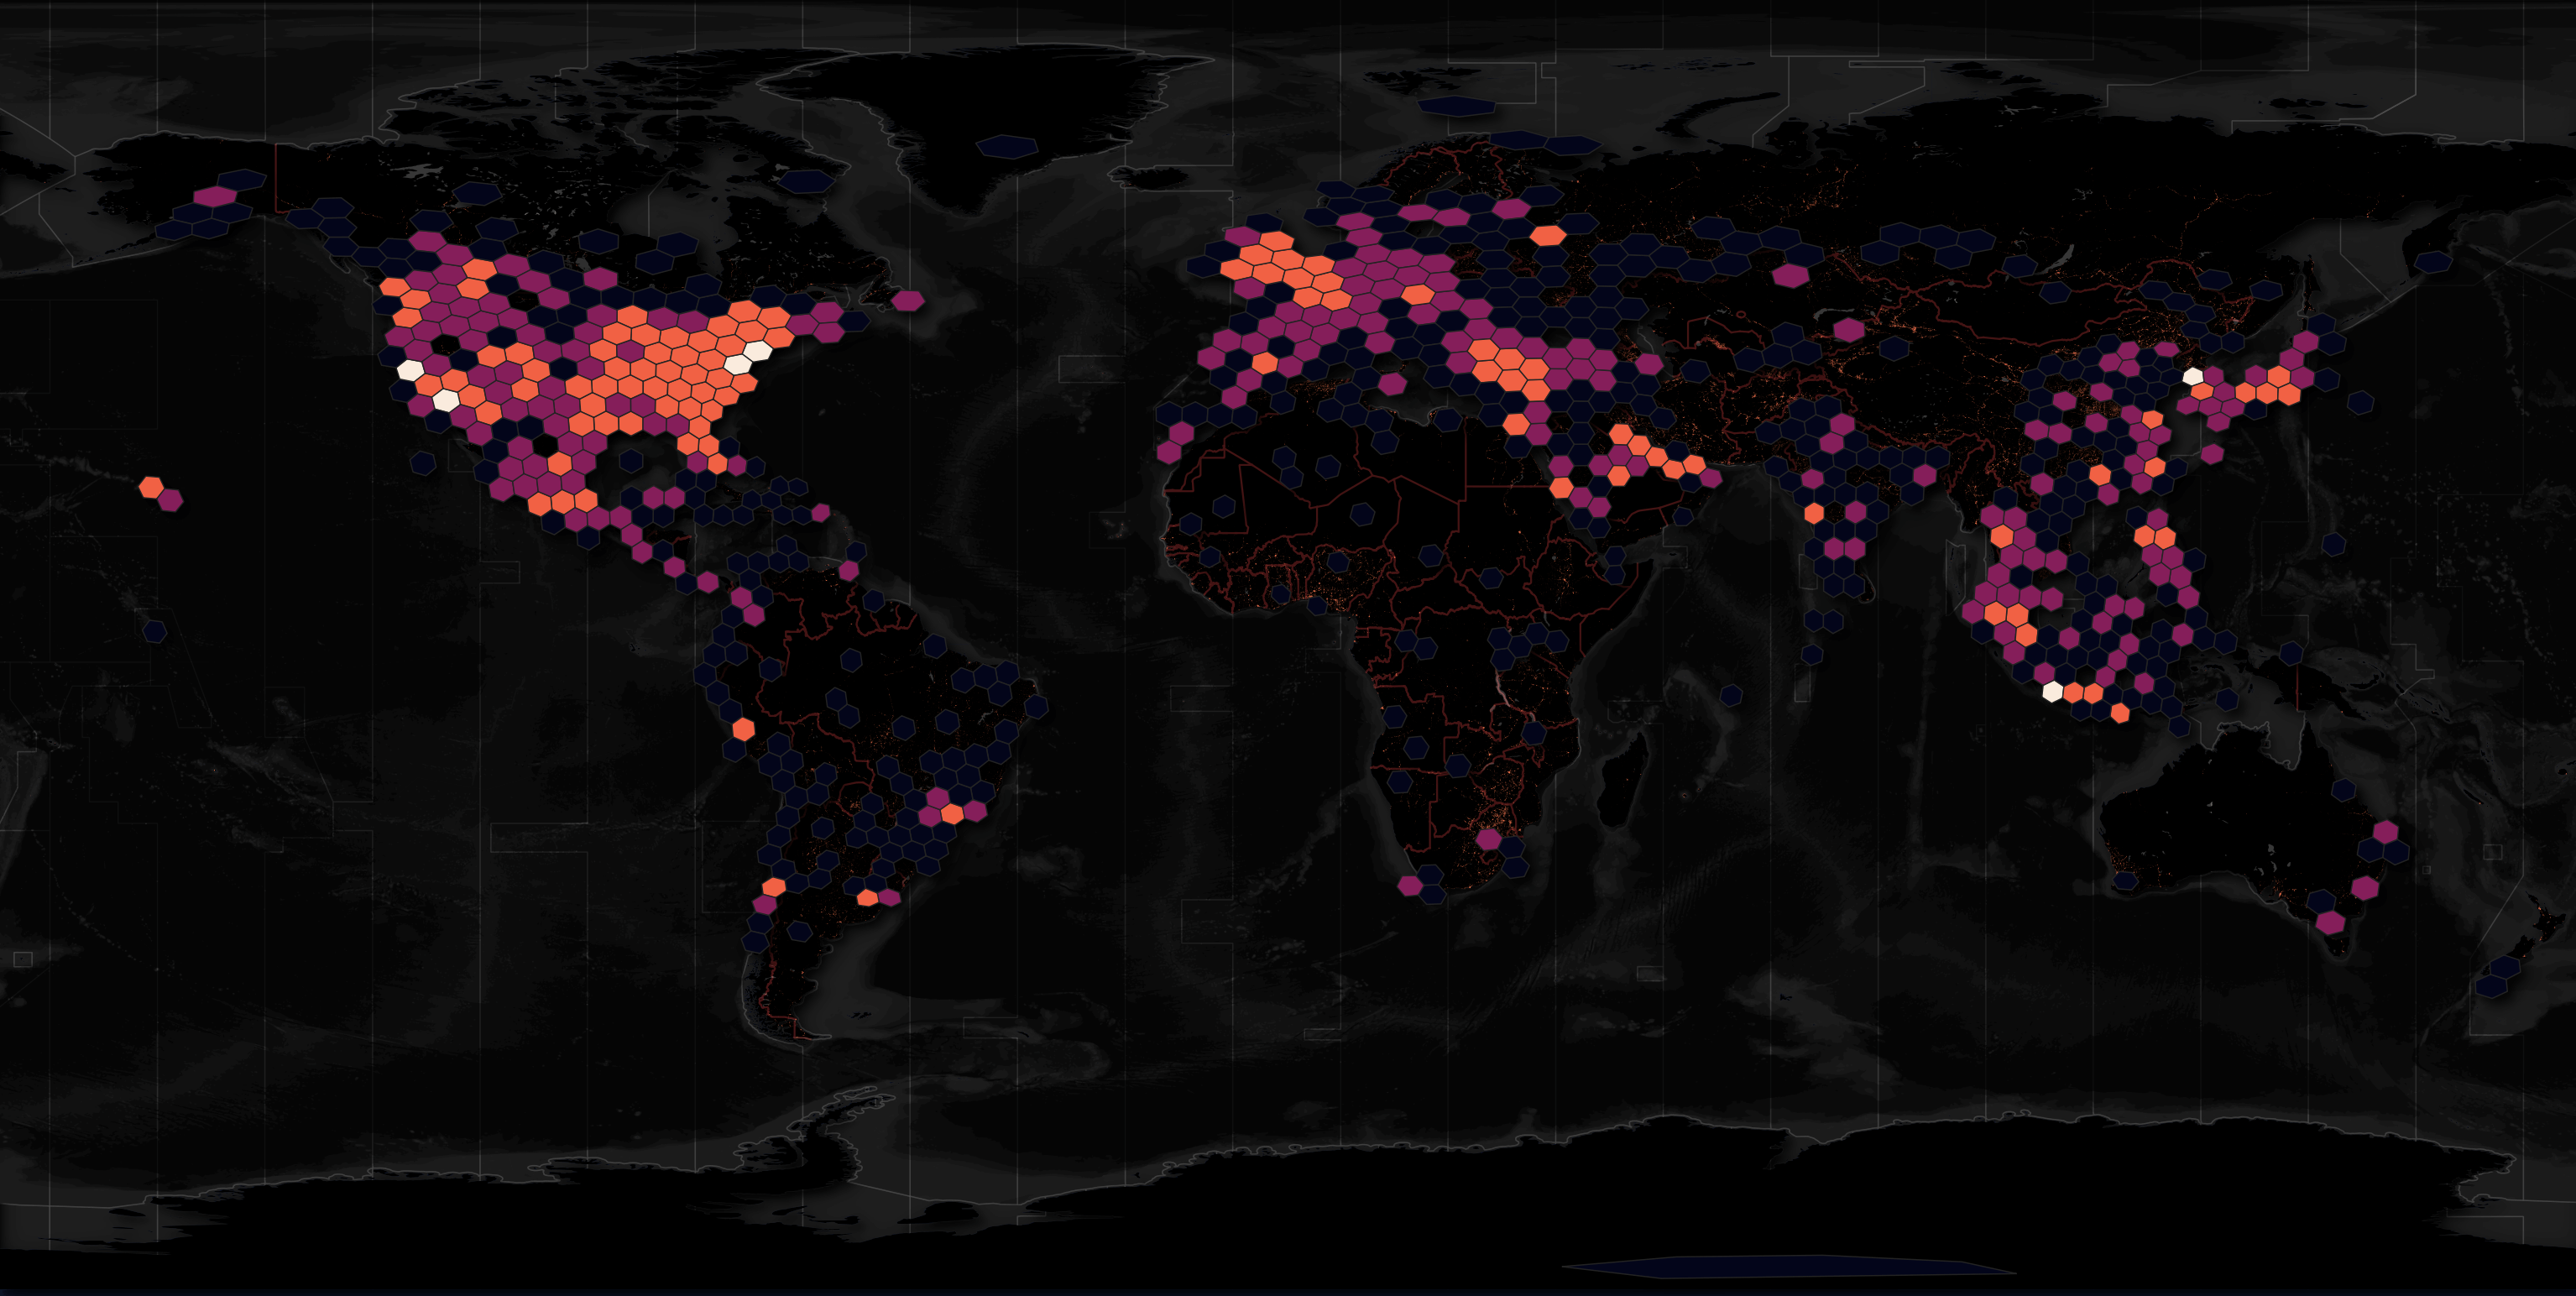
Point of Interest (POI) datasets of any strong quality have rarely been published freely. Overture and OpenStreetMap (OSM) have been making inroads but even in 2021, I could only find half of Starbucks' locations in OSM.
Companies that produce these datasets can charge yearly rental fees that run into the 6-figure territory.
I've worked with a few of these commercial feeds. On their own, they're not great for plotting POIs on maps but they're invaluable for building geocoding systems.
This week, Foursquare announced they're making their POI dataset freely available. I was really surprised to hear this as I suspect they were earning a good amount of revenue from this dataset and there isn't a lot of competition from the freely available datasets.
In this post, I'll dive into Foursquare's newly open POI dataset.
Thank you, Fused
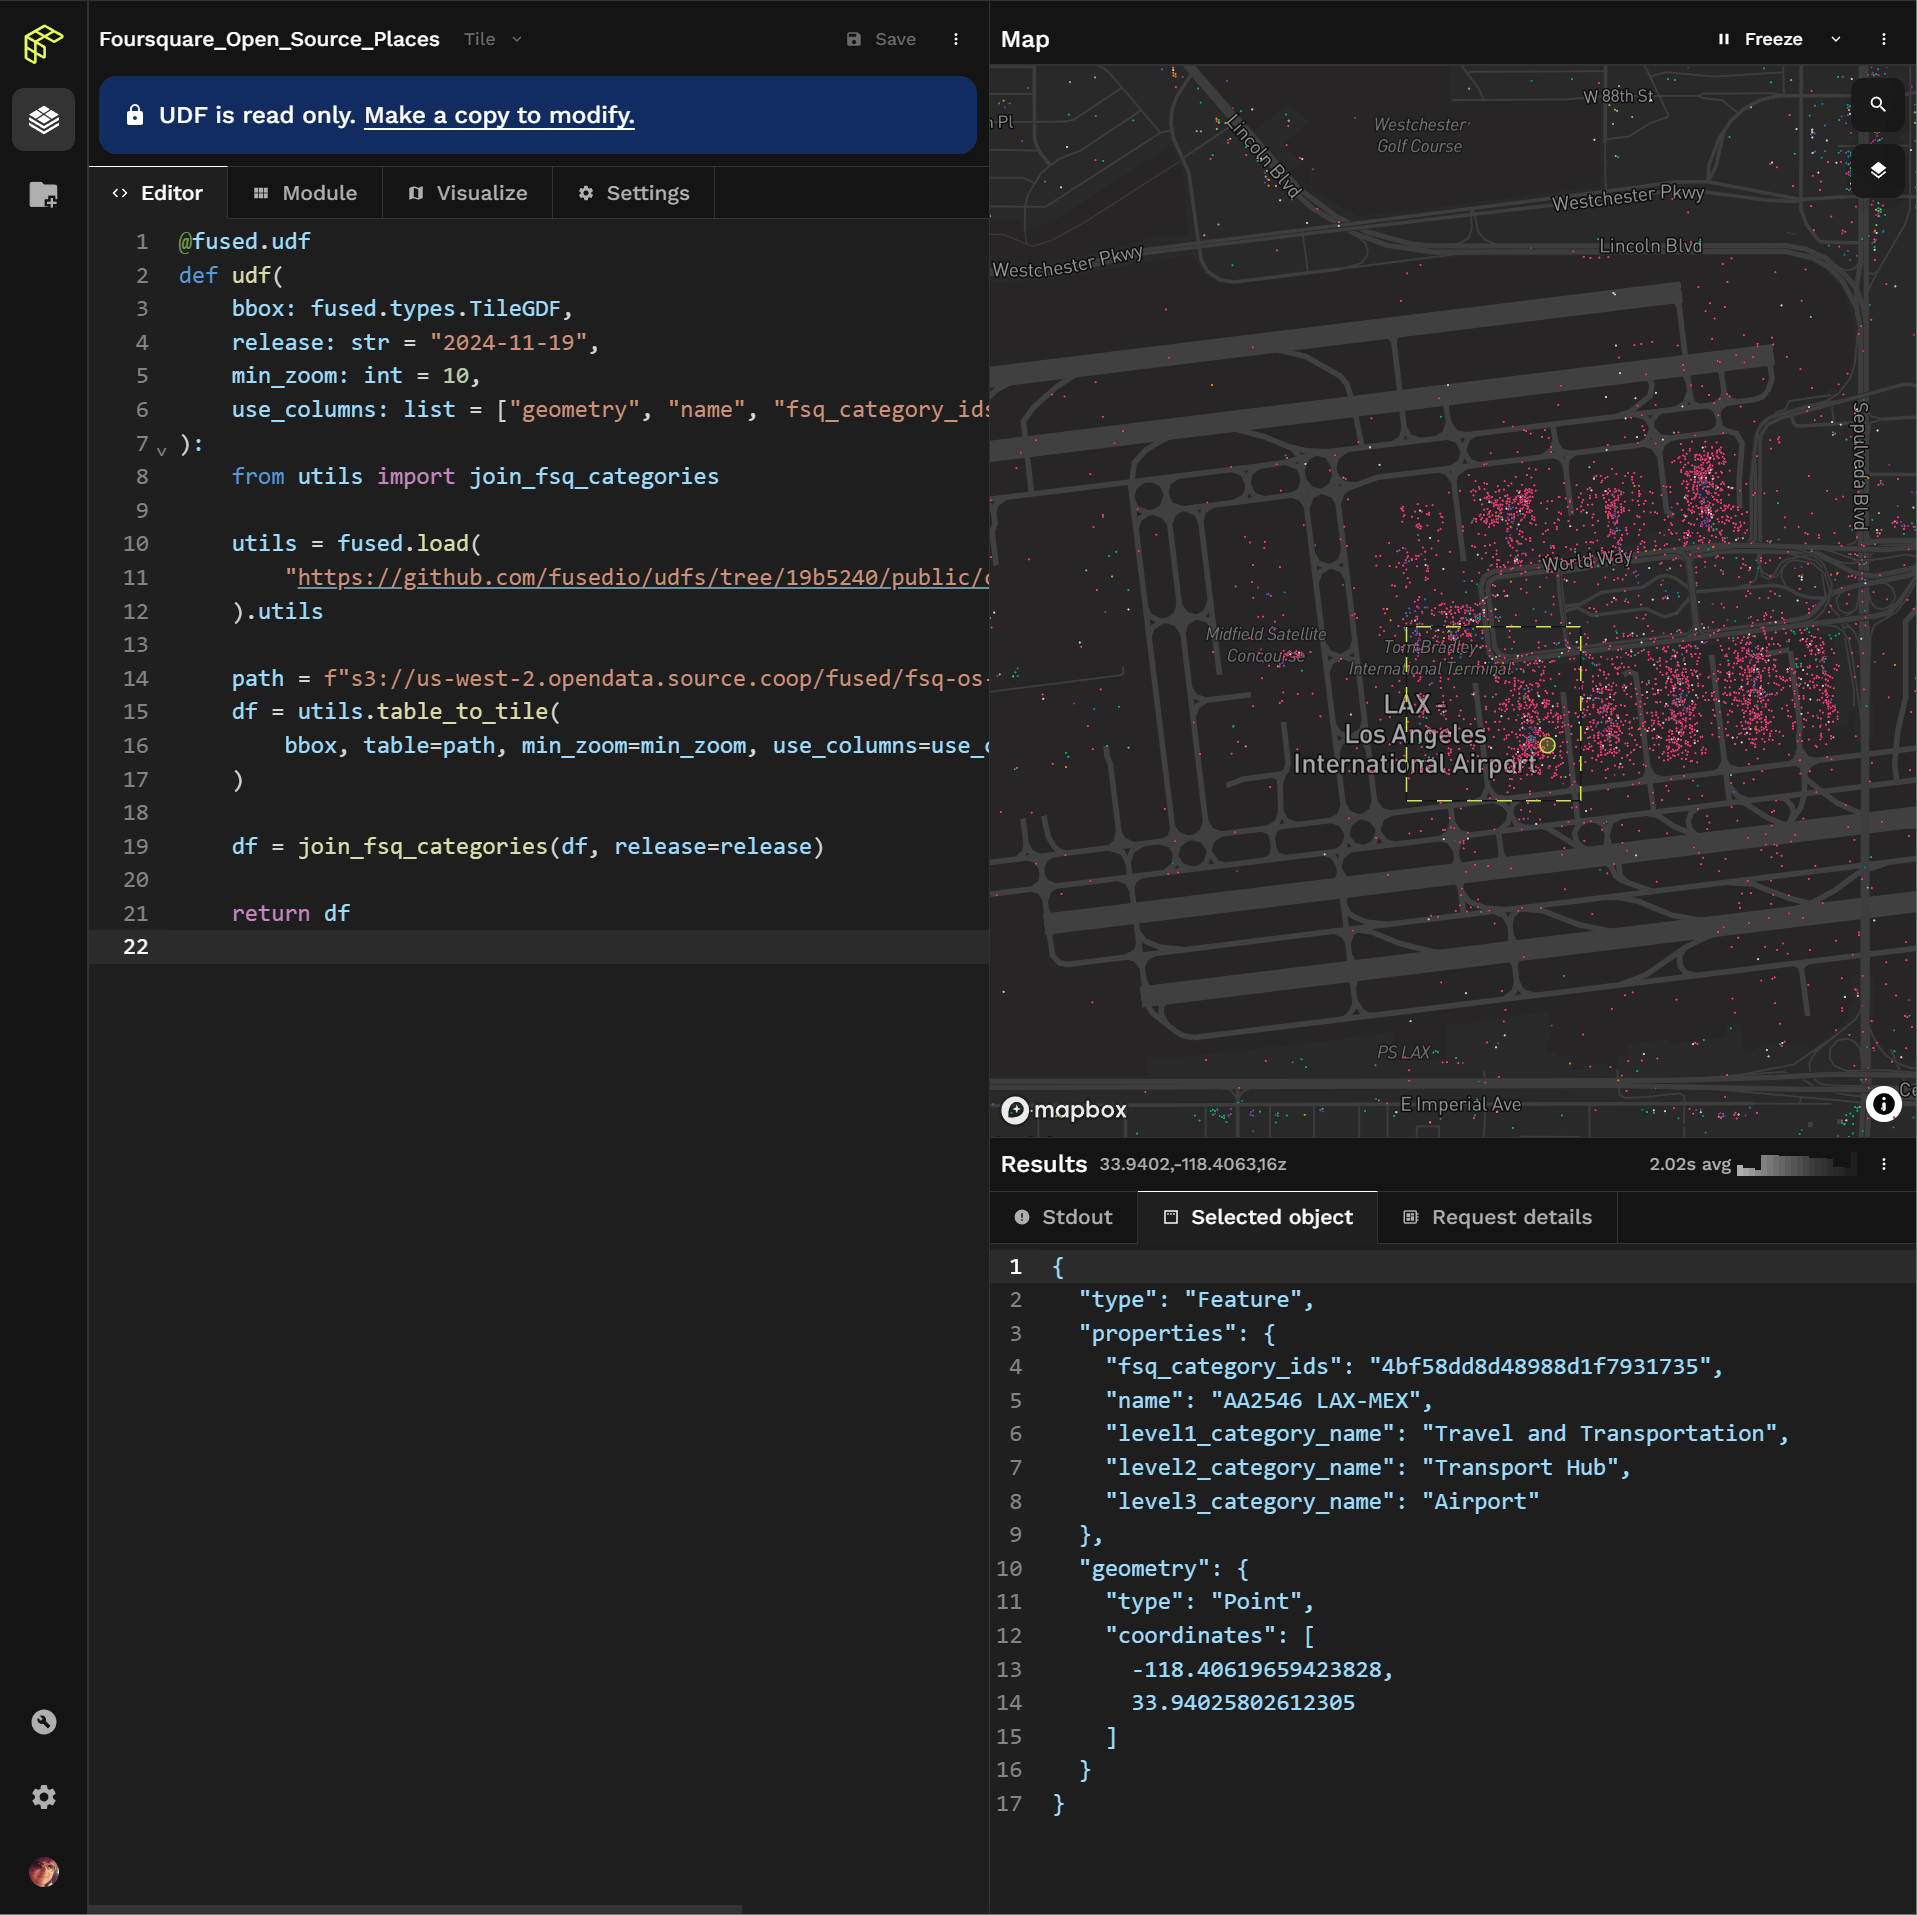
I'd like to thank Sina Kashuk for publishing Foursquare's POI dataset to the Source Cooperative site. I'd also like to thank his co-founder Isaac Brodsky for granting me access to their geospatial computing platform Fused. It helped build fluency in this dataset while I was preparing this post.
My Workstation
I'm using a 6 GHz Intel Core i9-14900K CPU. It has 8 performance cores and 16 efficiency cores with a total of 32 threads and 32 MB of L2 cache. It has a liquid cooler attached and is housed in a spacious, full-sized, Cooler Master HAF 700 computer case. I've come across videos on YouTube where people have managed to overclock the i9-14900KF to 9.1 GHz.
The system has 96 GB of DDR5 RAM clocked at 6,000 MT/s and a 5th-generation, Crucial T700 4 TB NVMe M.2 SSD which can read at speeds up to 12,400 MB/s. There is a heatsink on the SSD to help keep its temperature down. This is my system's C drive.
The system is powered by a 1,200-watt, fully modular, Corsair Power Supply and is sat on an ASRock Z790 Pro RS Motherboard.
I'm running Ubuntu 22 LTS via Microsoft's Ubuntu for Windows on Windows 11 Pro. In case you're wondering why I don't run a Linux-based desktop as my primary work environment, I'm still using an Nvidia GTX 1080 GPU which has better driver support on Windows and I use ArcGIS Pro from time to time which only supports Windows natively.
Installing Prerequisites
I'll use a few tools to help prepare and visualise the data in this post.
$ sudo apt update
$ sudo apt install \
    awscli \
    jq
I'll use DuckDB, along with its H3, JSON, Lindel, Parquet and Spatial extensions, in this post.
$ cd ~
$ wget -c https://github.com/duckdb/duckdb/releases/download/v1.1.3/duckdb_cli-linux-amd64.zip
$ unzip -j duckdb_cli-linux-amd64.zip
$ chmod +x duckdb
$ ~/duckdb
INSTALL h3 FROM community;
INSTALL lindel FROM community;
INSTALL json;
INSTALL parquet;
INSTALL spatial;
I'll set up DuckDB to load every installed extension each time it launches.
$ vi ~/.duckdbrc
.timer on
.width 180
LOAD h3;
LOAD lindel;
LOAD json;
LOAD parquet;
LOAD spatial;
The maps in this post were rendered with QGIS version 3.40. QGIS is a desktop application that runs on Windows, macOS and Linux. The application has grown in popularity in recent years and has ~15M application launches from users all around the world each month.
I used QGIS' Tile+ plugin to add geospatial context with Esri's World Imagery Basemap. The dark, non-satellite imagery maps are mostly made up of vector data from Natural Earth and Overture.
Downloading Foursquare's POIs
The following will download 11 GB of Parquet files.
$ aws s3 sync \
    s3://fused/fsq-os-places/ \
    ~/pois \
    --endpoint-url=https://data.source.coop
This dataset will be refreshed monthly so expect the disk space requirements to grow by ~11 GB each month as time goes on.
Data Fluency
Below is an example record from this dataset.
$ cd ~/pois/2024-11-19/places/

$ echo "SELECT *
        FROM   READ_PARQUET('*.parquet')
        WHERE  country = 'EE'
        LIMIT  1" \
    | ~/duckdb -json \
    | jq -S .
[
  {
    "address": null,
    "admin_region": null,
    "country": "EE",
    "date_closed": null,
    "date_created": "2011-06-11",
    "date_refreshed": "2020-11-30",
    "email": null,
    "facebook_id": null,
    "fsq_category_ids": "[4bf58dd8d48988d16d941735]",
    "fsq_category_labels": "[Dining and Drinking > Cafe, Coffee, and Tea House > Café]",
    "fsq_place_id": "4df395c46284fefe8fc2cac4",
    "geometry": "POINT (22.486121923982086 58.252406944851465)",
    "instagram": null,
    "latitude": 58.252406944851465,
    "locality": "Kuressaare",
    "longitude": 22.486121923982086,
    "name": "Kohvik Tareke",
    "po_box": null,
    "post_town": null,
    "postcode": null,
    "region": null,
    "tel": null,
    "twitter": null,
    "website": null
  }
]
There are over 104M records in total.
$ ~/duckdb
SELECT COUNT(*)
FROM   READ_PARQUET('*.parquet'); -- 104,181,215
Most columns are well populated. Only eight columns have an 85%+ NULL rate.
SELECT   column_name,
         column_type,
         null_percentage,
         approx_unique
FROM     (SUMMARIZE
          FROM READ_PARQUET('*.parquet'))
ORDER BY 1;
┌─────────────────────┬─────────────┬─────────────────┬───────────────┐
│     column_name     │ column_type │ null_percentage │ approx_unique │
│       varchar       │   varchar   │  decimal(9,2)   │     int64     │
├─────────────────────┼─────────────┼─────────────────┼───────────────┤
│ address             │ VARCHAR     │           35.71 │      50549830 │
│ admin_region        │ VARCHAR     │           90.16 │           185 │
│ country             │ VARCHAR     │            0.02 │           242 │
│ date_closed         │ VARCHAR     │           94.18 │          5074 │
│ date_created        │ VARCHAR     │            0.00 │          6146 │
│ date_refreshed      │ VARCHAR     │            0.00 │          1939 │
│ email               │ VARCHAR     │           88.78 │       9451926 │
│ facebook_id         │ BIGINT      │           93.29 │       5827724 │
│ fsq_category_ids    │ VARCHAR[]   │           11.06 │        608378 │
│ fsq_category_labels │ VARCHAR[]   │           11.06 │        461277 │
│ fsq_place_id        │ VARCHAR     │            0.00 │     115532409 │
│ geometry            │ GEOMETRY    │            0.00 │      97030828 │
│ instagram           │ VARCHAR     │           98.91 │        413585 │
│ latitude            │ DOUBLE      │            0.00 │      87959408 │
│ locality            │ VARCHAR     │           27.96 │       1370111 │
│ longitude           │ DOUBLE      │            0.00 │      83434671 │
│ name                │ VARCHAR     │            0.00 │      75651468 │
│ po_box              │ VARCHAR     │           99.71 │         46682 │
│ post_town           │ VARCHAR     │           97.43 │         10740 │
│ postcode            │ VARCHAR     │           45.32 │       2799572 │
│ region              │ VARCHAR     │           32.61 │        294146 │
│ tel                 │ VARCHAR     │           54.30 │      38456652 │
│ twitter             │ VARCHAR     │           95.38 │       1632976 │
│ website             │ VARCHAR     │           69.41 │      18694432 │
├─────────────────────┴─────────────┴─────────────────┴───────────────┤
│ 24 rows                                                   4 columns │
└─────────────────────────────────────────────────────────────────────┘
Refresh Rate
Almost all records that haven't been closed have been refreshed at least once.
SELECT   date_refreshed IS NULL,
         COUNT(*) num_recs
FROM     READ_PARQUET('*.parquet')
WHERE    date_closed IS NULL
GROUP BY 1;
┌──────────────────────────┬──────────┐
│ (date_refreshed IS NULL) │ num_recs │
│         boolean          │  int64   │
├──────────────────────────┼──────────┤
│ true                     │     3035 │
│ false                    │ 98109821 │
└──────────────────────────┴──────────┘
The records can originate from as early as the early 2000s. The latest wave of refreshes looks to have kicked off around the start of the 2020s.
WITH a AS (
    SELECT   DATE_PART('year', date_created::DATE) created_at,
             DATE_PART('year', date_refreshed::DATE) refreshed_at,
             COUNT(*) num_recs
    FROM     READ_PARQUET('*.parquet')
    WHERE    date_closed  IS NULL
    AND      refreshed_at IS NOT NULL
    GROUP BY created_at,
             refreshed_at
    ORDER BY created_at
)
PIVOT    a
ON       created_at
USING    SUM(num_recs)
GROUP BY refreshed_at
ORDER BY refreshed_at;
┌──────────────┬────────┬────────┬────────┬────────┬────────┬────────┬────────┬─────────┬─────────┬─────────┬─────────┬─────────┬─────────┬─────────┬─────────┬─────────┬─────────┬─────────┬─────────┬─────────┬────────┬────────┐
│ refreshed_at │  2003  │  2004  │  2005  │  2006  │  2007  │  2008  │  2009  │  2010   │  2011   │  2012   │  2013   │  2014   │  2015   │  2016   │  2017   │  2018   │  2019   │  2020   │  2021   │  2022   │  2023  │  2024  │
│    int64     │ int128 │ int128 │ int128 │ int128 │ int128 │ int128 │ int128 │ int128  │ int128  │ int128  │ int128  │ int128  │ int128  │ int128  │ int128  │ int128  │ int128  │ int128  │ int128  │ int128  │ int128 │ int128 │
├──────────────┼────────┼────────┼────────┼────────┼────────┼────────┼────────┼─────────┼─────────┼─────────┼─────────┼─────────┼─────────┼─────────┼─────────┼─────────┼─────────┼─────────┼─────────┼─────────┼────────┼────────┤
│         2011 │        │        │        │        │        │        │        │         │         │         │         │         │         │         │         │         │         │         │       1 │       3 │      3 │      6 │
│         2012 │        │        │        │        │        │        │        │         │         │         │         │         │         │         │         │         │         │         │       1 │      12 │     13 │     13 │
│         2013 │        │        │        │        │        │        │        │         │         │         │         │         │         │         │         │         │         │         │       3 │       6 │      6 │      9 │
│         2014 │        │        │        │        │        │        │        │         │         │         │         │         │         │         │         │         │         │         │       4 │      10 │      7 │      7 │
│         2015 │        │        │        │        │        │        │        │         │         │         │         │         │         │         │         │         │         │         │       1 │       2 │      1 │      1 │
│         2016 │        │        │        │        │        │        │        │         │         │      31 │         │         │         │         │         │         │         │         │     325 │       8 │      6 │     54 │
│         2017 │        │        │        │        │        │        │        │         │         │       1 │         │         │         │         │         │         │         │         │      67 │       3 │      5 │      6 │
│         2018 │        │        │        │        │        │        │        │         │         │         │         │         │         │         │         │         │         │         │      44 │       3 │      3 │      5 │
│         2019 │        │        │        │        │        │        │        │         │         │       1 │         │         │         │         │         │         │         │         │      30 │       1 │      3 │      7 │
│         2020 │      9 │     40 │      8 │     12 │      4 │      3 │   3905 │  787120 │ 2408413 │ 3455608 │ 3312186 │ 2560600 │ 2879241 │ 2858679 │ 1137947 │  716744 │  554800 │  357426 │     123 │       4 │      2 │      3 │
│         2021 │     37 │     94 │     15 │     26 │     17 │      8 │   7439 │  397054 │ 1023349 │ 1658742 │ 1522447 │ 1086594 │  823775 │  726749 │  303669 │  209804 │  180078 │  126662 │  504691 │         │        │        │
│         2022 │      1 │      3 │      2 │      3 │      2 │        │    634 │   31446 │   49032 │   48913 │   37223 │   24045 │   18762 │   19578 │   15099 │   15739 │   18226 │   15457 │   26488 │  527968 │        │        │
│         2023 │     38 │    170 │     54 │    110 │     62 │     29 │   9396 │  846686 │  706885 │  927311 │ 1514473 │ 1089891 │ 1373265 │  631681 │  371861 │  256172 │  295953 │  198415 │  248074 │  201509 │ 949102 │     10 │
│         2024 │   1557 │   5054 │   1702 │   2599 │   1699 │    730 │ 219628 │ 7902534 │ 8130792 │ 9025584 │ 6878121 │ 5641573 │ 4765660 │ 3184691 │ 2289962 │ 1763496 │ 1765435 │ 1600415 │ 1591532 │ 1403804 │ 862373 │ 996253 │
├──────────────┴────────┴────────┴────────┴────────┴────────┴────────┴────────┴─────────┴─────────┴─────────┴─────────┴─────────┴─────────┴─────────┴─────────┴─────────┴─────────┴─────────┴─────────┴─────────┴────────┴────────┤
│ 14 rows                                                                                                                                                                                                              23 columns │
└─────────────────────────────────────────────────────────────────────────────────────────────────────────────────────────────────────────────────────────────────────────────────────────────────────────────────────────────────┘
There are updates every day of the week with a bias towards the early part of the business week and this falls off on the weekends.
SELECT   STRFTIME(date_refreshed::DATE, '%u (%a)') AS day_num,
         COUNT(*) num_recs
FROM     READ_PARQUET('*.parquet')
WHERE    date_closed IS NULL
AND      day_num     IS NOT NULL
GROUP BY day_num
ORDER BY day_num;
┌─────────┬──────────┐
│ day_num │ num_recs │
│ varchar │  int64   │
├─────────┼──────────┤
│ 1 (Mon) │ 19770904 │
│ 2 (Tue) │ 23514624 │
│ 3 (Wed) │ 21284215 │
│ 4 (Thu) │ 11121484 │
│ 5 (Fri) │  9070973 │
│ 6 (Sat) │  6813559 │
│ 7 (Sun) │  6534062 │
└─────────┴──────────┘
253 Countries
There are 253 countries represented in this dataset.
$ ~/duckdb
SELECT COUNT(DISTINCT country)
FROM   READ_PARQUET('*.parquet'); -- 253
The US has ~23.5M records followed by Indonesia and Turkey with over 8M each.
.maxrows 20

SELECT country,
       COUNT(*) num_recs
FROM   READ_PARQUET('*.parquet')
GROUP BY 1
ORDER BY 2 DESC;
┌─────────┬──────────┐
│ country │ num_recs │
│ varchar │  int64   │
├─────────┼──────────┤
│ US      │ 23481388 │
│ ID      │  8567041 │
│ TR      │  8077069 │
│ BR      │  5206462 │
│ DE      │  4955682 │
│ JP      │  4767710 │
│ GB      │  4098159 │
│ RU      │  3067249 │
│ FR      │  3060670 │
│ MX      │  2820025 │
│ ·       │        · │
│ ·       │        · │
│ ·       │        · │
│ IO      │       63 │
│ WF      │       55 │
│ UM      │       53 │
│ HM      │       43 │
│ CC      │       35 │
│ AN      │       33 │
│ TK      │       22 │
│ PN      │       15 │
│ BV      │       12 │
│ PZ      │        1 │
├─────────┴──────────┤
│      254 rows      │
│     (20 shown)     │
└────────────────────┘
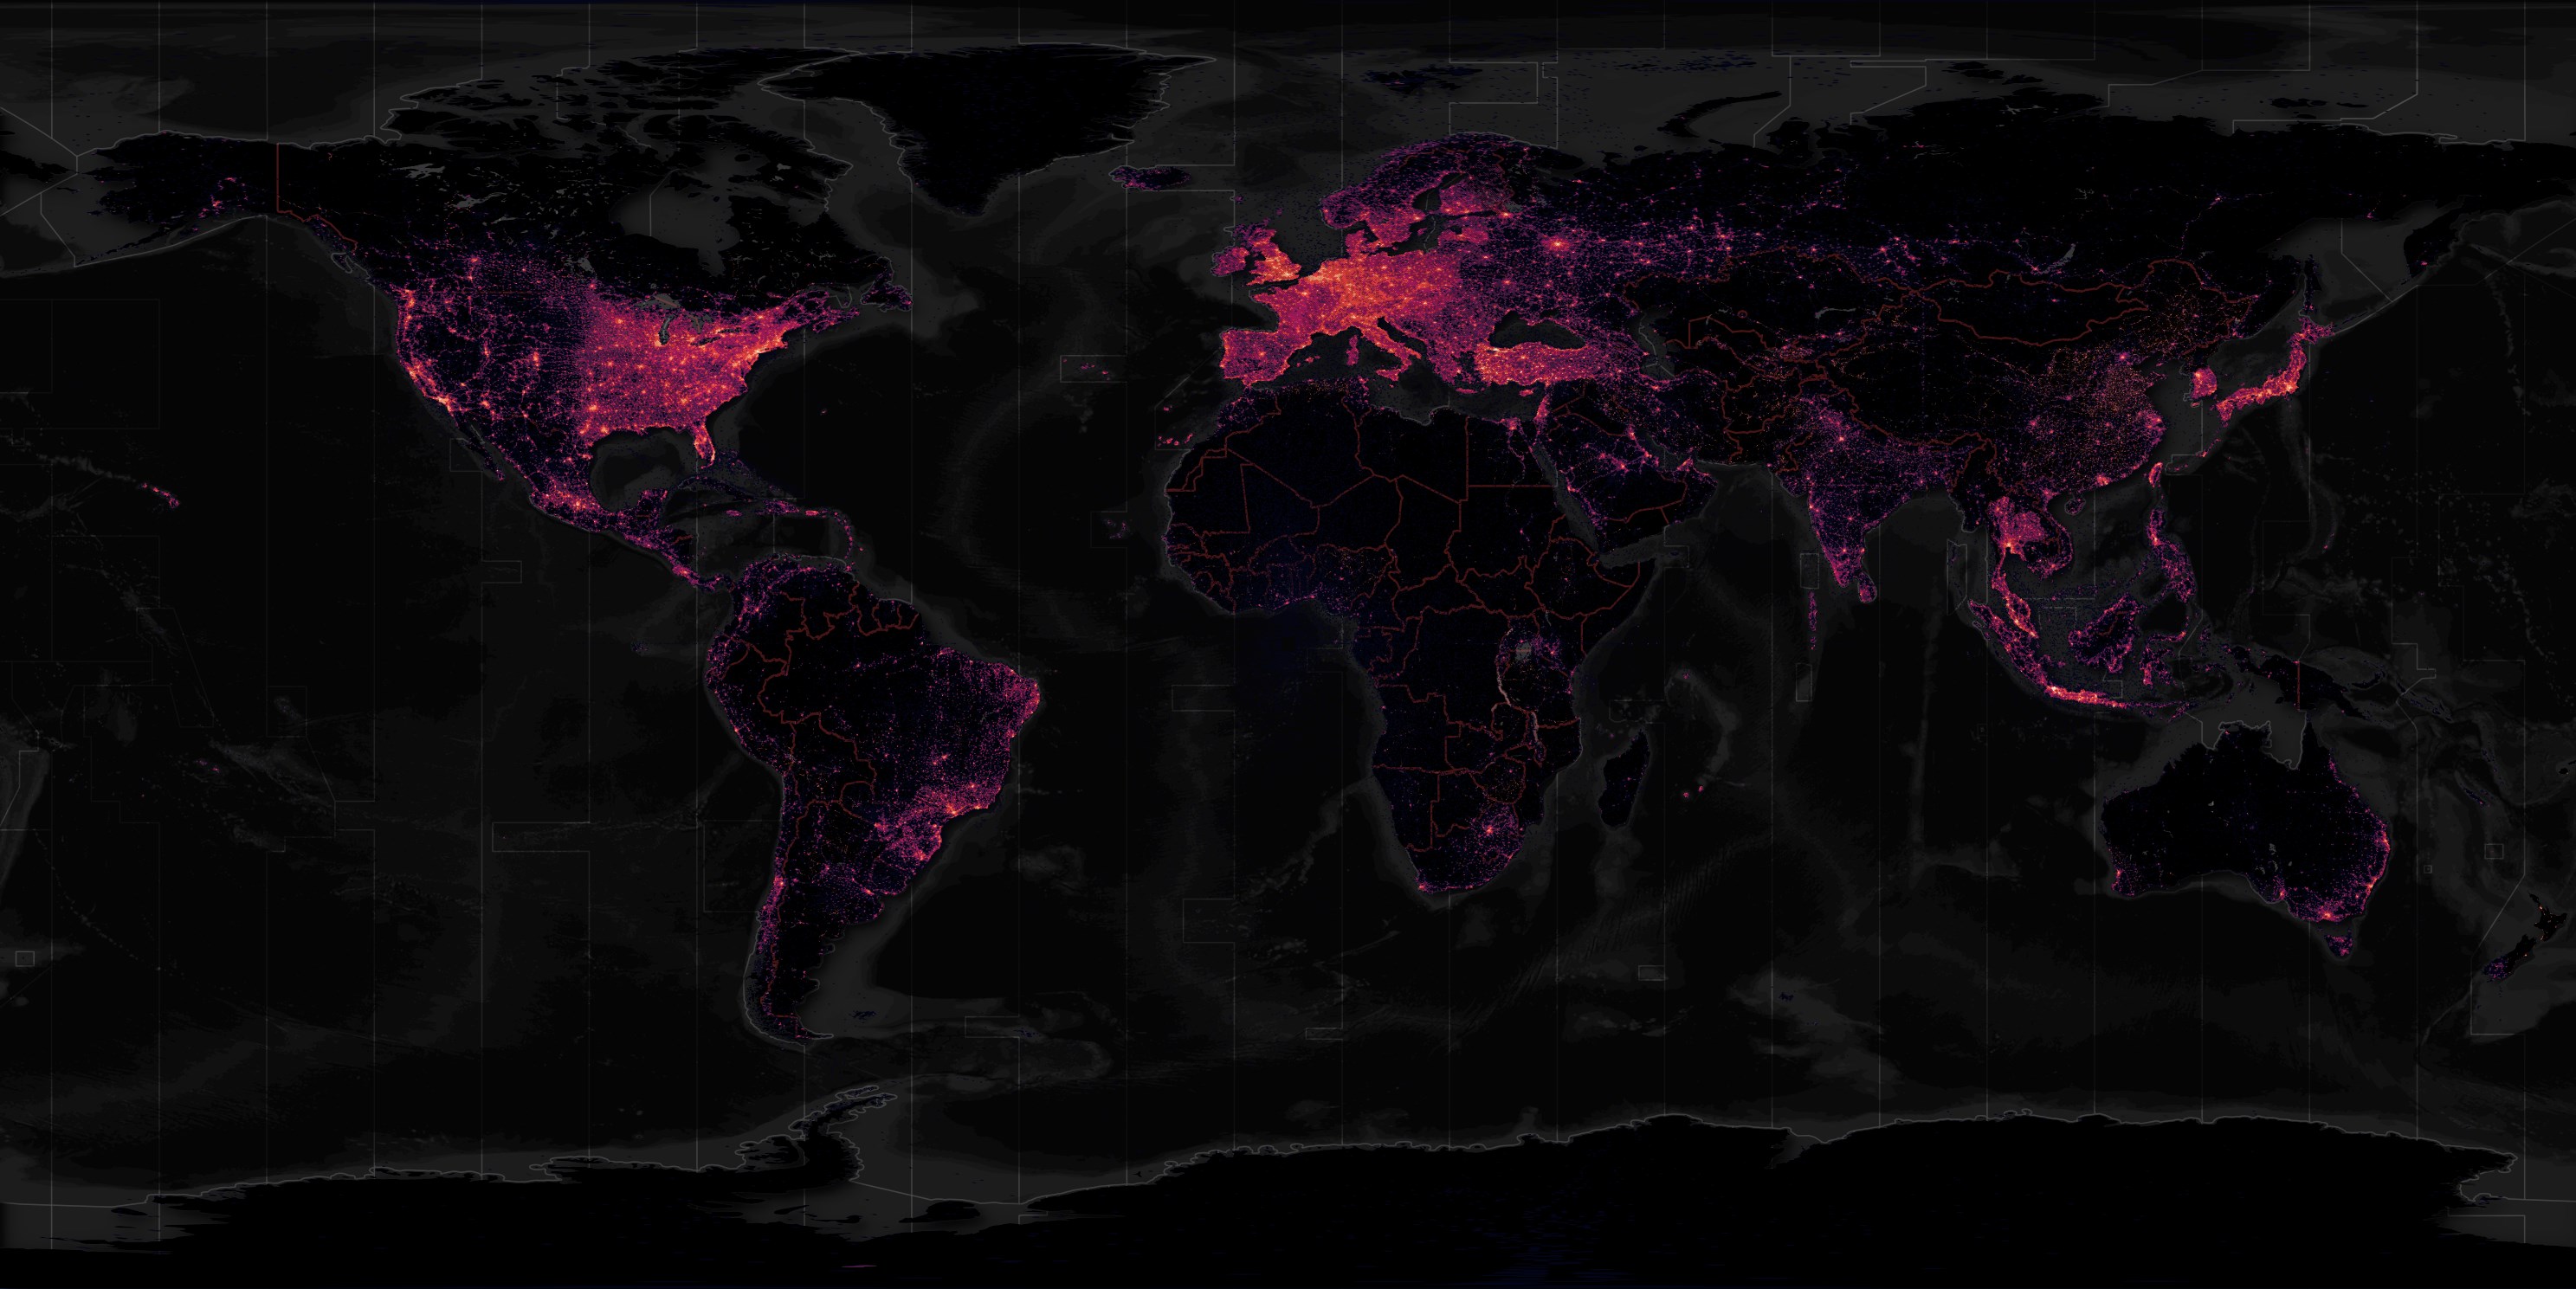
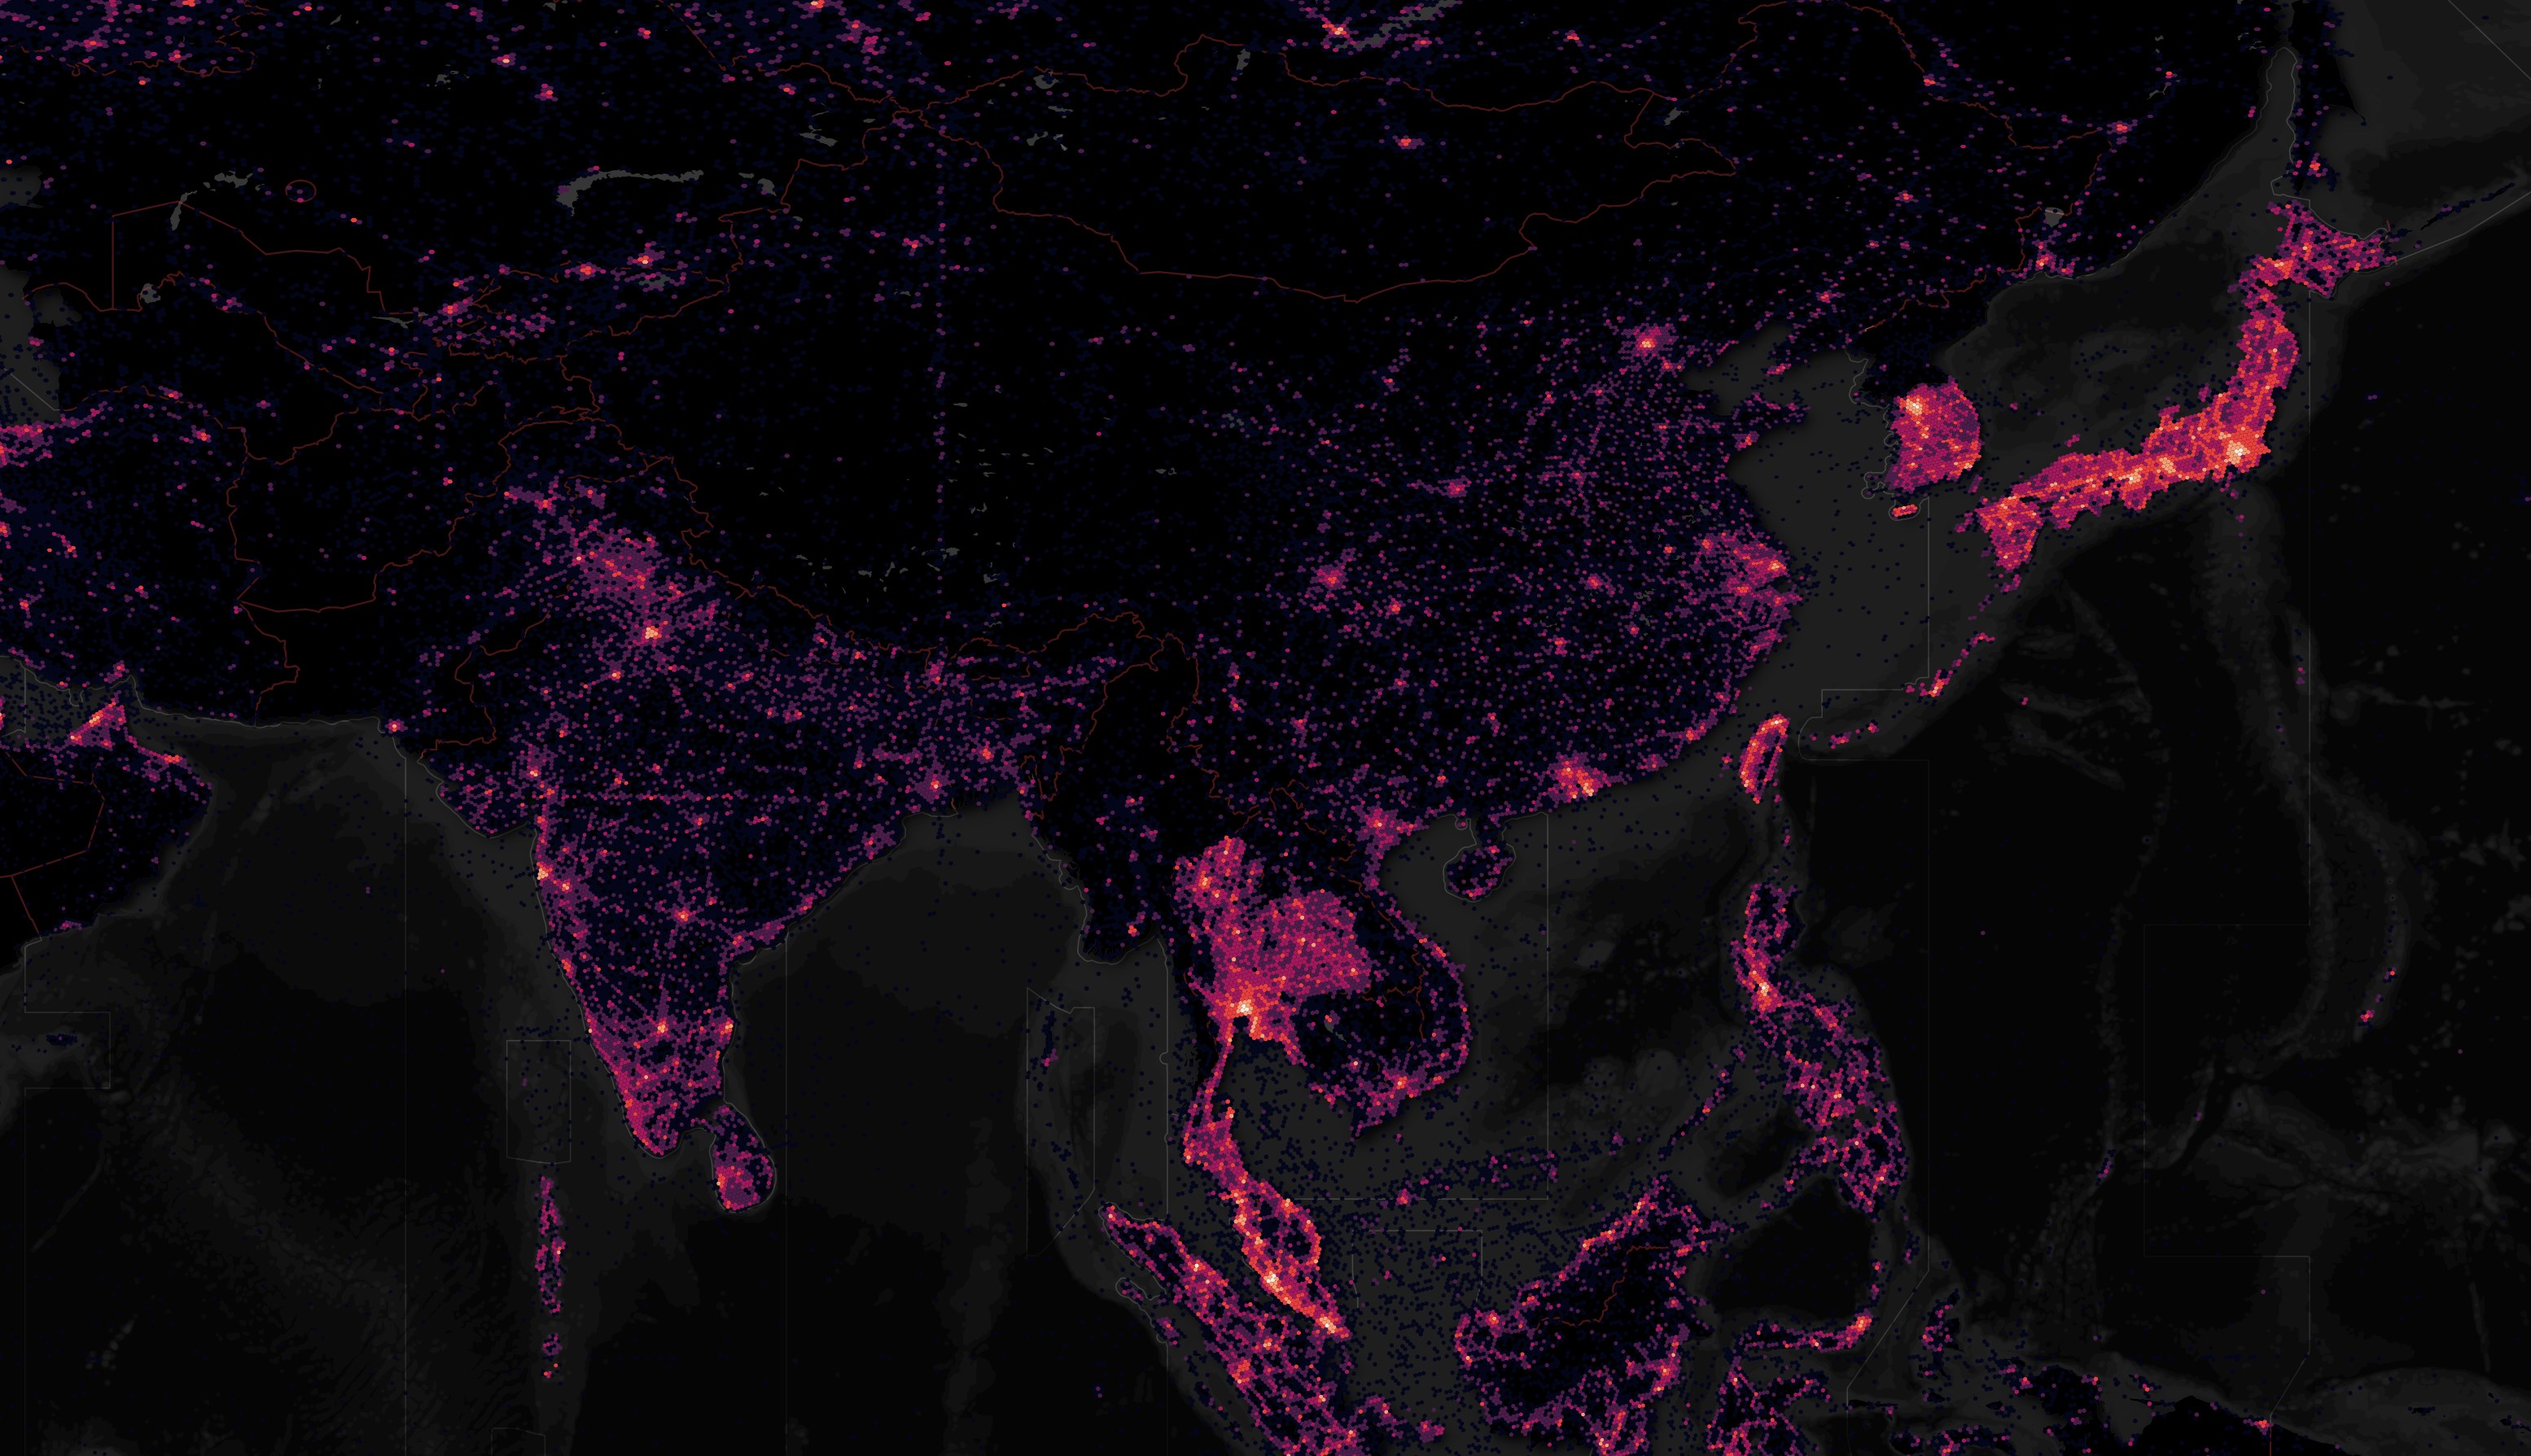
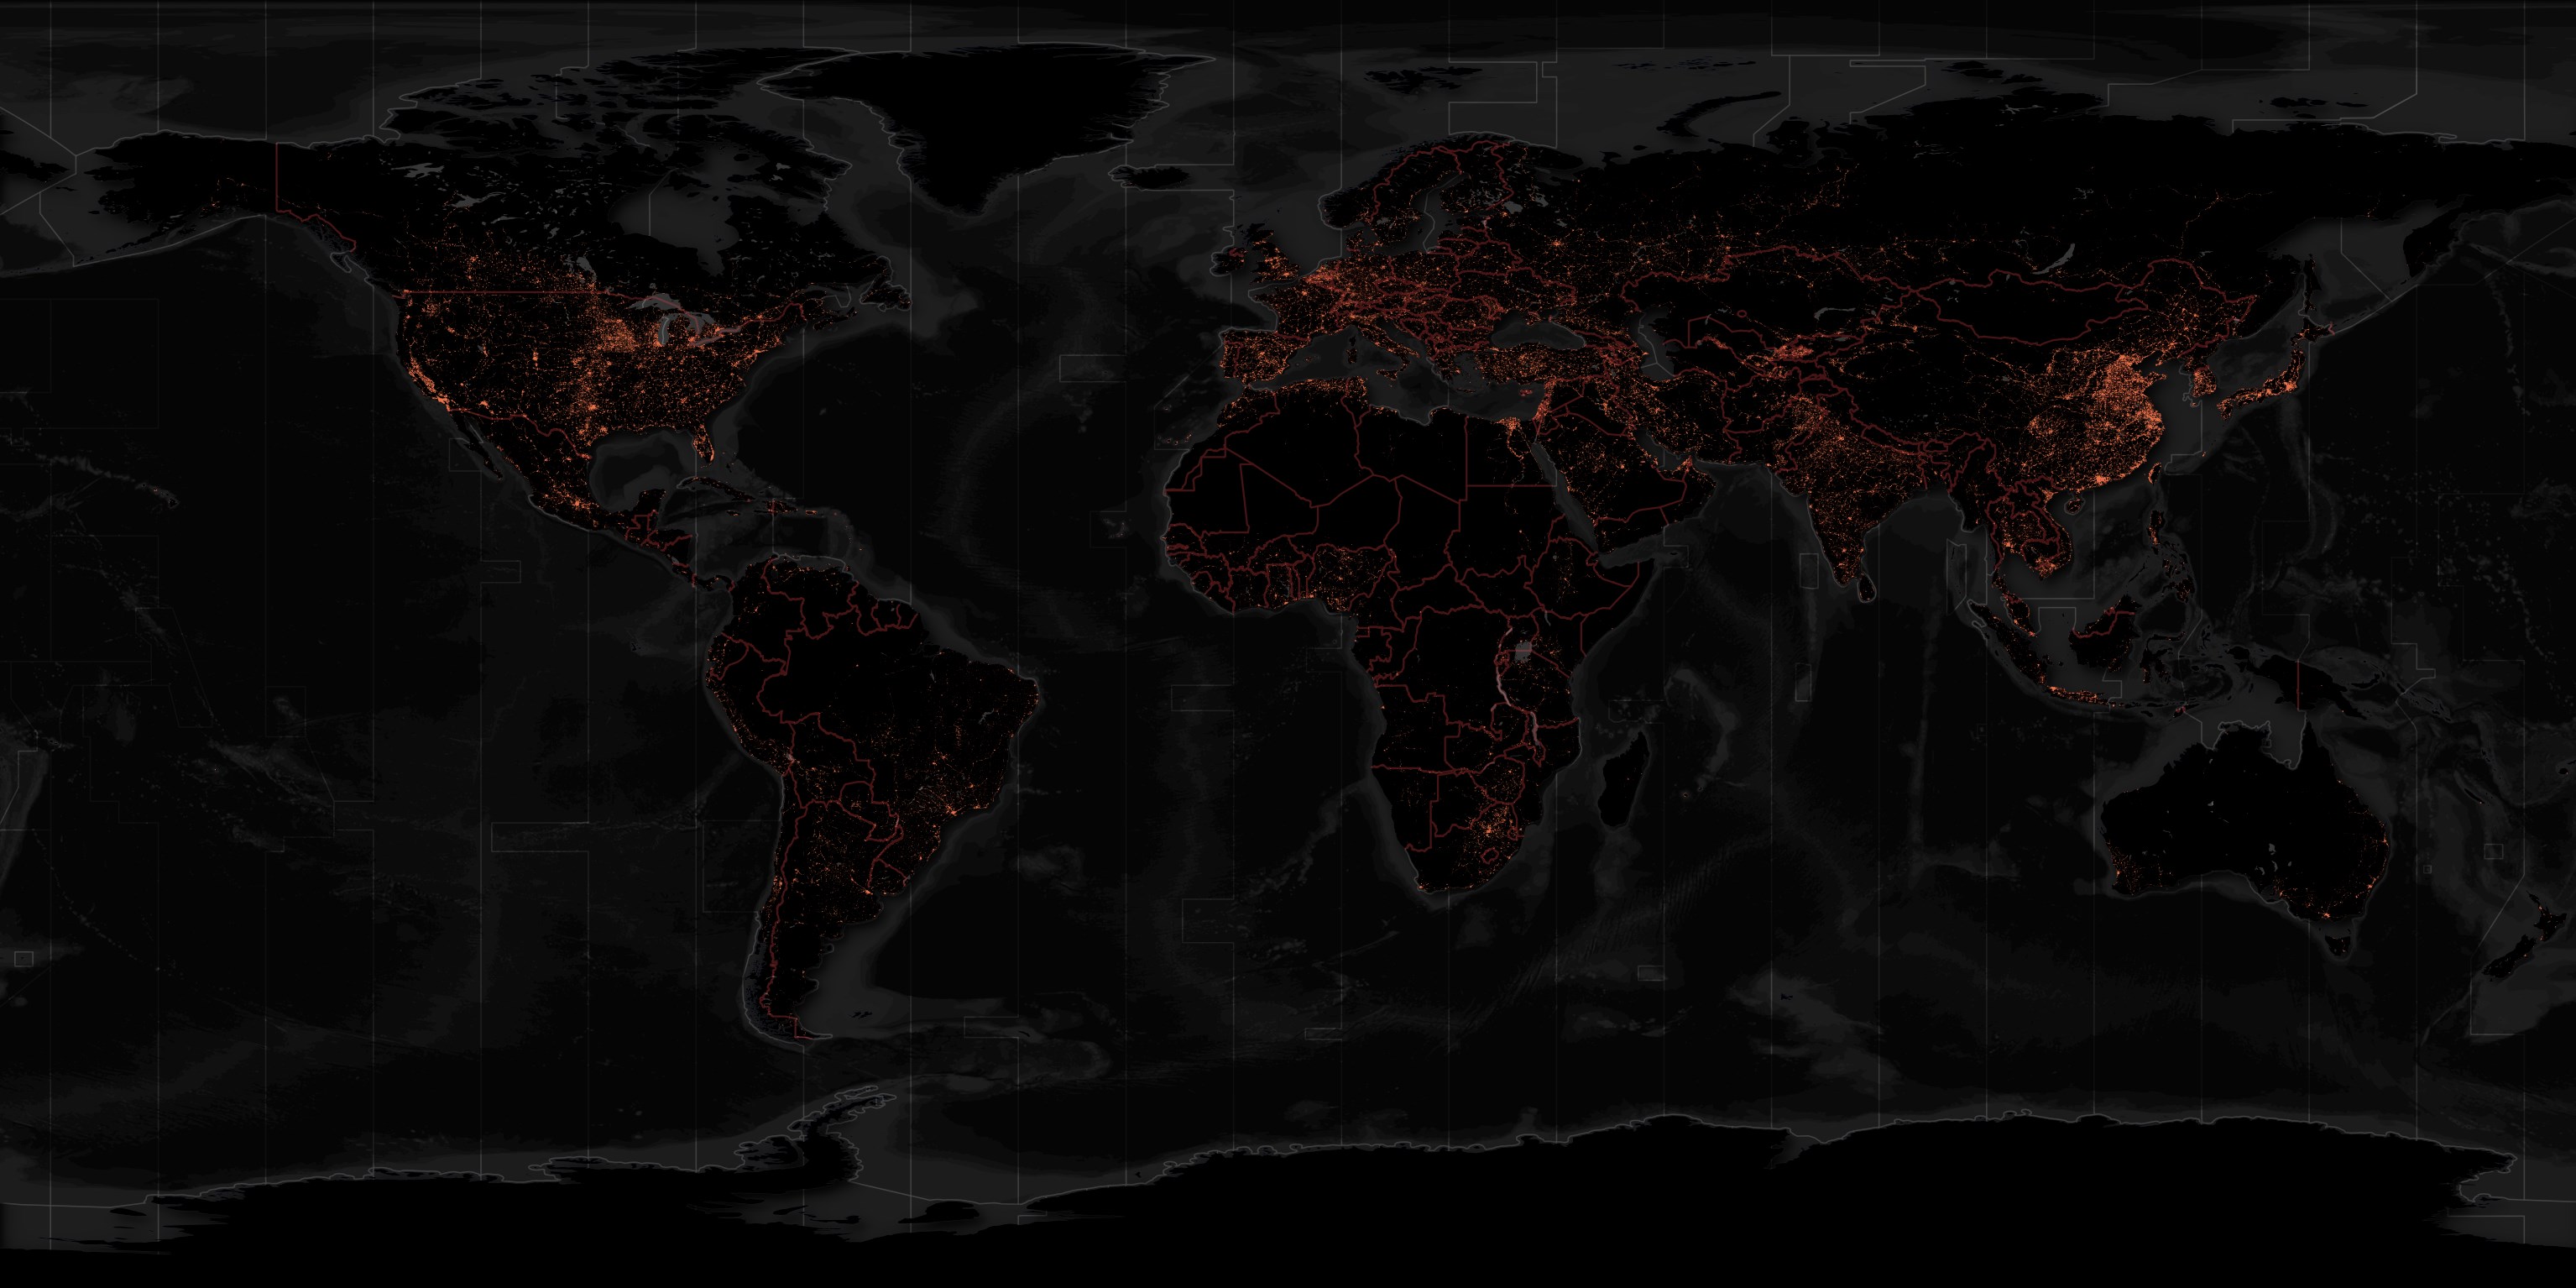
This is a heatmap showing where the highest densities of POIs are located.
$ ~/duckdb
COPY (
    SELECT   H3_CELL_TO_BOUNDARY_WKT(
                  H3_LATLNG_TO_CELL(latitude,
                                    longitude,
                                    5))::geometry geom,
             COUNT(*) AS num_recs
    FROM     READ_PARQUET('*.parquet')
    WHERE    longitude < 170
    AND      longitude > -170
    AND      latitude IS NOT NULL
    GROUP BY 1
) TO 'fsq.pois.h3_5.gpkg'
    WITH (FORMAT GDAL,
          DRIVER 'GPKG',
          LAYER_CREATION_OPTIONS 'WRITE_BBOX=YES');
The heatmap across Europe matches population densities well. But if you look at the Red Sea closely you'll find there are a lot of POIs over water bodies.
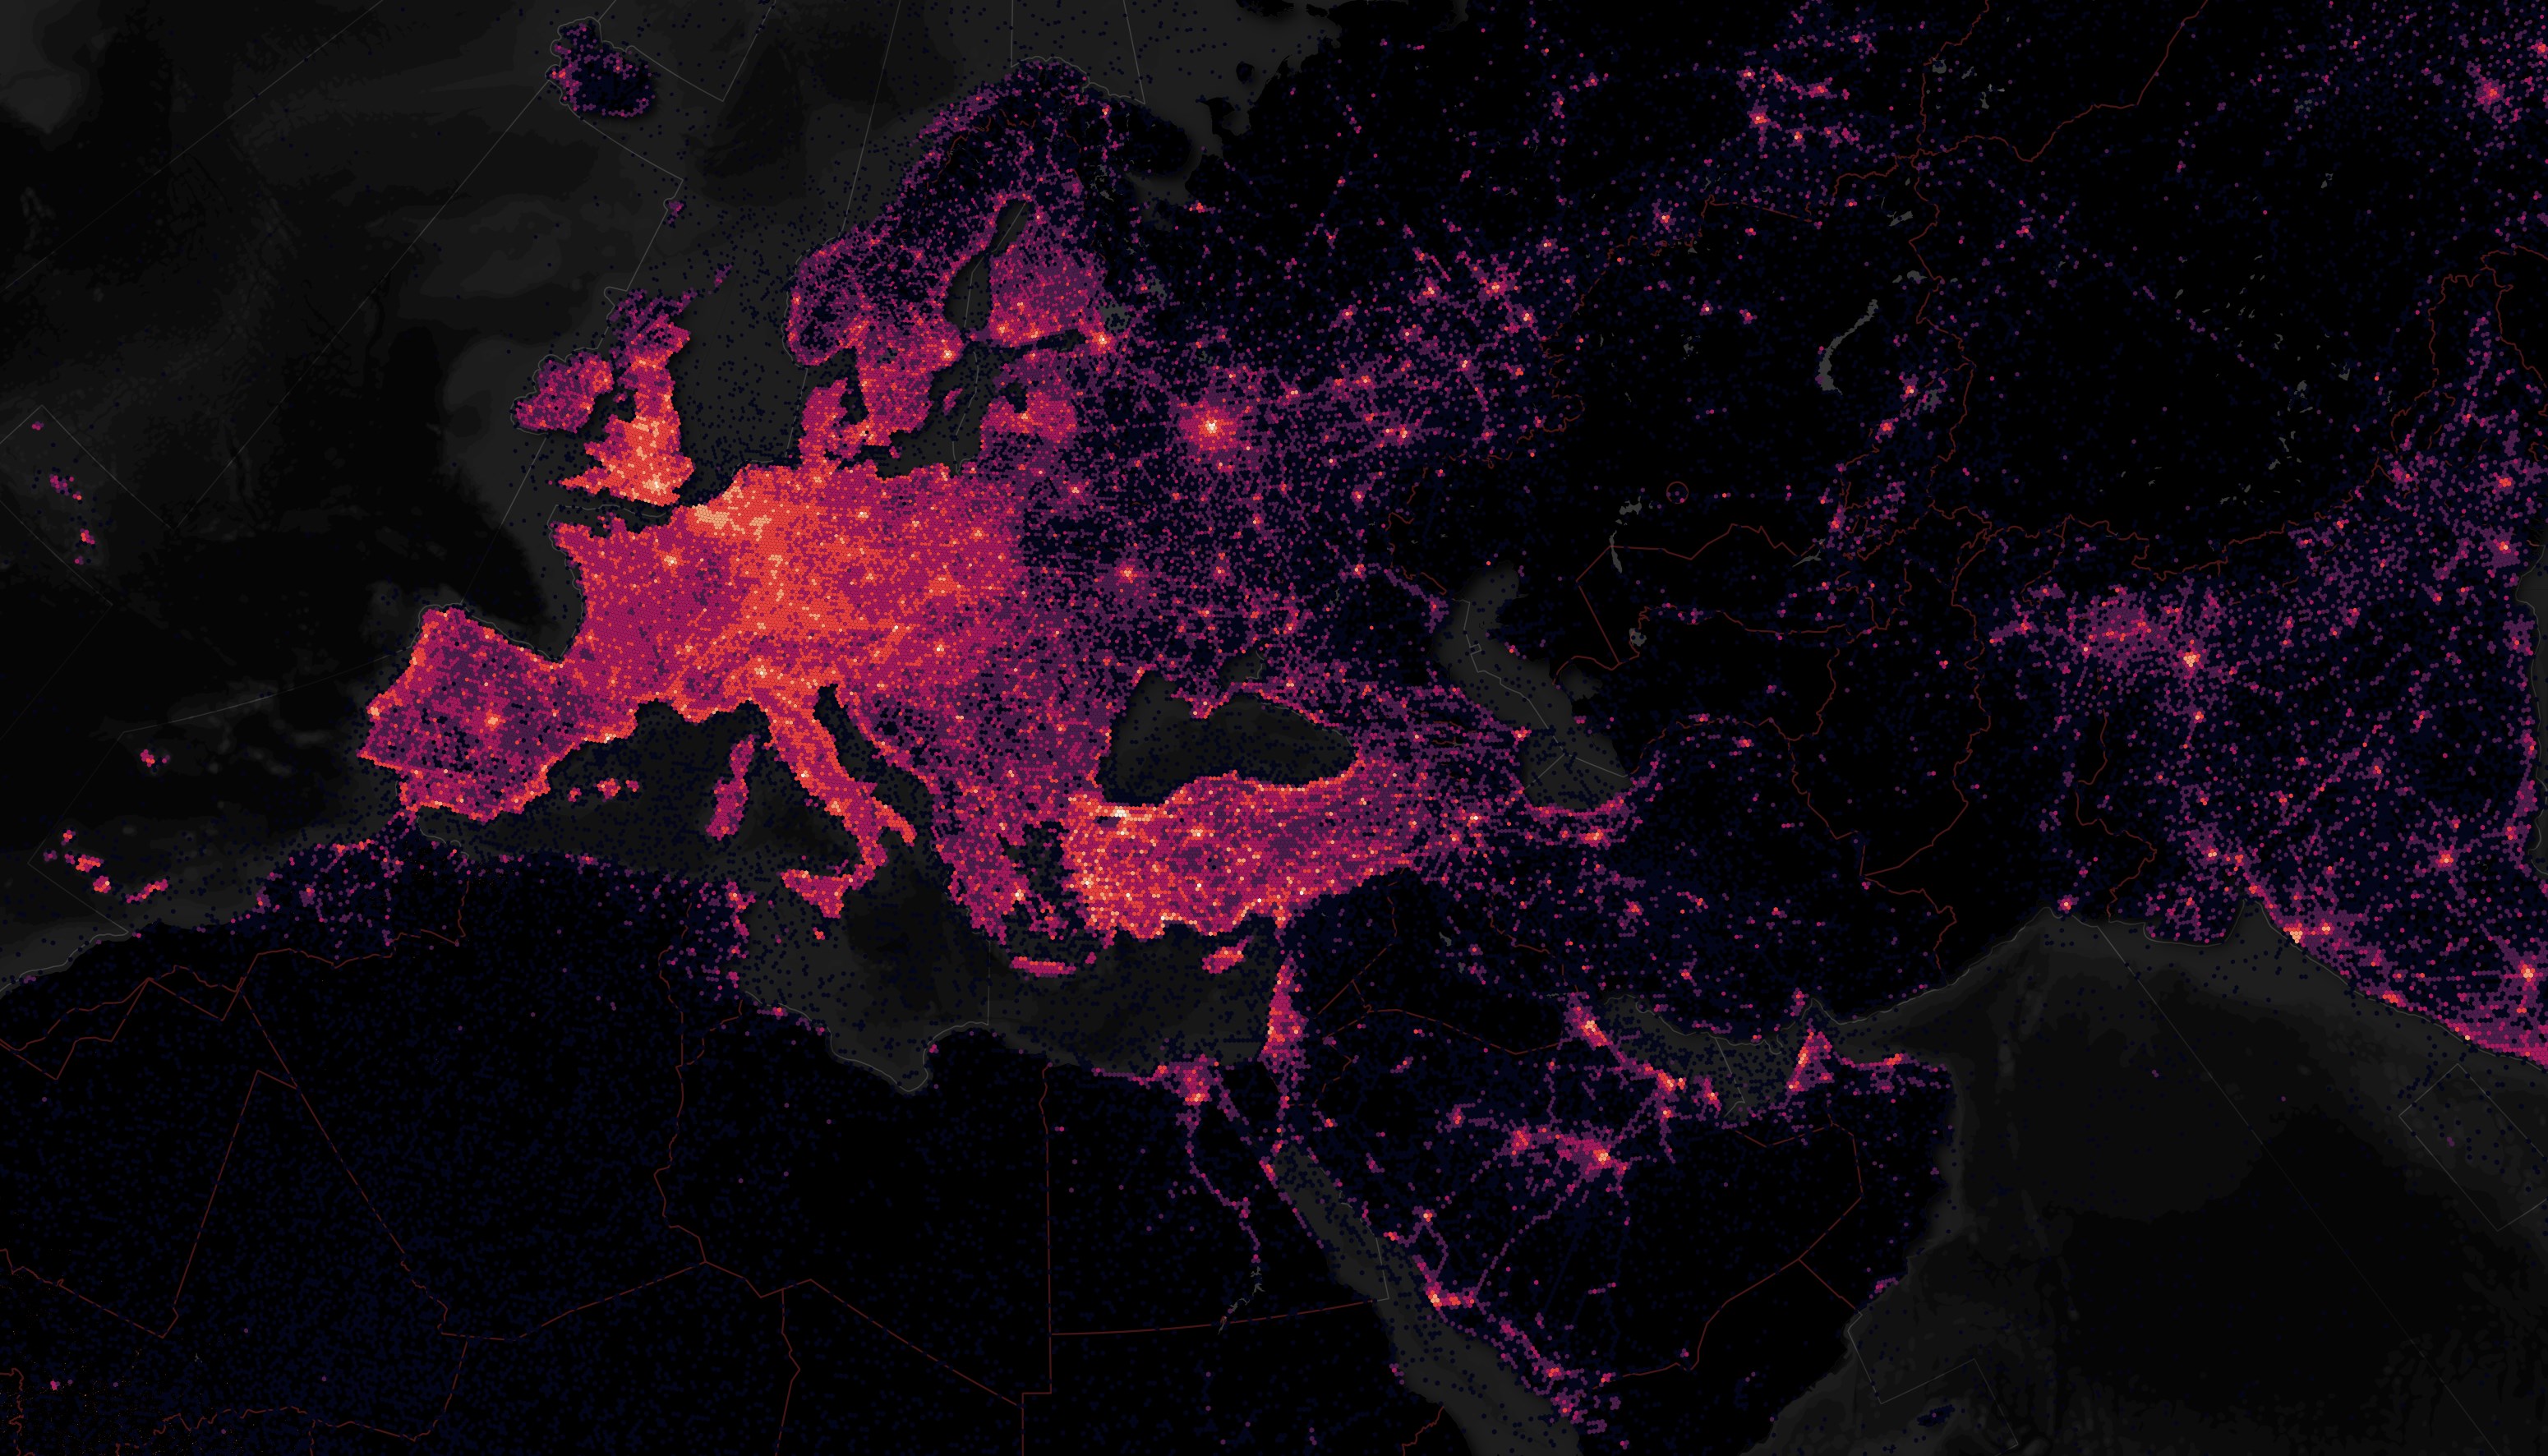
Latvia also stands out against Estonia and Lithuania in the above heatmap. They have twice as many people living there as Estonia but roughly a million less than Lithuania.
China has a decent number of POIs in this dataset. Thailand is completely lit up compared to its neighbours. North Korea appears almost completely pitch-black compared to South Korea.
The basemap used above has the world's urban centres coloured orange. Almost none of these urban centres are visible in the heatmaps which means Foursquare did a good job of covering the world's urban centres with this dataset.
Categories
The POIs are well-categorised and go into a lot of detail on their own. Below are the most common, top-level categories.
$ ~/duckdb
SELECT   COUNT(*),
         fsq_category_labels[1]
FROM     READ_PARQUET('*.parquet')
WHERE    fsq_category_labels IS NOT NULL
GROUP BY 2
ORDER BY 1 DESC
LIMIT    20;
┌──────────────┬─────────────────────────────────────────────────────────────────────────────────────┐
│ count_star() │                               fsq_category_labels[1]                                │
│    int64     │                                       varchar                                       │
├──────────────┼─────────────────────────────────────────────────────────────────────────────────────┤
│      2445949 │ Business and Professional Services > Office                                         │
│      1953758 │ Community and Government > Residential Building > Apartment or Condo                │
│      1831582 │ Business and Professional Services > Automotive Service > Automotive Repair Shop    │
│      1707012 │ Business and Professional Services > Health and Beauty Service > Hair Salon         │
│      1536639 │ Dining and Drinking > Restaurant                                                    │
│      1490833 │ Landmarks and Outdoors > Structure                                                  │
│      1352067 │ Business and Professional Services                                                  │
│      1278305 │ Dining and Drinking > Cafe, Coffee, and Tea House > Café                            │
│      1255136 │ Retail > Construction Supplies Store                                                │
│      1174087 │ Dining and Drinking > Bar                                                           │
│       998010 │ Travel and Transportation > Lodging > Hotel                                         │
│       966683 │ Travel and Transportation > Road                                                    │
│       956831 │ Health and Medicine > Physician > Doctor's Office                                   │
│       867655 │ Business and Professional Services > Financial Service > Banking and Finance > Bank │
│       850209 │ Community and Government > Spiritual Center > Church                                │
│       814109 │ Retail > Fashion Retail > Clothing Store                                            │
│       770410 │ Health and Medicine > Dentist                                                       │
│       730096 │ Retail                                                                              │
│       727223 │ Business and Professional Services > Factory                                        │
│       713314 │ Community and Government > Housing Development                                      │
├──────────────┴─────────────────────────────────────────────────────────────────────────────────────┤
│ 20 rows                                                                                  2 columns │
└────────────────────────────────────────────────────────────────────────────────────────────────────┘
Tallinn's Old Town
I'll extract out Tallinn's POIs.
$ ~/duckdb
COPY (
    SELECT   * EXCLUDE(fsq_category_ids, fsq_category_labels),
             fsq_category_ids::TEXT AS fsq_category_ids,
             fsq_category_labels::TEXT AS fsq_category_labels
    FROM     READ_PARQUET('*.parquet')
    WHERE    longitude > 24.44103
    AND      longitude < 25.00123
    AND      latitude  < 59.61838
    AND      latitude  > 59.34467
) TO 'fsq.pois.tallinn.gpkg'
    WITH (FORMAT GDAL,
          DRIVER 'GPKG',
          LAYER_CREATION_OPTIONS 'WRITE_BBOX=YES');
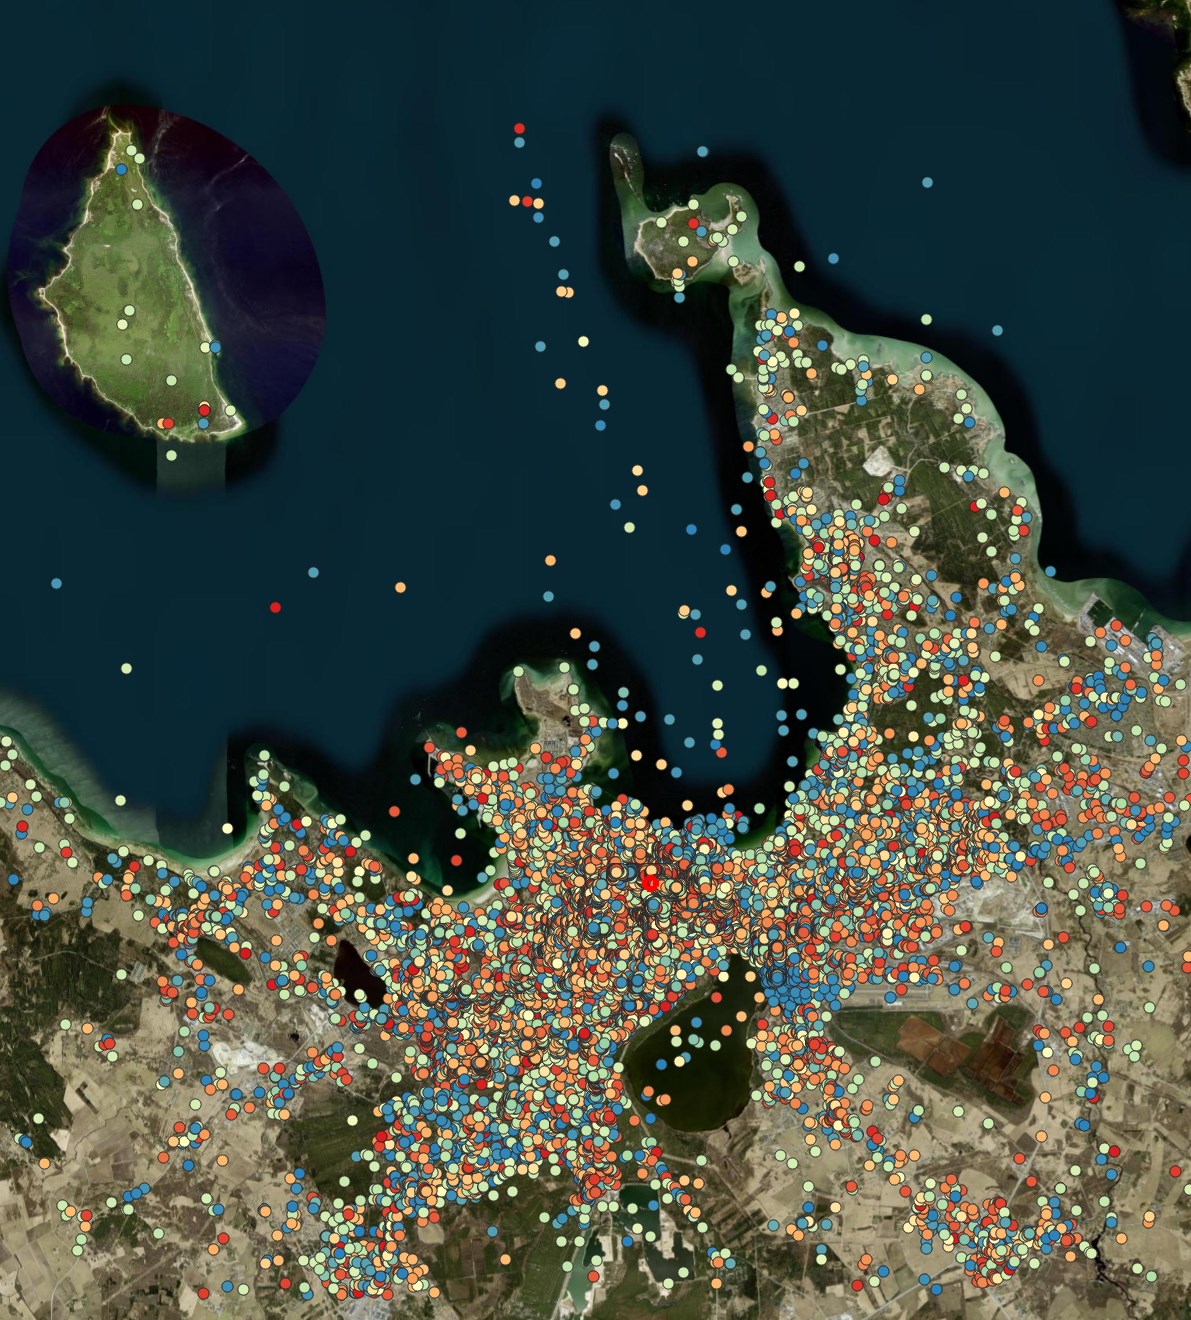
There are a lot of POIs in Tallinn Bay along the ferry route used between Estonia and the rest of the world.
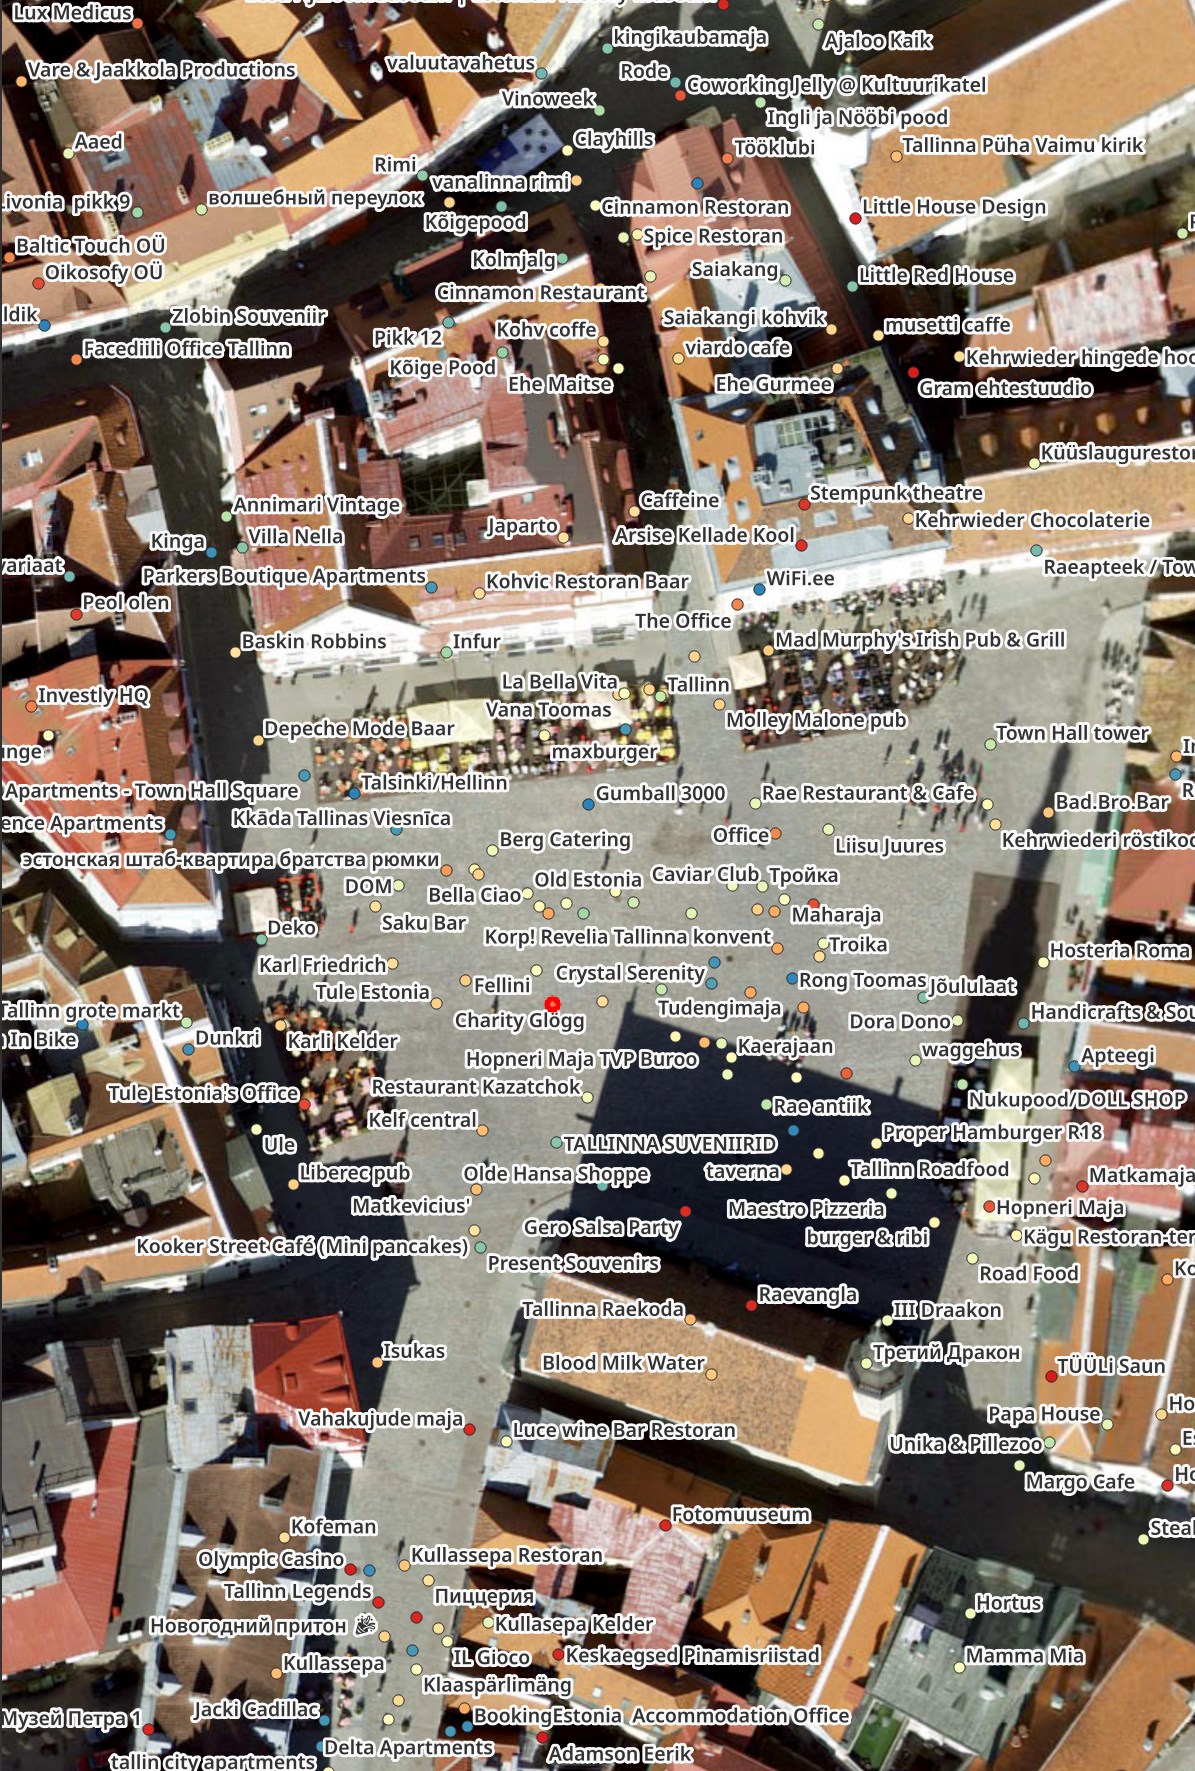
There are a lot of POIs right in the middle of Town Hall Square. Some are of nearby businesses while others are of events that have been held in the Square in years past.
Tallinn Airport
Tallinn Airport's Shops aren't in OpenStreetMap's database for some reason. There are tons of places to eat and drink at the Airport but you'd never know from the OSM map.
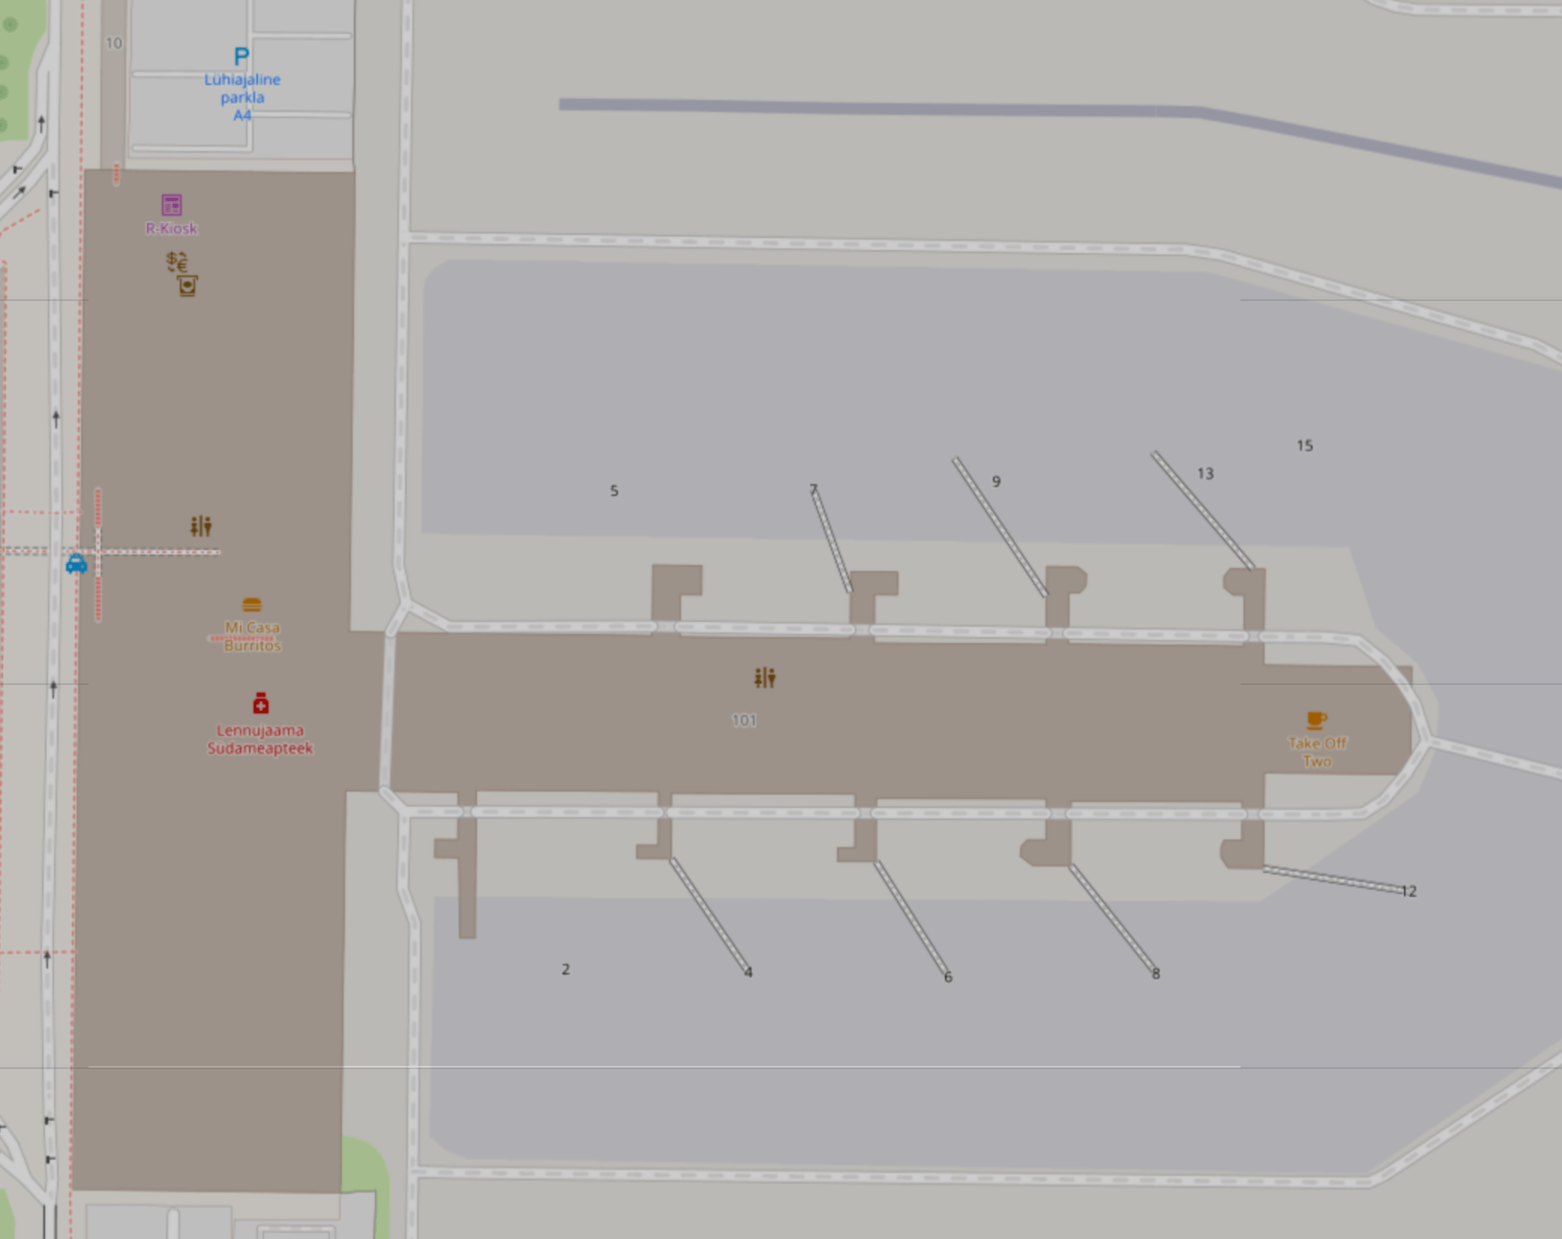
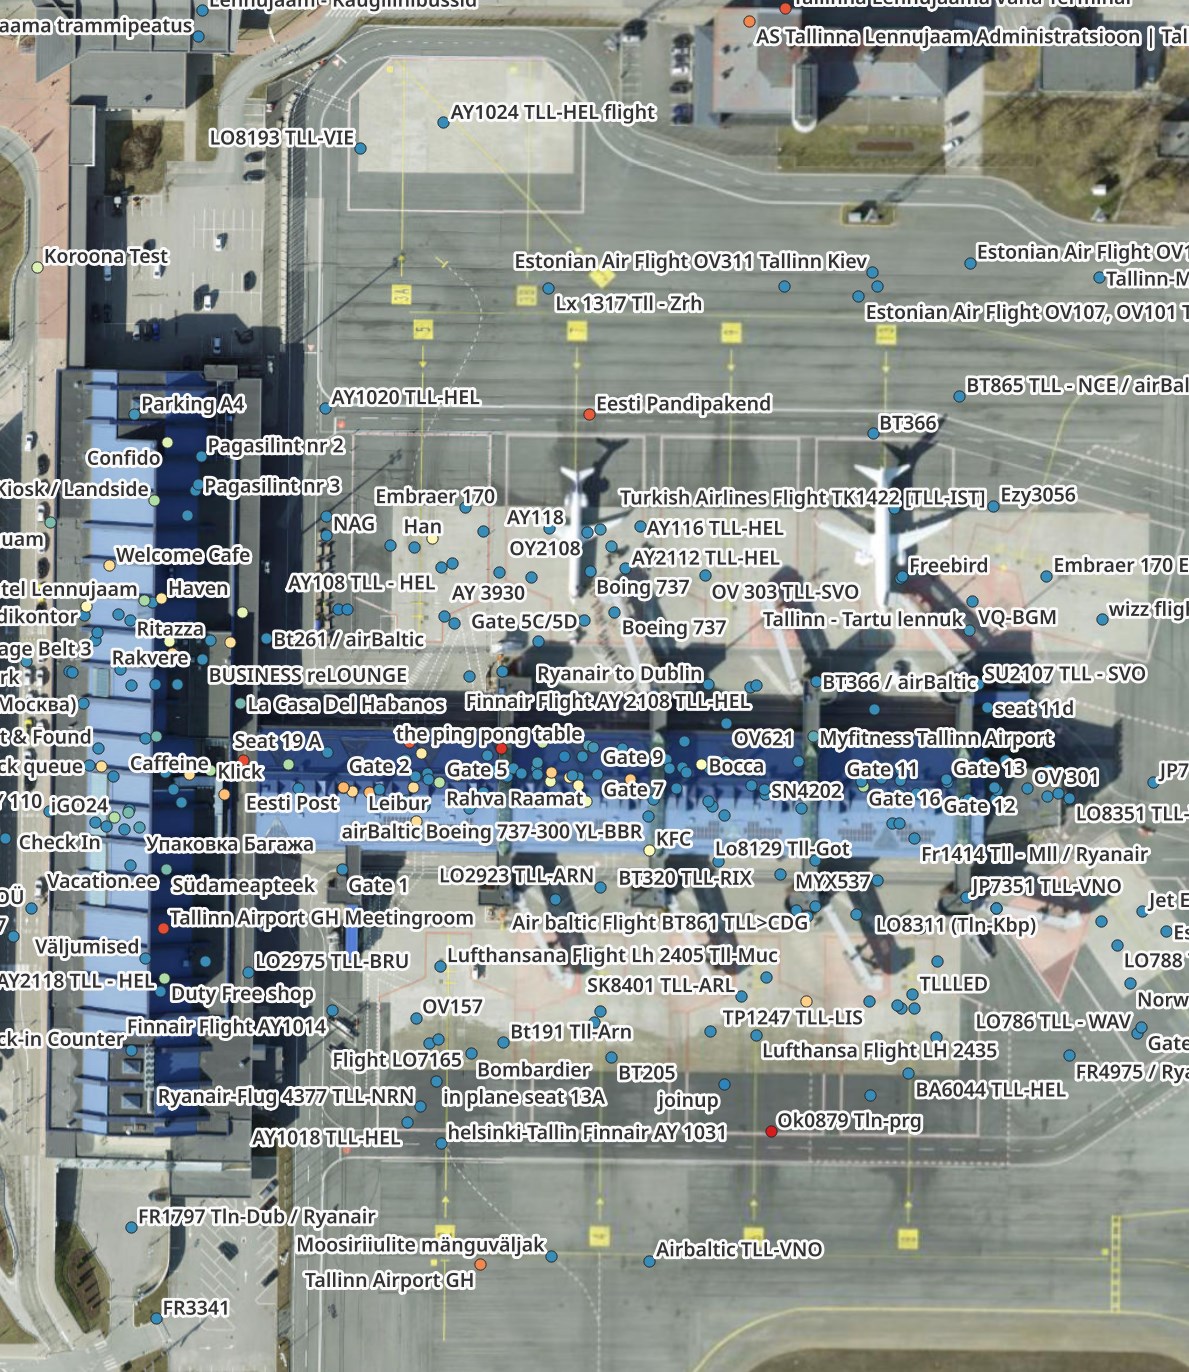
The POI dataset Foursquare has for the Airport does include every shop. It's just a matter of picking through all the other random POIs next to them.
It would be nice to see a confidence value, either provided by Foursquare or put together by the community to help filter out some of the noise.
Starbucks
There are a total of 53,022 records that match Starbucks in this dataset. Starbucks had 38K outlets last year. This 53K figure could also include locations they've since closed down.
Most records are simply named "Starbucks" but there is a longtail of variations as well.
$ ~/duckdb
SELECT   COUNT(*),
         name
FROM     READ_PARQUET('*.parquet')
WHERE    name ILIKE '%starbucks%'
GROUP BY 2
ORDER BY 1 DESC;
┌──────────────┬─────────────────────────────────────┐
│ count_star() │                name                 │
│    int64     │               varchar               │
├──────────────┼─────────────────────────────────────┤
│        42167 │ Starbucks                           │
│          589 │ Starbucks Coffee                    │
│          588 │ Starbucks (ستاربكس)                 │
│          480 │ Starbucks 星巴克                    │
│          367 │ Starbucks (สตาร์บัคส์)                 │
│          289 │ Starbucks (星巴克)                  │
│          248 │ Starbucks Reserve                   │
│          172 │ starbucks                           │
│          133 │ 星巴克 Starbucks                    │
│          122 │ Starbucks On The Go                 │
│          108 │ Starbucks Reserve 星巴克臻选        │
│           48 │ STARBUCKS                           │
│           47 │ Starbucks coffee                    │
│           46 │ Starbucks | ستاربكس                 │
│           39 │ STARBUCKS COFFEE                    │
│           35 │ Starbucks Drive Thru                │
│           34 │ Starbucks Coffe                     │
│           18 │ starbucks coffee                    │
│           15 │ Starbucks coffe                     │
│           15 │ Starbucks / ستاربكس                 │
│            · │          ·                          │
│            · │          ·                          │
│            · │          ·                          │
│            1 │ Starbucks Ferry Terminal            │
│            1 │ Starbucks Dallah                    │
│            1 │ starbucks Atyafmall                 │
│            1 │ Starbucks Naz                       │
│            1 │ 24hr Starbucks                      │
│            1 │ Starbucks At Nemours                │
│            1 │ Starbucks.SU                        │
│            1 │ Starbucks Metropolis Mall           │
│            1 │ Starbucks Atakum                    │
│            1 │ Starbucks - Travis Air Force Base   │
│            1 │ Toyota South Campus Starbucks       │
│            1 │ Starbucks Coffee Pejaten            │
│            1 │ Starbucks blok m                    │
│            1 │ Starbucks Kemang village            │
│            1 │ Starbucks km.97                     │
│            1 │ Starbucks Muara Bungo Mall          │
│            1 │ Starbucks Ngagel                    │
│            1 │ Starbucks libi                      │
│            1 │ Starbucks Coffee Kuta               │
│            1 │ Starbucks Coffee 広尾有栖川公園前店 │
├──────────────┴─────────────────────────────────────┤
│ 6560 rows (40 shown)                     2 columns │
└────────────────────────────────────────────────────┘
I'll build a heatmap of their locations.
COPY (
    SELECT   H3_CELL_TO_BOUNDARY_WKT(
                  H3_LATLNG_TO_CELL(latitude,
                                    longitude,
                                    2))::geometry geom,
             COUNT(*) AS num_recs
    FROM     READ_PARQUET('*.parquet')
    WHERE    longitude < 170
    AND      longitude > -170
    AND      latitude IS NOT NULL
    AND      name ILIKE '%starbucks%'
    GROUP BY 1
) TO 'fsq.starbucks.h3_2.gpkg'
    WITH (FORMAT GDAL,
          DRIVER 'GPKG',
          LAYER_CREATION_OPTIONS 'WRITE_BBOX=YES');
