The Automatic Identification System (AIS) is a ship tracking system. It's main aim is to help avoid maritime collisions by making vessels identify where they are.
AIS messages include a Maritime Mobile Service Identity (MMSI) number. This is a temporarily-assigned unique identifier that among other things, will identify the flag a vessel is sailing under.
Nearby AIS radio traffic can be picked up by anyone with the right equipment but online feeds covering large parts of the world are harder to come by and often require a commercial agreement.
The Finnish Transport Infrastructure Agency (FTIA) hosts an open data API for maritime traffic in and around Finnish Waterways. It not only contains AIS data for the Baltic Sea, it goes beyond that with port call data and a whole host of other datasets.
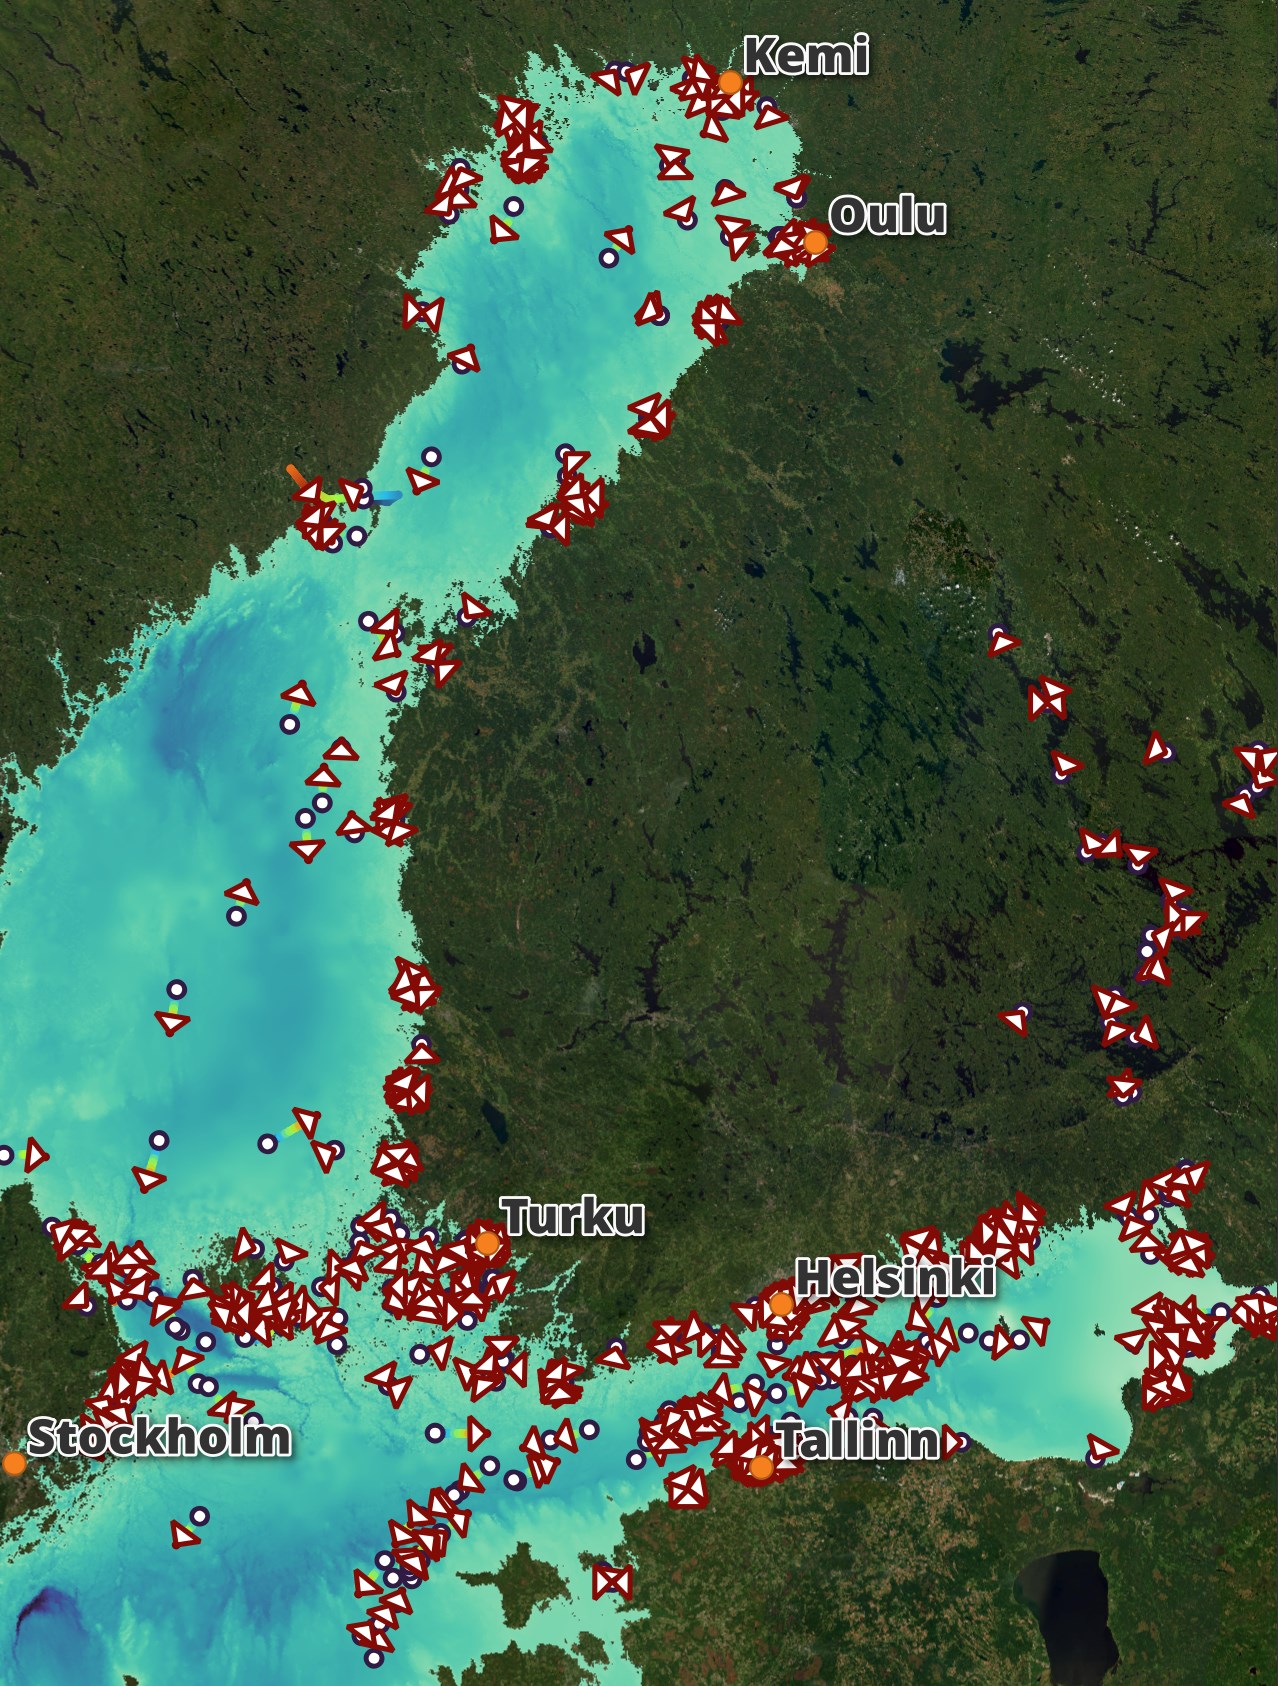
Below is an hour's worth of traffic from yesterday:
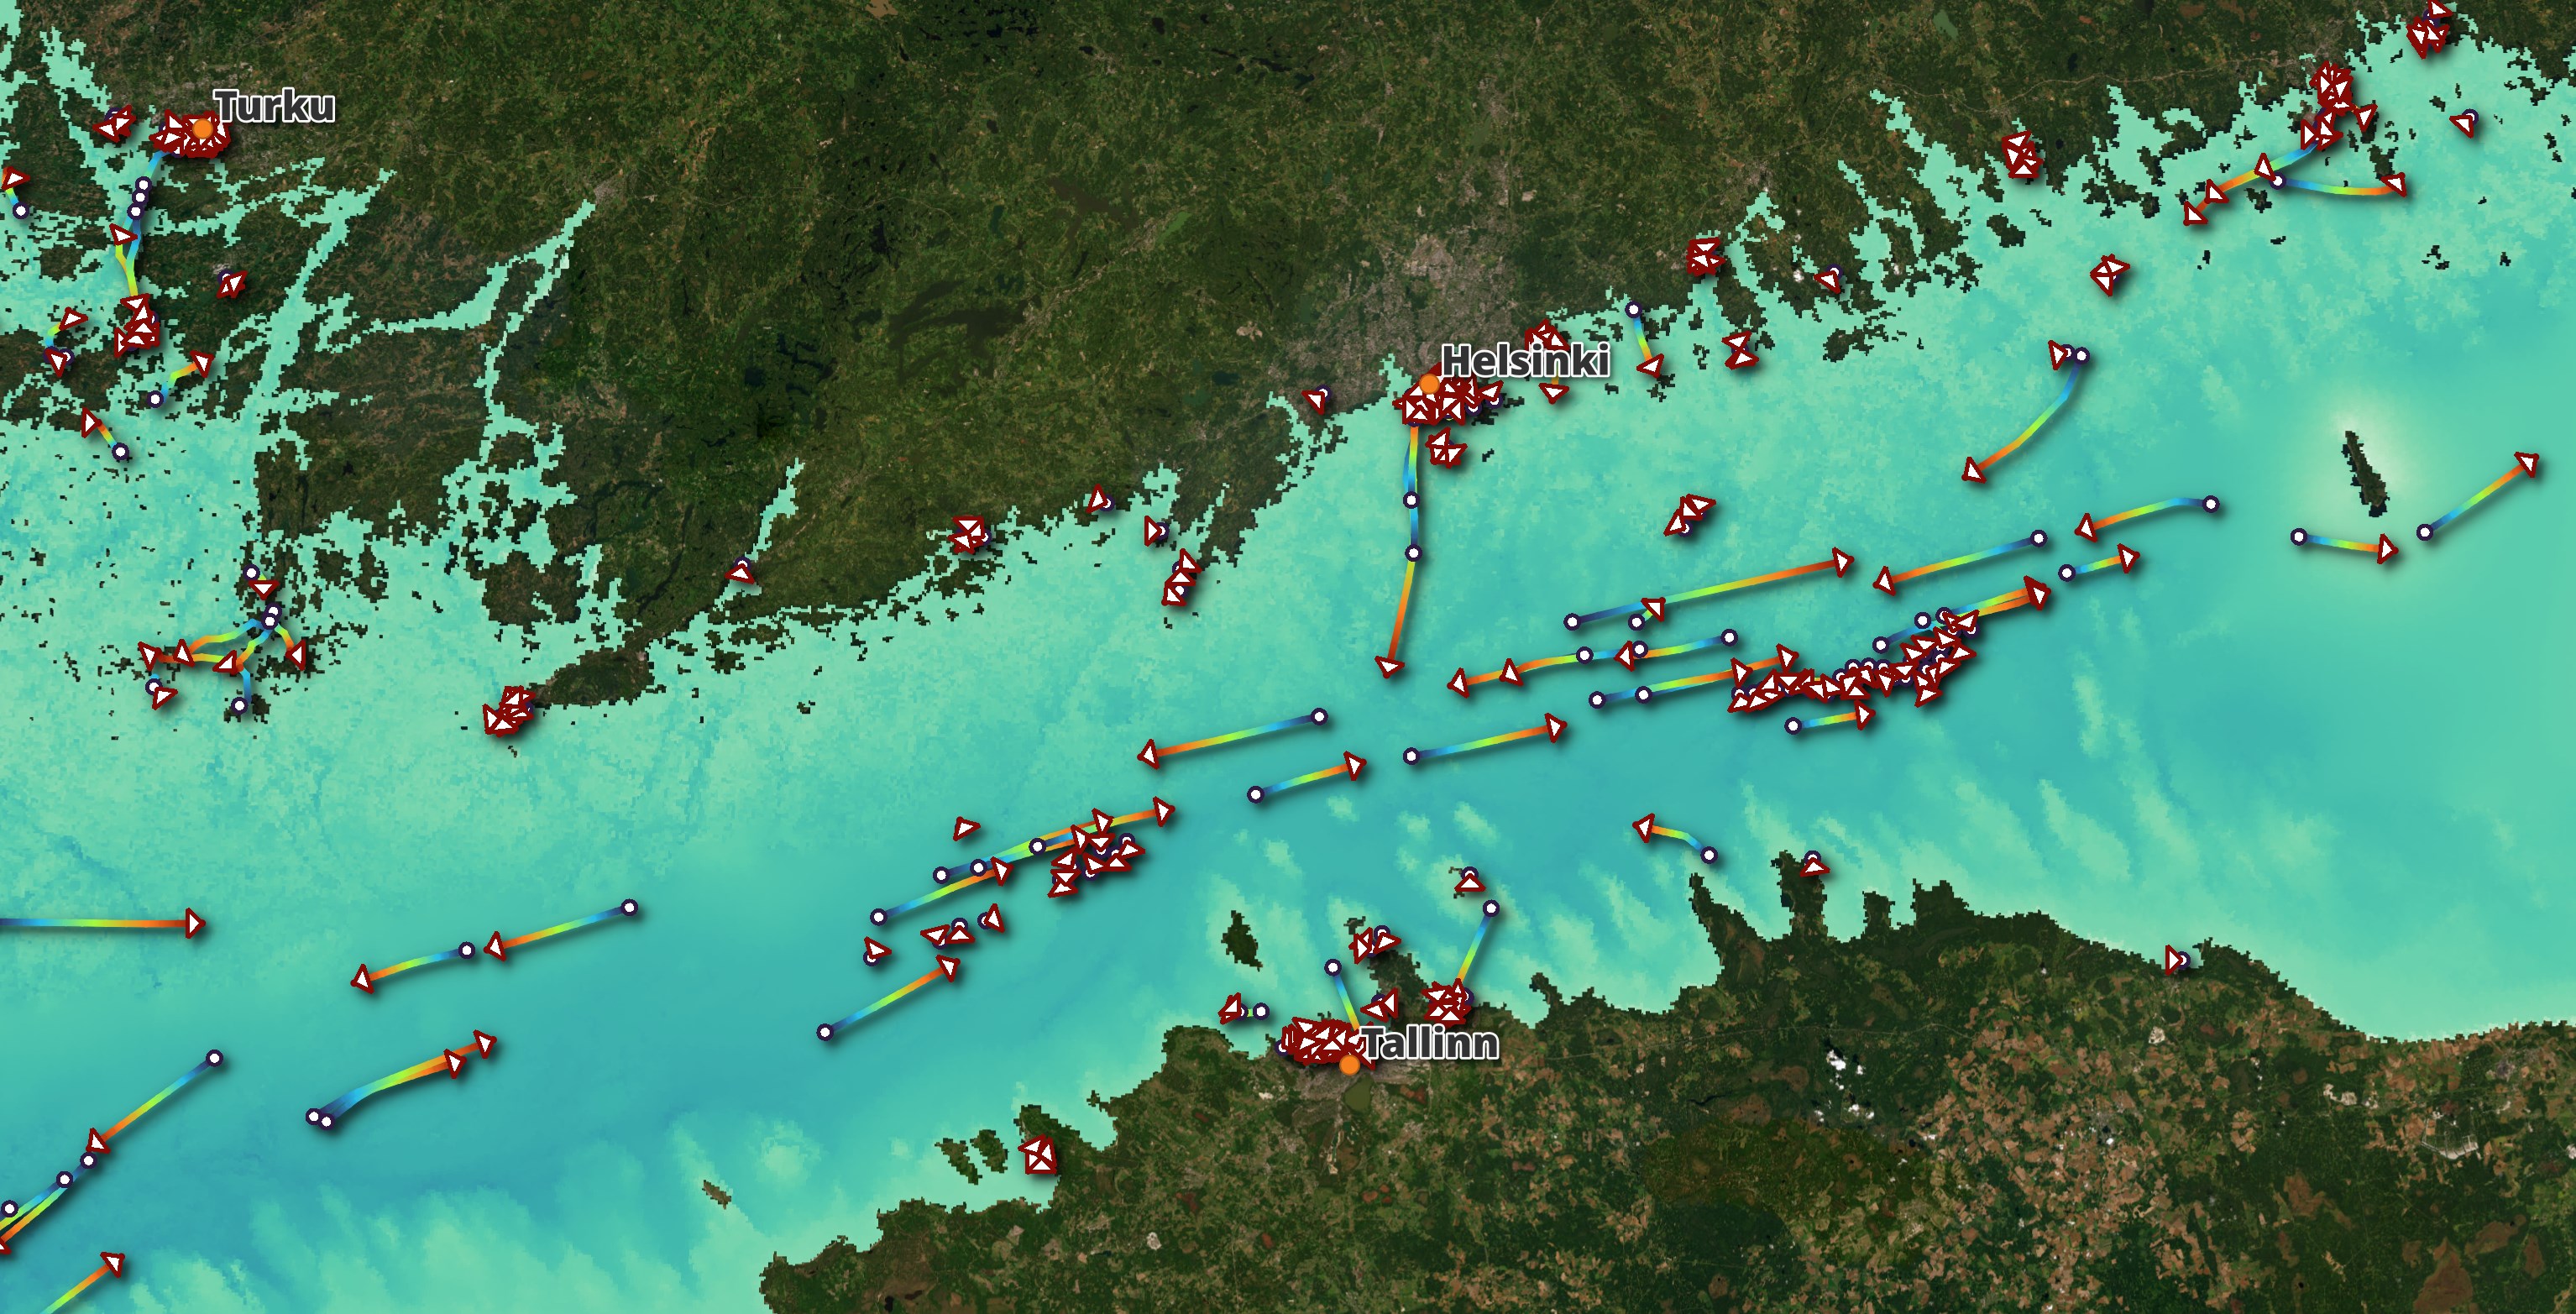
Below I've zoomed in to the Gulf of Finland between Helsinki and Tallinn.
In this post, I'll download and examine a few weeks of FTIA's maritime traffic data feeds.
My Workstation
I'm using a 6 GHz Intel Core i9-14900K CPU. It has 8 performance cores and 16 efficiency cores with a total of 32 threads and 32 MB of L2 cache. It has a liquid cooler attached and is housed in a spacious, full-sized, Cooler Master HAF 700 computer case. I've come across videos on YouTube where people have managed to overclock the i9-14900KF to 9.1 GHz.
The system has 96 GB of DDR5 RAM clocked at 6,000 MT/s and a 5th-generation, Crucial T700 4 TB NVMe M.2 SSD which can read at speeds up to 12,400 MB/s. There is a heatsink on the SSD to help keep its temperature down. This is my system's C drive.
The system is powered by a 1,200-watt, fully modular, Corsair Power Supply and is sat on an ASRock Z790 Pro RS Motherboard.
I'm running Ubuntu 22 LTS via Microsoft's Ubuntu for Windows on Windows 11 Pro. In case you're wondering why I don't run a Linux-based desktop as my primary work environment, I'm still using an Nvidia GTX 1080 GPU which has better driver support on Windows and I use ArcGIS Pro from time to time which only supports Windows natively.
Installing Prerequisites
I'll be using Python and a few other tools to help analyse the data in this post.
$ sudo apt update
$ sudo apt install \
    jq \
    python3-pip \
    python3-virtualenv
I'll set up a Python Virtual Environment and install some dependencies.
$ virtualenv ~/.streets
$ source ~/.streets/bin/activate

$ python -m pip install \
    pyais
I'll also use DuckDB, along with its H3, JSON, Parquet and Spatial extensions, in this post.
$ cd ~
$ wget -c https://github.com/duckdb/duckdb/releases/download/v1.0.0/duckdb_cli-linux-amd64.zip
$ unzip -j duckdb_cli-linux-amd64.zip
$ chmod +x duckdb
$ ~/duckdb
INSTALL h3 FROM community;
INSTALL json;
INSTALL parquet;
INSTALL spatial;
I'll set up DuckDB to load every installed extension each time it launches.
$ vi ~/.duckdbrc
.timer on
.width 180
LOAD h3;
LOAD json;
LOAD parquet;
LOAD spatial;
The maps in this post were rendered with QGIS version 3.38.0. QGIS is a desktop application that runs on Windows, macOS and Linux. The application has grown in popularity in recent years and has ~15M application launches from users around the world each month.
I used QGIS' Tile+ plugin to add geospatial context to the maps with Esri's World Imagery Basemap. I'll also use Trajectools to turn ship position tracking points into trajectories.
For Trajectools, I first installed MovingPandas into QGIS' Python Environment. Launch QGIS' Python Console from the Plugins Menu and run the following.
import pip

pip.main(['install', 'gtfs_functions'])
pip.main(['install', 'scikit-mobility'])
pip.main(['install', 'movingpandas'])
Then after restarting QGIS, find "Trajectools" in the "Manage and Install Plugins" dialog and install it.
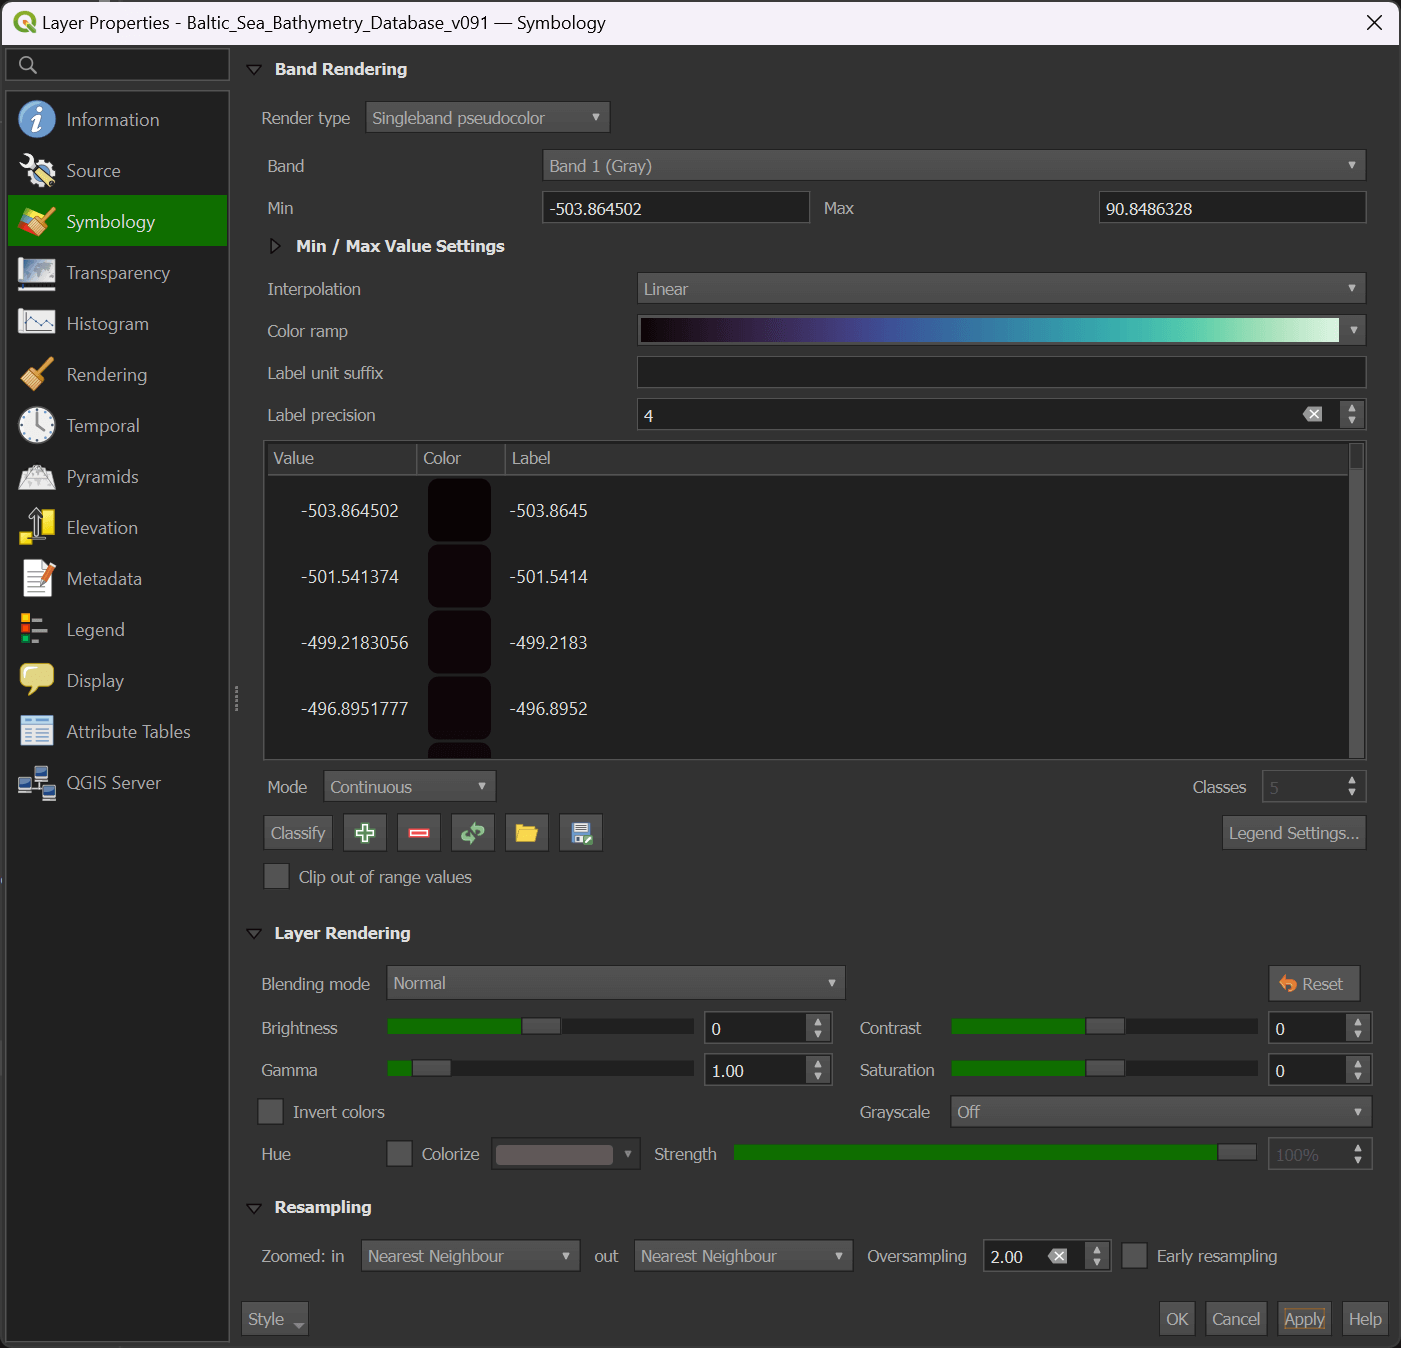
I've used HELCOM's Baltic Sea Bathymetry Database for the Baltic Sea bathymetry as it is much more detailed that any other basemap's bathymetry that I have access to.
Below is the colour ramp settings for its layer in QGIS.
Downloading FTIA's Maritime Feeds
The API is demanding to the headers it's sent as FTIA wants to be able to identify the applications using its feeds. Using curl or wget with their default agent identify and other parameters will result in an HTTP 406: Not Acceptable response. I've included the Digitraffic-User example header from FTIA's documentation below. Please make this something distinctive but without any PII if you're going to run these commands.
There are two API endpoints that I will collect every six hours.
$ mkdir -p ~/Finland
$ vi ~/Finland/download.sh
DATE=`date --date="NOW" +"%Y.%m.%d.%H.%M.%S"`

for ENDPOINT in port-calls vessel-details; do
    curl "https://meri.digitraffic.fi/api/port-call/v1/$ENDPOINT" \
      -H 'Accept-Encoding: gzip' \
      -H 'Digitraffic-User: Junamies/FoobarApp 1.0' \
      --output "/home/mark/Finland/$ENDPOINT.$DATE.json.gz"
done
There are two API endpoints that I'll collect every five minutes.
$ vi ~/Finland/vessel_locations.sh
DATE=`date --date="NOW" +"%Y.%m.%d.%H.%M.%S"`
curl 'https://meri.digitraffic.fi/api/ais/v1/locations' \
  -H 'Accept-Encoding: gzip' \
  -H 'Digitraffic-User: Junamies/FoobarApp 1.0' \
  --output /home/mark/Finland/vessel-locations.$DATE.json.gz

curl 'https://meri.digitraffic.fi/api/ais/v1/vessels' \
  -H 'Accept-Encoding: gzip' \
  -H 'Digitraffic-User: Junamies/FoobarApp 1.0' \
  --output /home/mark/Finland/vessel.$DATE.json.gz
I'll use crontab to collect these feeds.
$ crontab -e
5 */6 * * * bash -c /home/mark/Finland/download.sh
*/5 * * * * bash -c /home/mark/Finland/vessel_locations.sh
Data Fluency
The above cronjobs ran for two weeks. The vessel and locations JSON files were the largest at ~2-3 GB each when GZIP-compressed.
Size   | Dataset
-------|-----------------
2.9 GB | vessel
2.2 GB | vessel-locations
2.9 MB | port-calls
152 KB | vessel-details
The Vessels Feed
The largest feed was the vessels' feed. It's mostly just metadata for each unique ship but I collected it every five minutes. It's likely I could have lengthened the intervals between calling this endpoint.
Below is an example record.
$ gunzip -c vessel.2024.09.03.07.45.01.json.gz \
    | jq -S '.[0]'
{
  "callSign": "OWPA2",
  "destination": "NL AMS",
  "draught": 118,
  "eta": 416128,
  "imo": 9692129,
  "mmsi": 219598000,
  "name": "NORD SUPERIOR",
  "posType": 1,
  "referencePointA": 148,
  "referencePointB": 35,
  "referencePointC": 23,
  "referencePointD": 9,
  "shipType": 80,
  "timestamp": 1591521868371
}
There were ships flagged from 104 countries in total that I saw over the two week period I collected this feed for. Below are the top 25 most common flags.
$ ~/duckdb
CREATE OR REPLACE TABLE vessels AS
    SELECT *
    FROM   READ_JSON('vessel.2024.*.json.gz');

SELECT COUNT(DISTINCT mmsi) FROM vessels; -- 15670

COPY (
    SELECT DISTINCT mmsi AS mmsi
    FROM   READ_JSON('vessel.2024.*.json.gz')
) TO 'mmsi.csv';
$ python3
from collections import Counter

from pyais.util import get_country


Counter([get_country(int(mmsi))
         for mmsi in open('mmsi.csv').read().splitlines()
         if mmsi[0] != 'm'])\
    .most_common(25)
[(('MH', 'Marshall Is'), 1784),
 (('LR', 'Liberia'), 1760),
 (('PA', 'Panama'), 1338),
 (('RU', 'Russia'), 1180),
 (('MT', 'Malta'), 990),
 (('SE', 'Sweden'), 779),
 (('NL', 'Netherlands'), 759),
 (('FI', 'Finland'), 753),
 (('AG', 'Antigua Barbuda'), 552),
 (('CY', 'Cyprus'), 492),
 (('HK', 'Hong Kong'), 463),
 (('SG', 'Singapore'), 458),
 (('BS', 'Bahamas'), 433),
 (('PT', 'Portugal'), 419),
 (('NO', 'Norway'), 397),
 (('DK', 'Denmark'), 284),
 (('GB', 'United Kingdom'), 255),
 (('BB', 'Barbados'), 207),
 (('GR', 'Greece'), 197),
 (('DE', 'Germany'), 193),
 (('EE', 'Estonia'), 141),
 (('GI', 'Gibraltar'), 127),
 (('LV', 'Latvia'), 113),
 (('GA', 'Gabon'), 98),
 (('KY', 'Cayman Is'), 90)]
The Vessel Positions Feed
The locations feed was the second largest. It's in GeoJSON format so any individual API response should be able to load into a lot of different GIS software without issue.
$ gunzip -c  vessel-locations.2024.09.03.08.55.01.json.gz \
    | jq -S '.features[0]'
{
  "geometry": {
    "coordinates": [
      19.039567,
      58.686267
    ],
    "type": "Point"
  },
  "mmsi": 259545000,
  "properties": {
    "cog": 207,
    "heading": 207,
    "mmsi": 259545000,
    "navStat": 0,
    "posAcc": false,
    "raim": false,
    "rot": 0,
    "sog": 10.2,
    "timestamp": 57,
    "timestampExternal": 1587929638085
  },
  "type": "Feature"
}
In total, there was ~13 GB of uncompressed GeoJSON collected with 52,799,484 records in total.
For some reason, the feed included location data from the past six years. I'm not sure why this is and I'll need to investigate the nature of this endpoint further.
$ gunzip -c vessel-locations.2024.*.json.gz \
    | jq -c .features[] \
    > vessel-locations.json
$ ~/duckdb finland.duckdb
CREATE OR REPLACE TABLE vessel_locations AS
    SELECT ST_POINT(geometry.coordinates[1],
                    geometry.coordinates[2]) AS geom,
           properties.* EXCLUDE(timestamp,
                                timestampExternal),
           MAKE_TIMESTAMP(properties.timestampExternal * 1000) AS ts
    FROM   READ_JSON('vessel-locations.json');
SELECT   EXTRACT(year FROM ts) AS year_,
         COUNT(*)
FROM     vessel_locations
GROUP BY 1
ORDER BY 1;
┌───────┬──────────────┐
│ year_ │ count_star() │
│ int64 │    int64     │
├───────┼──────────────┤
│  2018 │      1166547 │
│  2019 │      4891318 │
│  2020 │      5472187 │
│  2021 │      6455665 │
│  2022 │      6910692 │
│  2023 │      8818123 │
│  2024 │     19084952 │
└───────┴──────────────┘
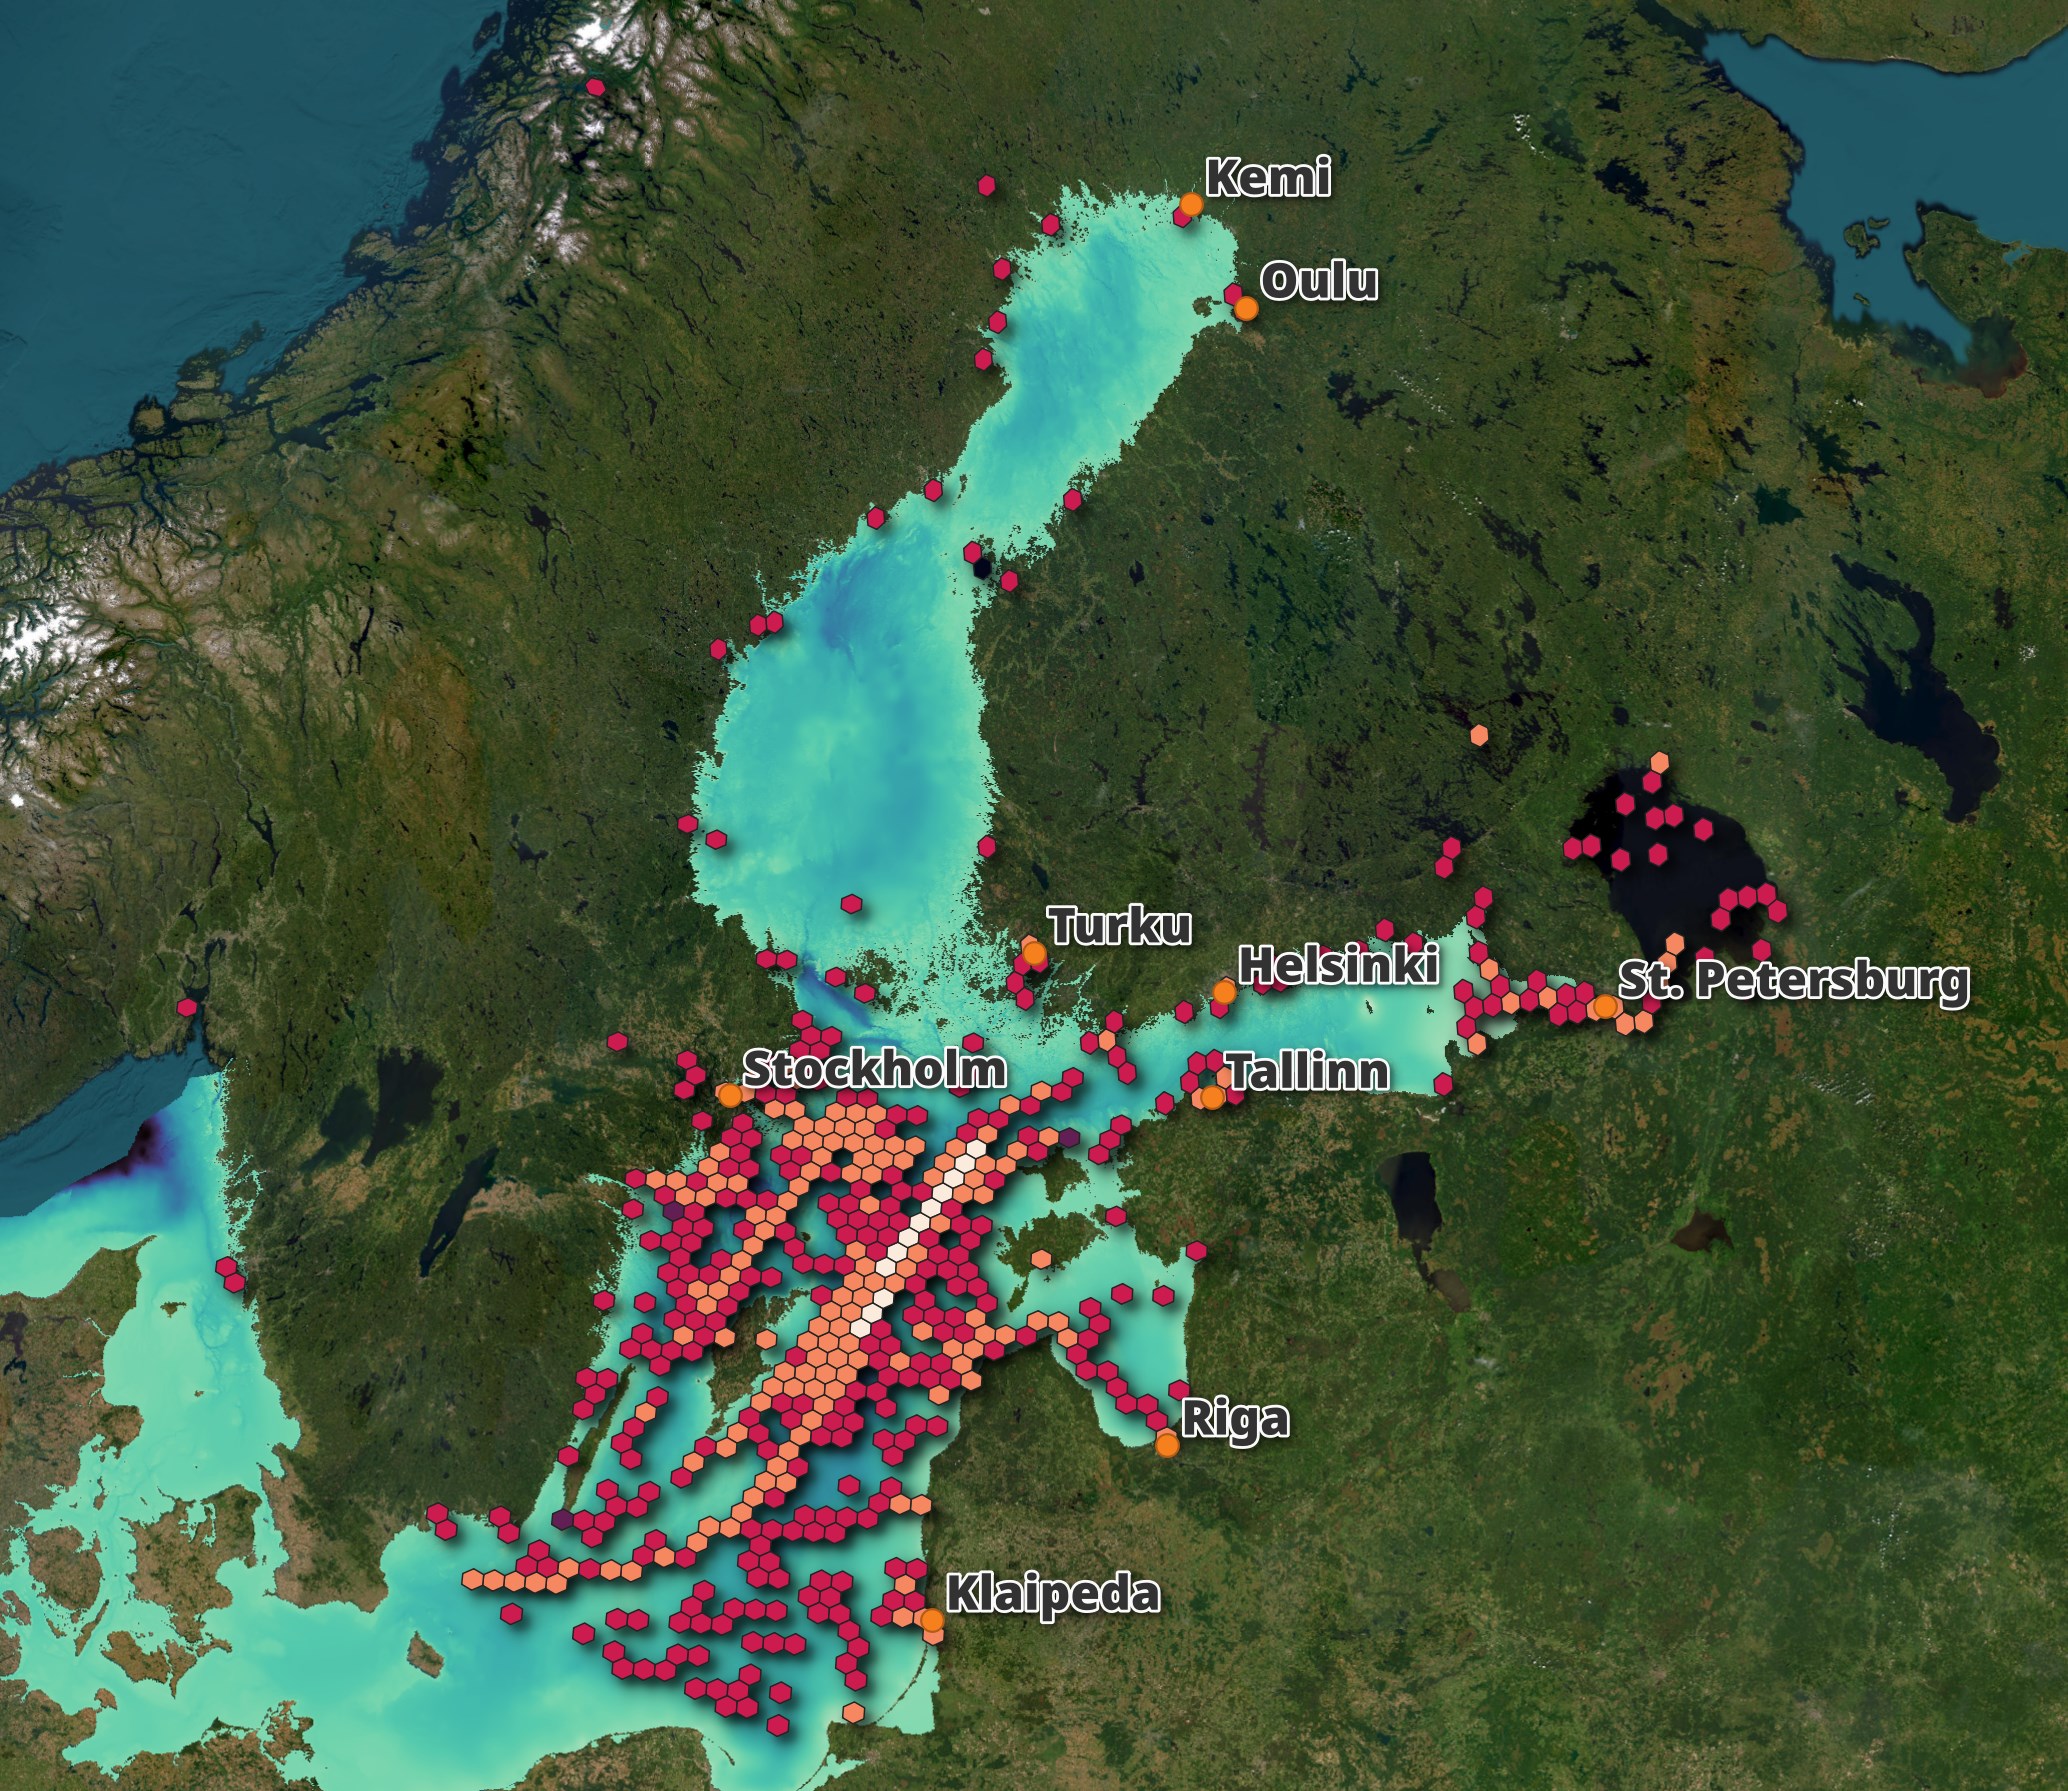
The location data came from across the Baltic Sea including Russia and even had locations as far away as Northern and Southern Norway. Below is a heatmap for 2023.
COPY (
    SELECT   H3_CELL_TO_BOUNDARY_WKT(
                  H3_LATLNG_TO_CELL(ST_Y(geom),
                                    ST_X(geom),
                                    5))::geometry geom,
             COUNT(*) as num_points
    FROM     vessel_locations
    WHERE    extract(year from ts) = 2023
    GROUP BY 1
) TO 'vessel-locations.h3_5.gpkg'
    WITH (FORMAT GDAL,
          DRIVER 'GPKG',
          LAYER_CREATION_OPTIONS 'WRITE_BBOX=YES');
Tallink's Megastar
The Tallinn-Helsinki Ferry route is one of the busiest in Europe. I've made the journey back and forth on Tallink's Megastar several times over the years it has been in service. I took this photo of Tallink's Megastar while it was sailing the afternoon Tallinn to Helsinki route on August 18th.
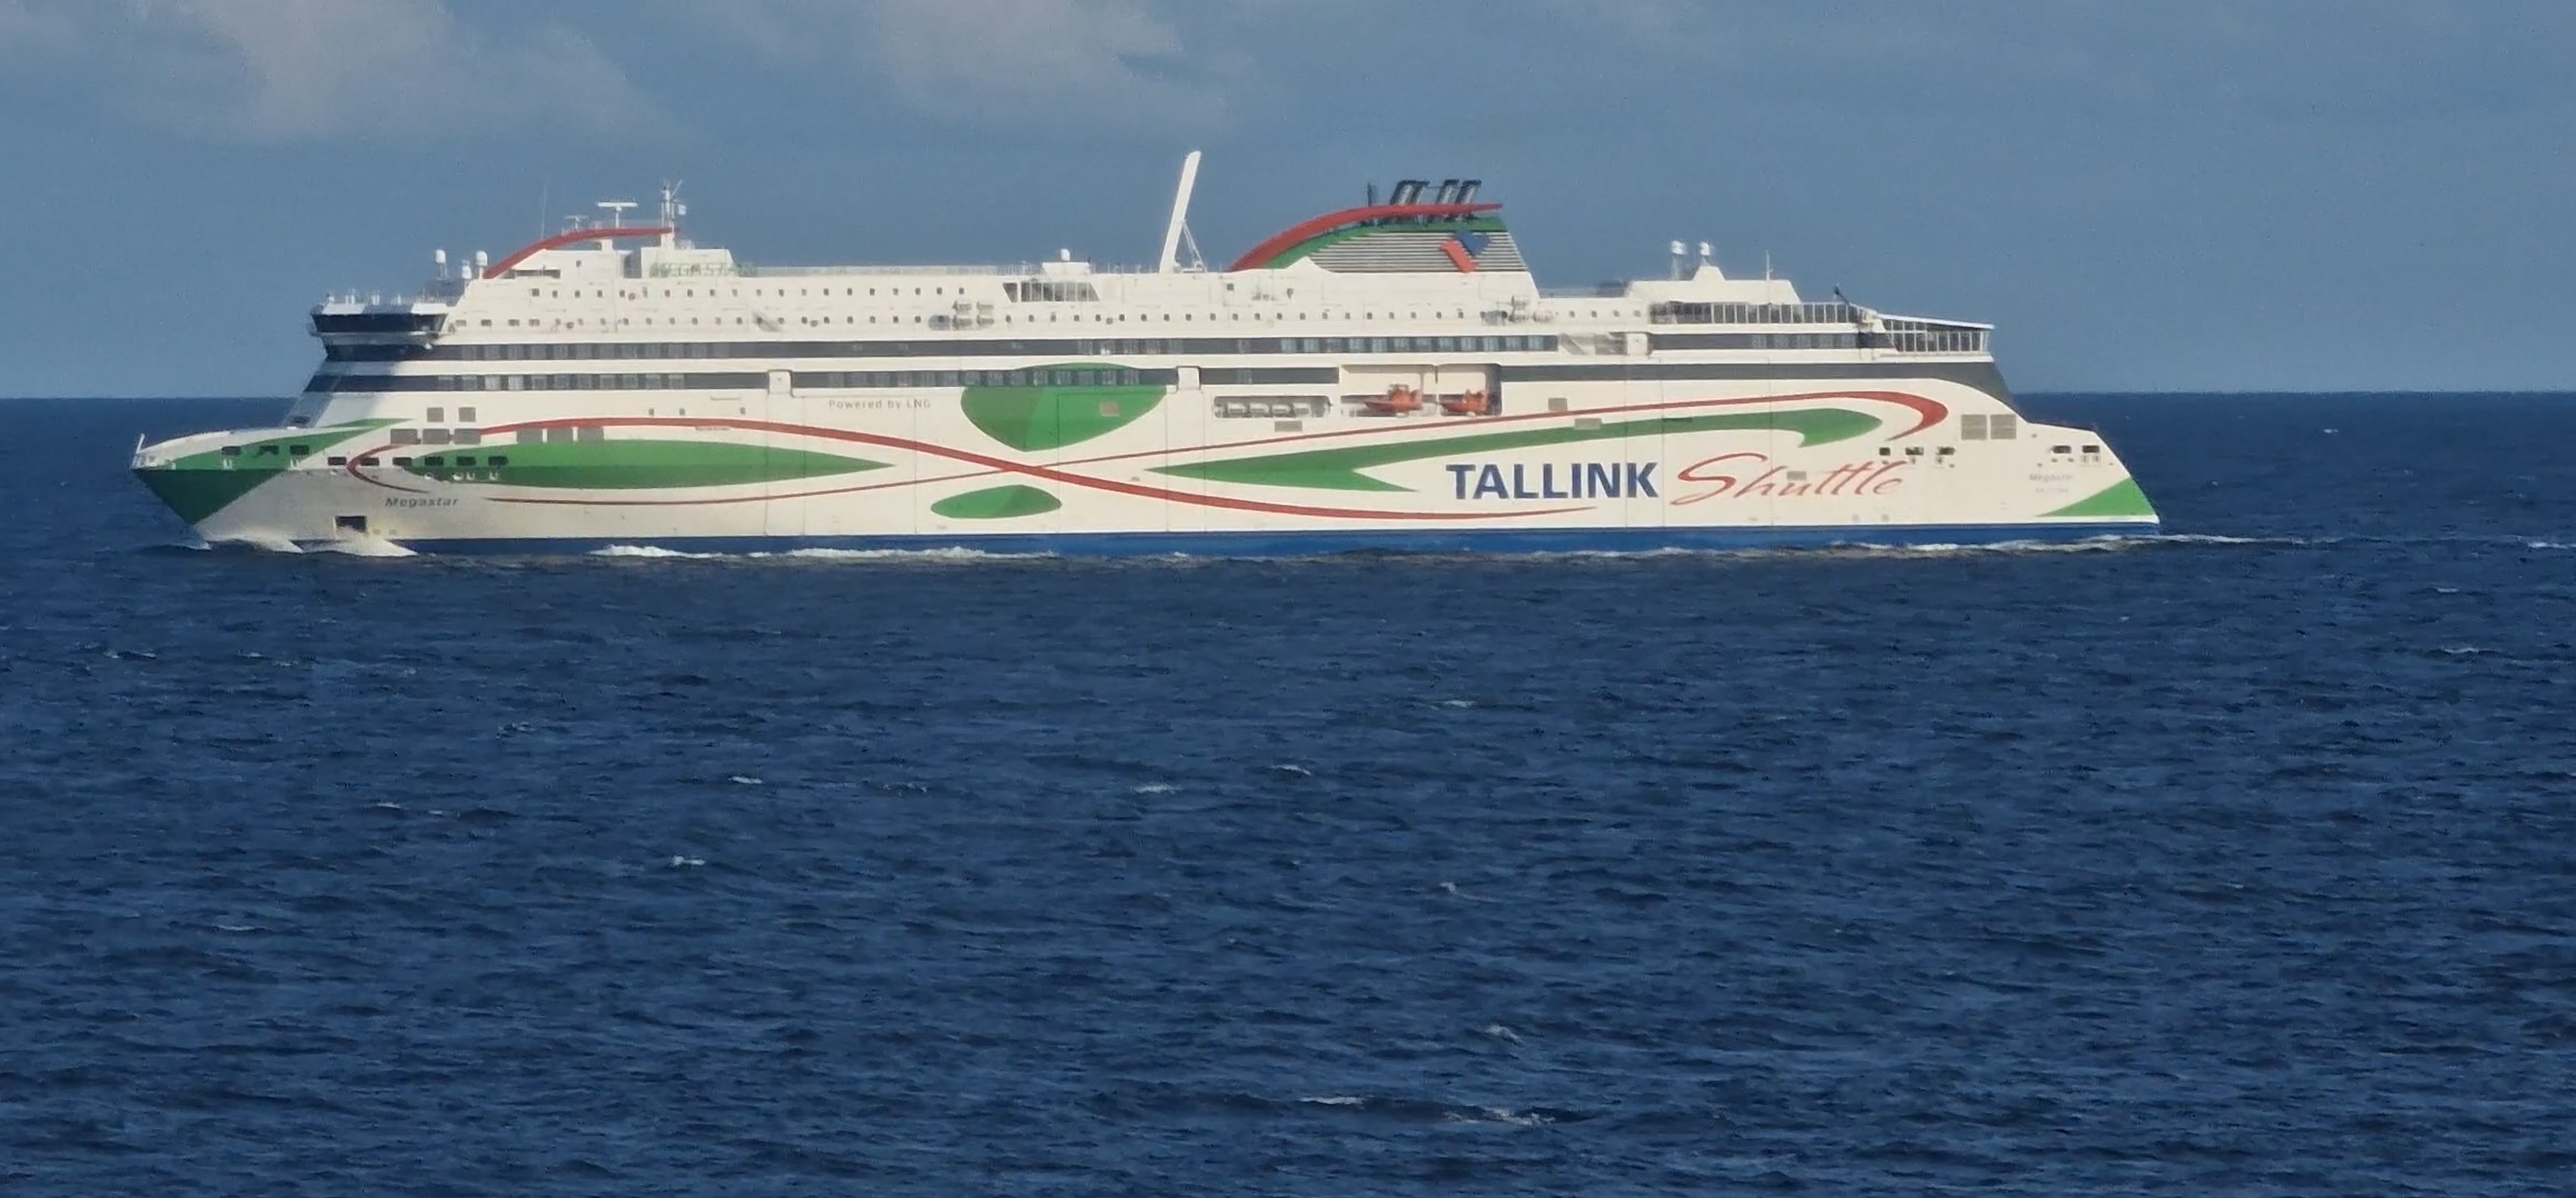
The ship currently uses MMSI 276829000. The locations dataset has 3,379 readings from the ship over the two weeks I was following the feed.
SELECT COUNT(*)
FROM   vessel_locations
WHERE  mmsi = 276829000; -- 3379
Below is a breakdown by the number of records per day.
SELECT   ts::DATE,
         COUNT(*)
FROM     vessel_locations
WHERE    mmsi = 276829000
GROUP BY 1
ORDER BY 1;
┌──────────────────┬──────────────┐
│ CAST(ts AS DATE) │ count_star() │
│       date       │    int64     │
├──────────────────┼──────────────┤
│ 2024-08-22       │          185 │
│ 2024-08-23       │          287 │
│ 2024-08-24       │          288 │
│ 2024-08-25       │          288 │
│ 2024-08-26       │          287 │
│ 2024-08-27       │          288 │
│ 2024-08-28       │          282 │
│ 2024-08-29       │          239 │
│ 2024-08-30       │          288 │
│ 2024-08-31       │          288 │
│ 2024-09-01       │          288 │
│ 2024-09-02       │          288 │
│ 2024-09-03       │           83 │
├──────────────────┴──────────────┤
│ 13 rows               2 columns │
└─────────────────────────────────┘
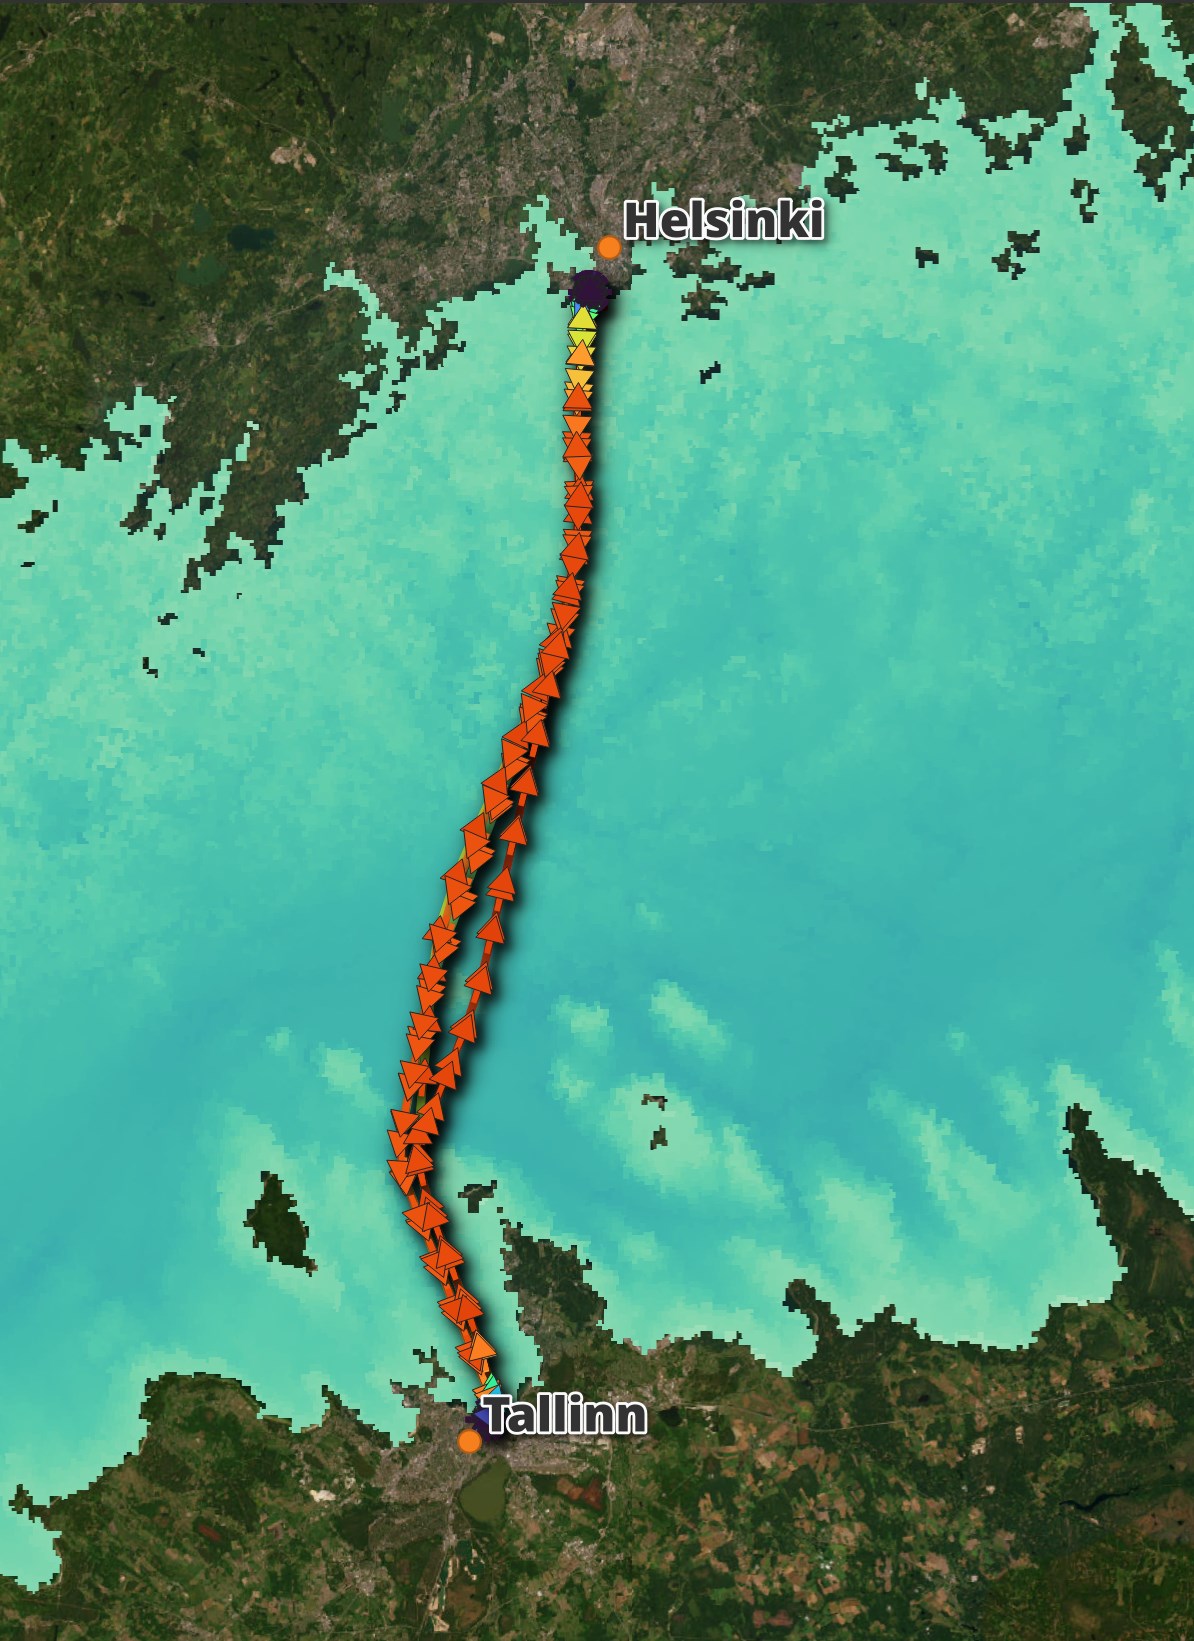
I'll export the positions from yesterday's voyage into a GeoPackage (GPKG) file.
COPY (
    SELECT *
    FROM   vessel_locations
    WHERE  mmsi = 276829000
    AND    ts::DATE = '2024-09-02'::DATE
) TO 'vessel-locations.megastar.gpkg'
    WITH (FORMAT GDAL,
          DRIVER 'GPKG',
          LAYER_CREATION_OPTIONS 'WRITE_BBOX=YES');
Below are the paths it took on its voyages between Tallinn and Helsinki. The journey takes around two hours so it's able to make multiple return trips a day. Helsinki is to the North of the Gulf of Finland and Tallinn is to the South.
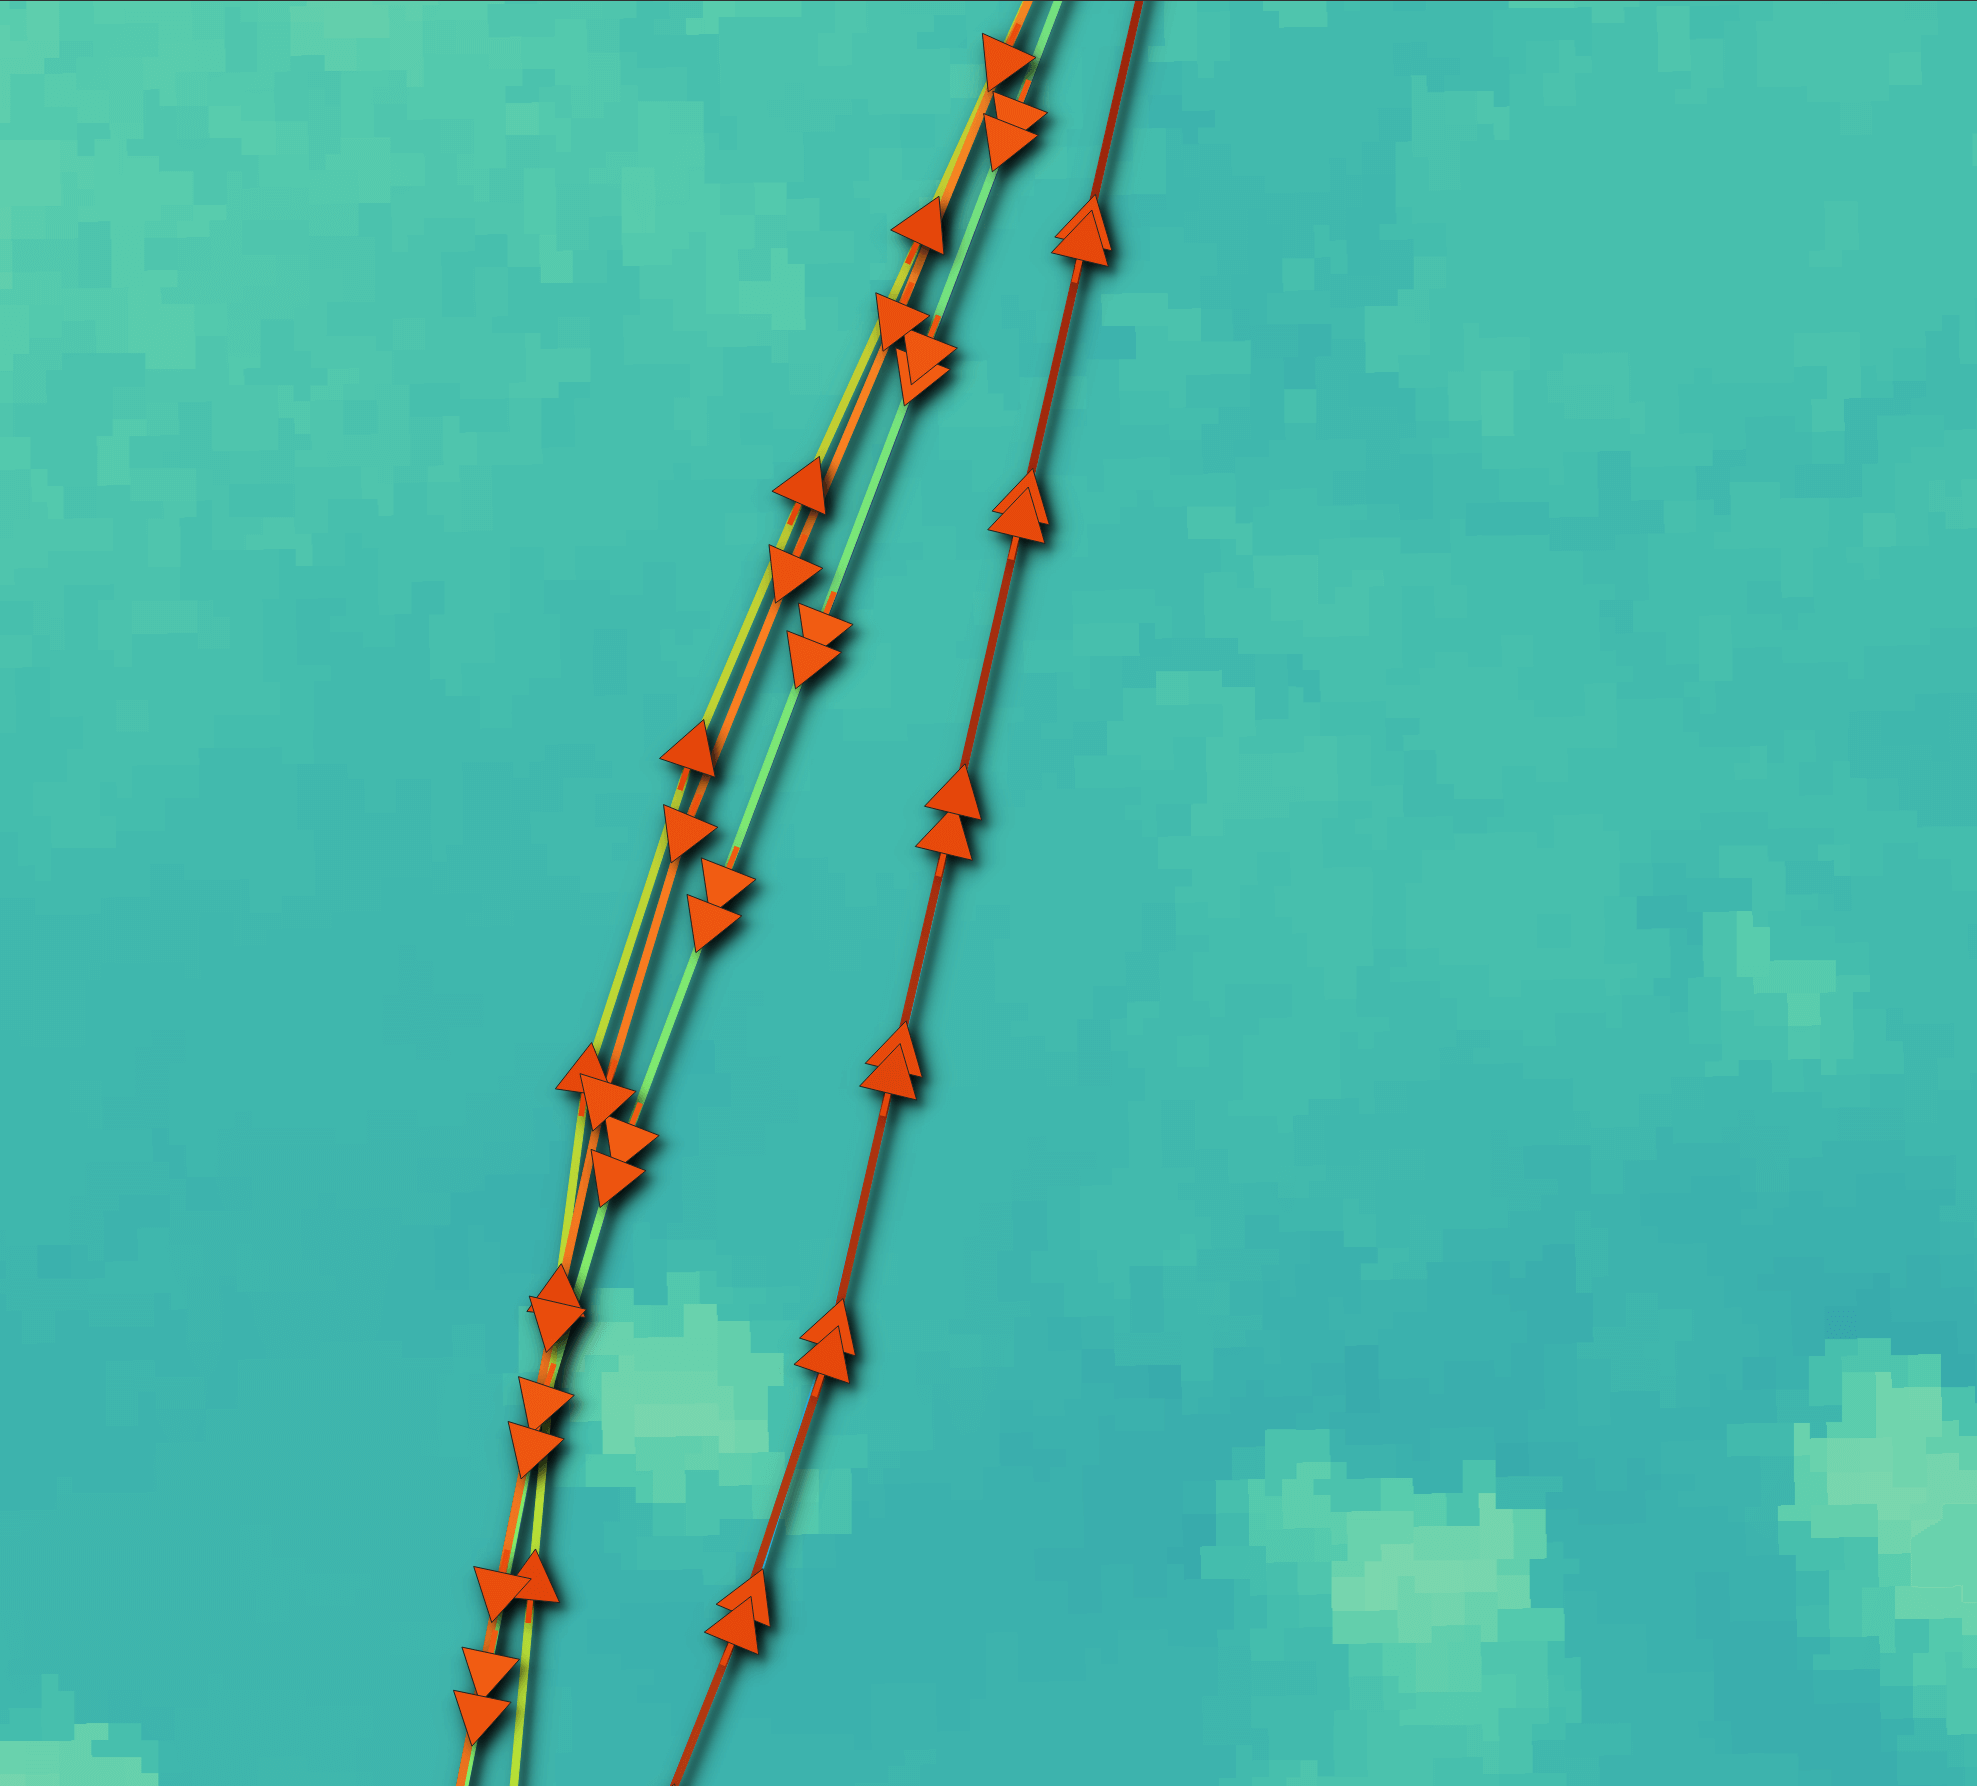
When you zoom in you can see each individual journey and the trajectory arrows stop overlapping so much.
The Port Calls Feed
There were 15,691 port calls in this feed over two weeks. There can be several records within a few minutes of one another when a port call is made. Below is the breakdown of Megastar's port calls for August 23rd.
$ gunzip -c port-calls.2024.*.json.gz \
    | jq -c '.portCalls[]' \
    > port-calls.json
SELECT   portCallTimestamp::DATE AS date_,
         DATE_PART('hour', portCallTimestamp::TIMESTAMP) AS hour_,
         portCallId,
         COUNT(*) AS num_recs
FROM     READ_JSON('port-calls.json')
WHERE    mmsi = 276829000
AND      date_ = '2024-08-23'::DATE
GROUP BY 1, 2, 3
ORDER BY 1, 2, 3;
┌────────────┬───────┬────────────┬──────────┐
│   date_    │ hour_ │ portCallId │ num_recs │
│    date    │ int64 │   int64    │  int64   │
├────────────┼───────┼────────────┼──────────┤
│ 2024-08-23 │     2 │    3145389 │        1 │
│ 2024-08-23 │     5 │    3145389 │        4 │
│ 2024-08-23 │    11 │    3145447 │        4 │
│ 2024-08-23 │    14 │    3145452 │        1 │
│ 2024-08-23 │    17 │    3145452 │        4 │
│ 2024-08-23 │    19 │    3145403 │        1 │
│ 2024-08-23 │    22 │    3145403 │        1 │
└────────────┴───────┴────────────┴──────────┘
Below is one of Megastar's port call records.
$ grep 276829000 port-calls.json \
    | head -n1 \
    | jq -S .
{
  "agentInfo": [
    {
      "ediNumber": "003701142967",
      "name": "Tallink Silja Oy",
      "portCallDirection": "Arrival or whole PortCall",
      "role": 1
    },
    {
      "ediNumber": null,
      "name": "Tallink Silja Oy",
      "portCallDirection": "Arrival or whole PortCall",
      "role": 2
    }
  ],
  "arrivalWithCargo": true,
  "certificateEndDate": "2027-06-06T21:00:00.000+00:00",
  "certificateIssuer": "EE/Eesti vabariik",
  "certificateStartDate": "2022-06-01T21:00:00.000+00:00",
  "currentSecurityLevel": 1,
  "customsReference": "4/00279891",
  "discharge": 1,
  "domesticTrafficArrival": false,
  "domesticTrafficDeparture": false,
  "forwarderNameArrival": " ",
  "forwarderNameDeparture": " ",
  "freeTextArrival": " ",
  "freeTextDeparture": " ",
  "imoInformation": [
    {
      "briefParticularsVoyage": "eetll-eetll",
      "cargoDeclarationOb": 1,
      "crewListsOb": 0,
      "crewsEffectsDeclarationsOb": 0,
      "healthDeclarationsOb": 0,
      "imoGeneralDeclaration": "Arrival",
      "numberOfCrew": 188,
      "numberOfPassangers": 182,
      "passangerListsOb": 0,
      "portOfDischarge": " ",
      "shipStoresDeclarationsOb": 0
    },
    {
      "briefParticularsVoyage": "eetll-eetll",
      "cargoDeclarationOb": 1,
      "crewListsOb": 0,
      "crewsEffectsDeclarationsOb": 0,
      "healthDeclarationsOb": 0,
      "imoGeneralDeclaration": "Departure",
      "numberOfCrew": 188,
      "numberOfPassangers": 796,
      "passangerListsOb": 0,
      "portOfDischarge": " ",
      "shipStoresDeclarationsOb": 0
    }
  ],
  "imoLloyds": 9773064,
  "managementNameArrival": " ",
  "managementNameDeparture": " ",
  "mmsi": 276829000,
  "nationality": "EE",
  "nextPort": "EETLL",
  "notLoading": false,
  "portAreaDetails": [
    {
      "arrivalDraught": 0,
      "ata": "2024-08-21T21:35:00.000+00:00",
      "ataSource": "Port",
      "ataTimestamp": "2024-08-22T04:38:04.000+00:00",
      "atd": "2024-08-22T04:15:00.000+00:00",
      "atdSource": "Port",
      "atdTimestamp": "2024-08-22T04:38:04.000+00:00",
      "berthCode": "LJ7",
      "berthName": "Jätkän laituripaikka 7",
      "departureDraught": 0,
      "eta": "2024-08-21T21:30:00.000+00:00",
      "etaSource": "Agent",
      "etaTimestamp": "2024-08-04T06:40:07.000+00:00",
      "etd": "2024-08-22T04:30:00.000+00:00",
      "etdSource": "Agent",
      "etdTimestamp": "2024-08-04T06:40:40.000+00:00",
      "portAreaCode": "LS",
      "portAreaName": "Länsisatama"
    }
  ],
  "portCallId": 3145381,
  "portCallTimestamp": "2024-08-22T05:30:06.000+00:00",
  "portToVisit": "FIHEL",
  "prevPort": "EETLL",
  "radioCallSign": "ESKL",
  "radioCallSignType": "real",
  "shipMasterArrival": "",
  "shipMasterDeparture": "",
  "vesselName": "Megastar",
  "vesselNamePrefix": "ms",
  "vesselTypeCode": 20
}
The Vessel Details Feed
There were only 61 vessels in this feed over the space of two weeks.
$ gunzip -c vessel-details.2024.*.json.gz \
    | jq '.[]' \
    | jq -c '[.name,.mmsi]' \
    | sort \
    | uniq \
    | wc -l # 61
It could be this is only when details change or a new vessel is being announced. I'll need to look into this further.
Below is an example record.
$ gunzip -c vessel-details.2024.08.22.11.53.28.json.gz \
    | jq -S '.[0]'
{
  "dataSource": "Portnet",
  "imoLloyds": 9534456,
  "mmsi": 0,
  "name": "Finn III",
  "namePrefix": "ms",
  "radioCallSign": "V2HX8",
  "radioCallSignType": "REAL",
  "updateTimestamp": "2024-08-22T06:45:14.000+00:00",
  "vesselConstruction": {
    "ballastTank": false,
    "doubleBottom": false,
    "iceClassCode": "II",
    "iceClassEndDate": "2026-11-20T22:00:00.000+00:00",
    "iceClassIssueDate": "2024-04-22T21:00:00.000+00:00",
    "iceClassIssuePlace": "Eemshaven",
    "inertGasSystem": false,
    "vesselTypeCode": 70,
    "vesselTypeName": "Dry cargo vessel"
  },
  "vesselDimensions": {
    "breadth": 17.8,
    "dateOfIssue": "2024-04-22T21:00:00.000+00:00",
    "deathWeight": 10028,
    "draught": 7.82,
    "enginePower": " ",
    "grossTonnage": 6693,
    "height": 0,
    "length": 0,
    "maxSpeed": null,
    "netTonnage": 3441,
    "overallLength": 116.26,
    "tonnageCertificateIssuer": "Eemshaven"
  },
  "vesselId": 99991721,
  "vesselRegistration": {
    "nationality": "AG",
    "portOfRegistry": "St. John's"
  },
  "vesselSystem": {
    "shipEmail": " ",
    "shipOwner": " ",
    "shipTelephone1": " ",
    "shipVerifier": "LIVI"
  }
}