Global Streetscapes is a ten-million-row dataset labelling over 300 characteristics of community-sourced street view imagery from 688 cities around the world. These characteristics include how beautiful or boring a street is, what objects are visible and generally what kind of the image was taken in (on a bridge, in a residential neighbourhood, on a forest road, etc..)
The source imagery was provided by the Mapillary and KartaView projects.
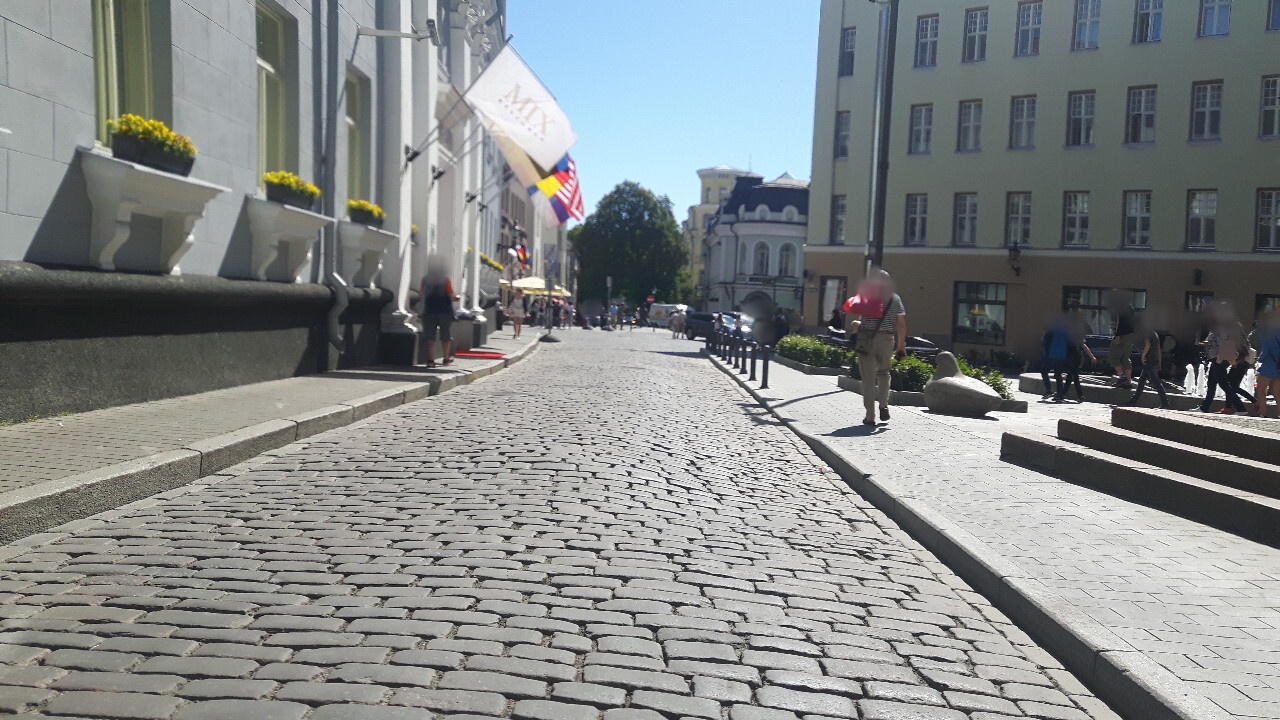
Below is an example image that was used in this dataset.
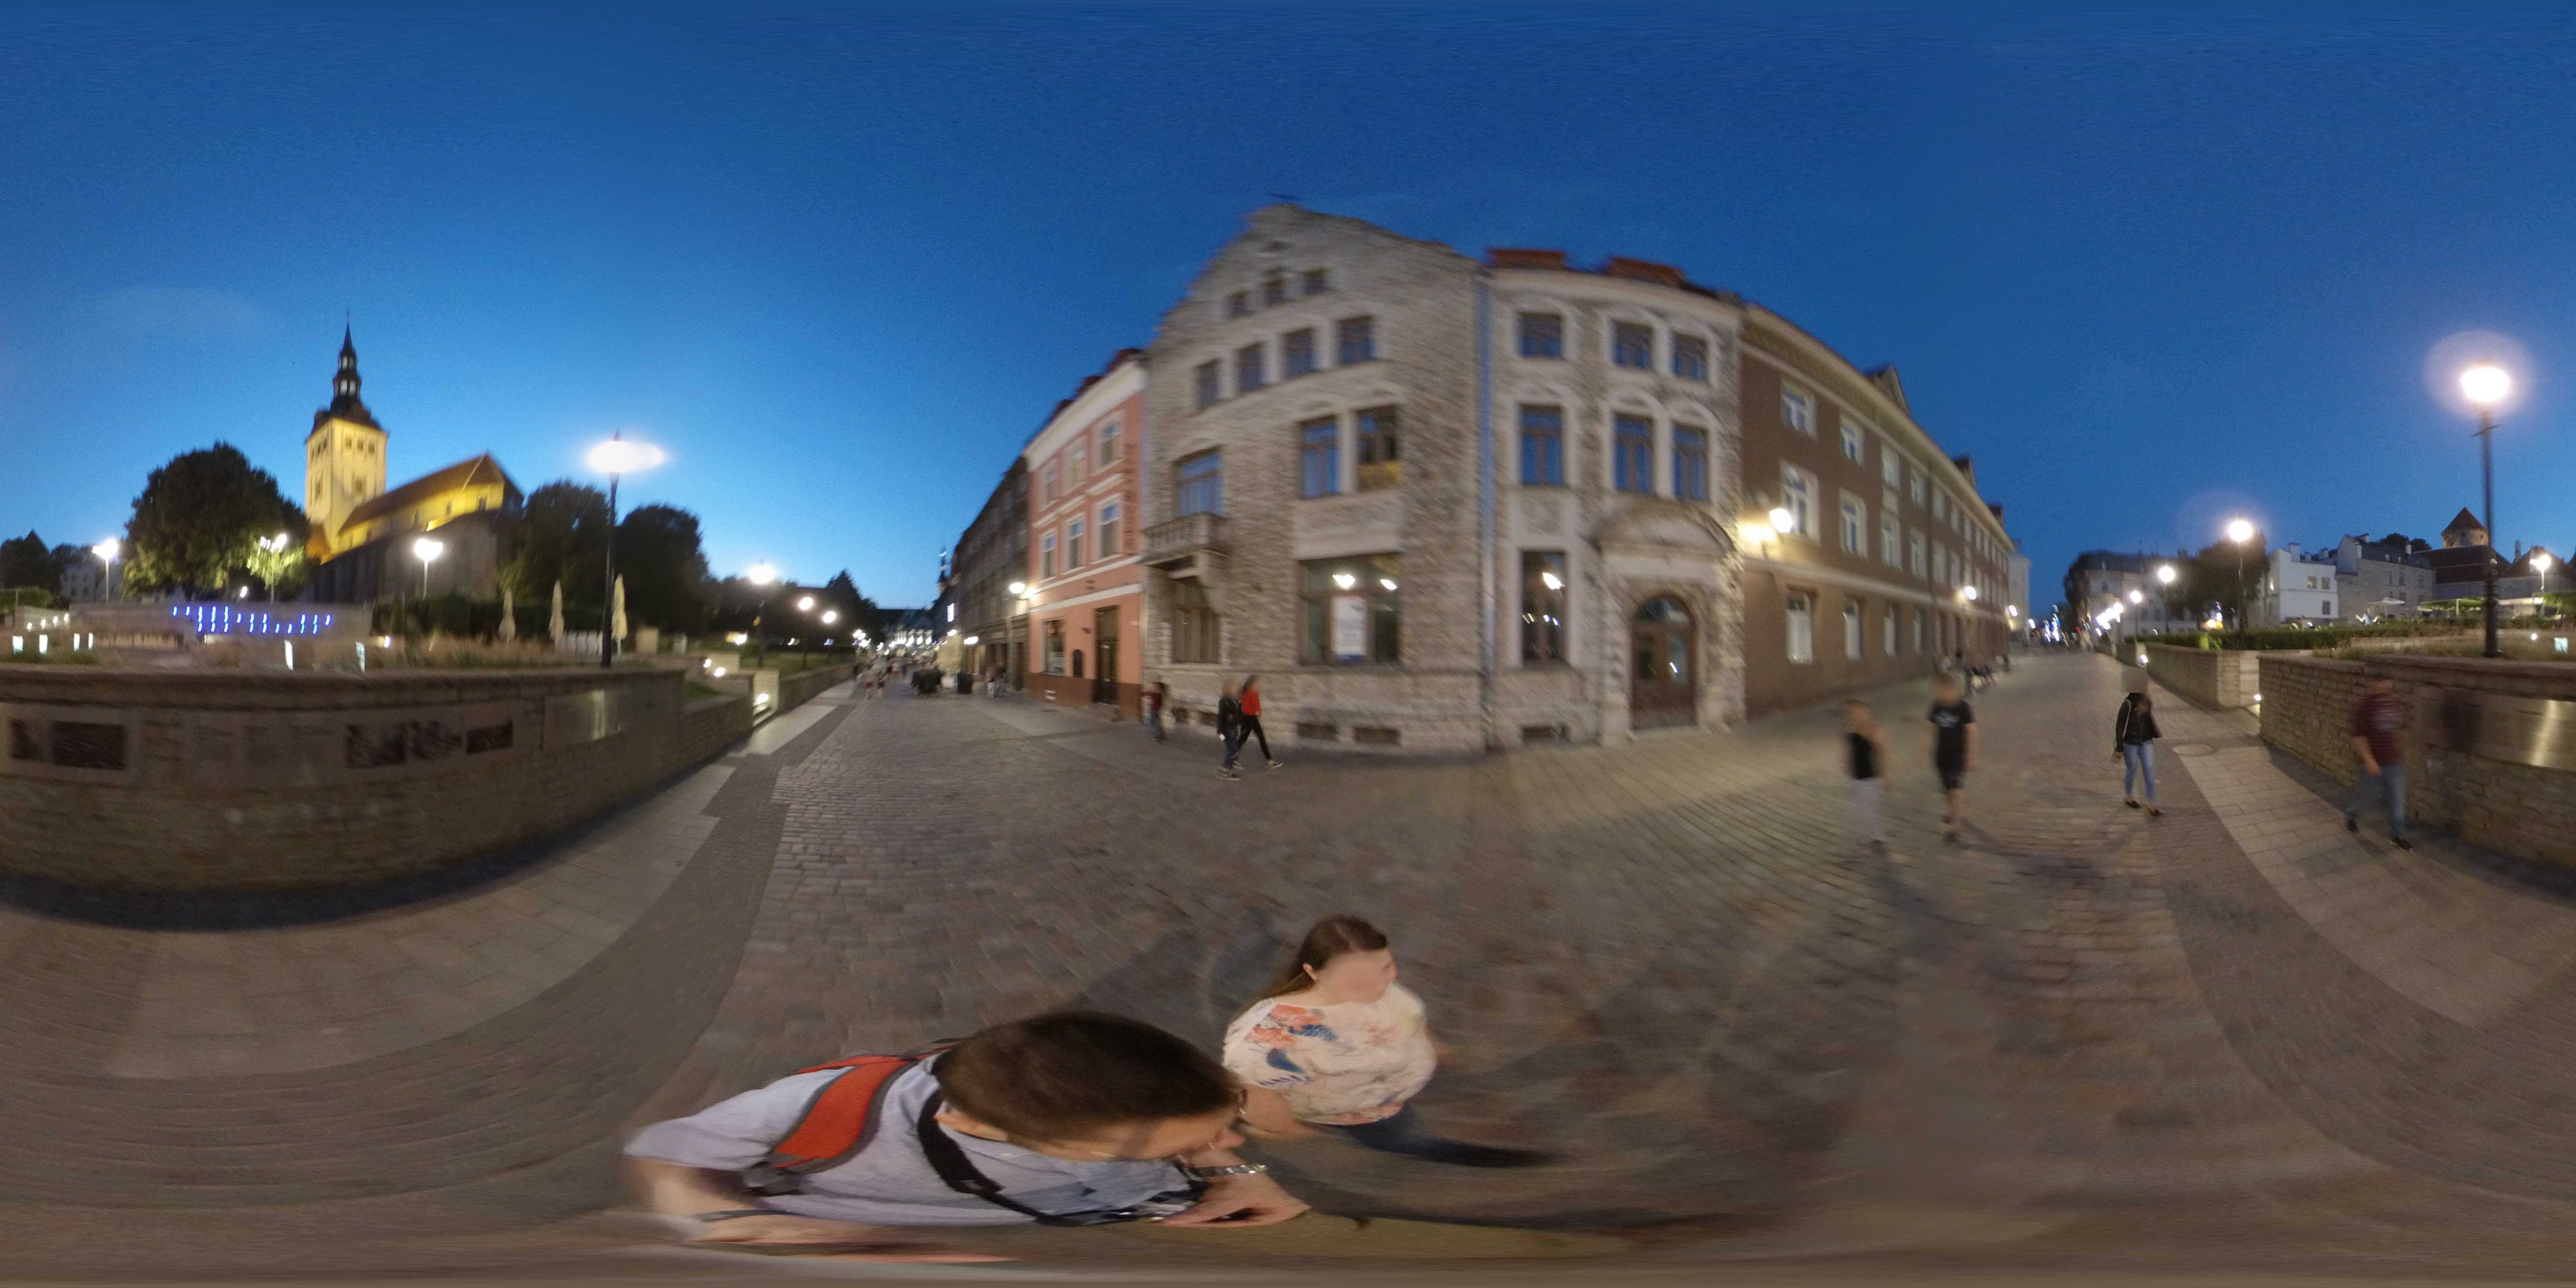
Collection of imagery happened at all hours of the day, and time of year with a diverse set of camera equipment and vehicles used. Below is a panoramic shot taken in Tallinn's Old Town.
The code for the models that were run on the imagery as well as URLs to each of the 10M images used that produced this dataset and all of the model inference results have been made publicly available.
In this post, I'll download and examine Global Streetscapes' dataset.
My Workstation
I'm using a 6 GHz Intel Core i9-14900K CPU. It has 8 performance cores and 16 efficiency cores with a total of 32 threads and 32 MB of L2 cache. It has a liquid cooler attached and is housed in a spacious, full-sized, Cooler Master HAF 700 computer case. I've come across videos on YouTube where people have managed to overclock the i9-14900KF to 9.1 GHz.
The system has 96 GB of DDR5 RAM clocked at 6,000 MT/s and a 5th-generation, Crucial T700 4 TB NVMe M.2 SSD which can read at speeds up to 12,400 MB/s. There is a heatsink on the SSD to help keep its temperature down. This is my system's C drive.
The system is powered by a 1,200-watt, fully modular, Corsair Power Supply and is sat on an ASRock Z790 Pro RS Motherboard.
I'm running Ubuntu 22 LTS via Microsoft's Ubuntu for Windows on Windows 11 Pro. In case you're wondering why I don't run a Linux-based desktop as my primary work environment, I'm still using an Nvidia GTX 1080 GPU which has better driver support on Windows and I use ArcGIS Pro from time to time which only supports Windows natively.
Installing Prerequisites
I'll be using Python and a few other tools to help analyse the data in this post.
$ sudo apt update
$ sudo apt install \
    git \
    git-lfs \
    jq \
    python3-pip \
    python3-virtualenv
I'll set up a Python Virtual Environment and install some dependencies.
$ virtualenv ~/.streets
$ source ~/.streets/bin/activate

$ python -m pip install \
    duckdb
I'll also use DuckDB, along with its H3, JSON, Parquet and Spatial extensions, in this post.
$ cd ~
$ wget -c https://github.com/duckdb/duckdb/releases/download/v1.0.0/duckdb_cli-linux-amd64.zip
$ unzip -j duckdb_cli-linux-amd64.zip
$ chmod +x duckdb
$ ~/duckdb
INSTALL h3 FROM community;
INSTALL json;
INSTALL parquet;
INSTALL spatial;
I'll set up DuckDB to load every installed extension each time it launches.
$ vi ~/.duckdbrc
.timer on
.width 180
LOAD h3;
LOAD json;
LOAD parquet;
LOAD spatial;
The maps in this post were rendered with QGIS version 3.38.0. QGIS is a desktop application that runs on Windows, macOS and Linux. The application has grown in popularity in recent years and has ~15M application launches from users around the world each month.
I used QGIS' Tile+ plugin to add geospatial context with Esri's World Imagery and CARTO's Basemaps to the maps.
Downloading Global Streetscapes
The following will download 37 GB of CSV data. In addition to this, the .git folder will take up another 62 GB of disk space.
$ git lfs install Git LFS initialized.
$ git lfs clone https://huggingface.co/datasets/NUS-UAL/global-streetscapes/ \
        ~/streets
Data Fluency
In the data/ folder, there are 21 uncompressed CSV files. Below is a common metadata file that lists every image across Mapillary and KartaView's image collections.
Filename                        |   Row Count | Uncompressed Size
--------------------------------|-------------|------------------
metadata_common_attributes.csv  |  10,004,552 | 2.3 GB
Below are five files specific to Mapillary's imagery.
Filename                        |   Row Count | Uncompressed Size
--------------------------------|-------------|------------------
metadata_mly1.csv               |   8,891,021 | 1.6 GB
metadata_mly2.csv               |   8,891,021 | 1.6 GB
metadata_mly3.csv               |   8,891,021 | 913 MB
metadata_mly4.csv               |   8,891,021 | 3.0 GB
metadata_mly5.csv               |   8,891,021 | 2.8 GB
Below is KartaView's imagery metadata.
Filename                        |   Row Count | Uncompressed Size
--------------------------------|-------------|------------------
metadata_kv.csv                 |   1,113,532 | 1.3 GB
Below are 14 CSVs containing metadata and the inference results of the various models the Global Streetscapes project ran against Mapillary and KartaView's imagery.
Filename                        |   Row Count | Uncompressed Size
--------------------------------|-------------|------------------
climate.csv                     |  10,004,552 | 947 MB
contextual.csv                  |  10,004,552 | 1.1 GB
ephem.csv                       |  10,004,552 | 924 MB
gadm.csv                        |  10,004,552 | 2.2 GB
ghsl.csv                        |  10,004,552 | 761 MB
h3.csv                          |  10,004,552 | 3.0 GB
instances.csv                   |  10,004,458 | 3.1 GB
osm.csv                         |  10,004,552 | 2.0 GB
perception.csv                  |  10,004,552 | 897 MB
places365.csv                   |  10,004,552 | 699 MB
season.csv                      |  10,004,552 | 669 MB
segmentation.csv                |  10,004,540 | 3.7 GB
simplemaps.csv                  |  10,004,552 | 1.5 GB
speed.csv                       |  10,004,552 | 2.7 GB
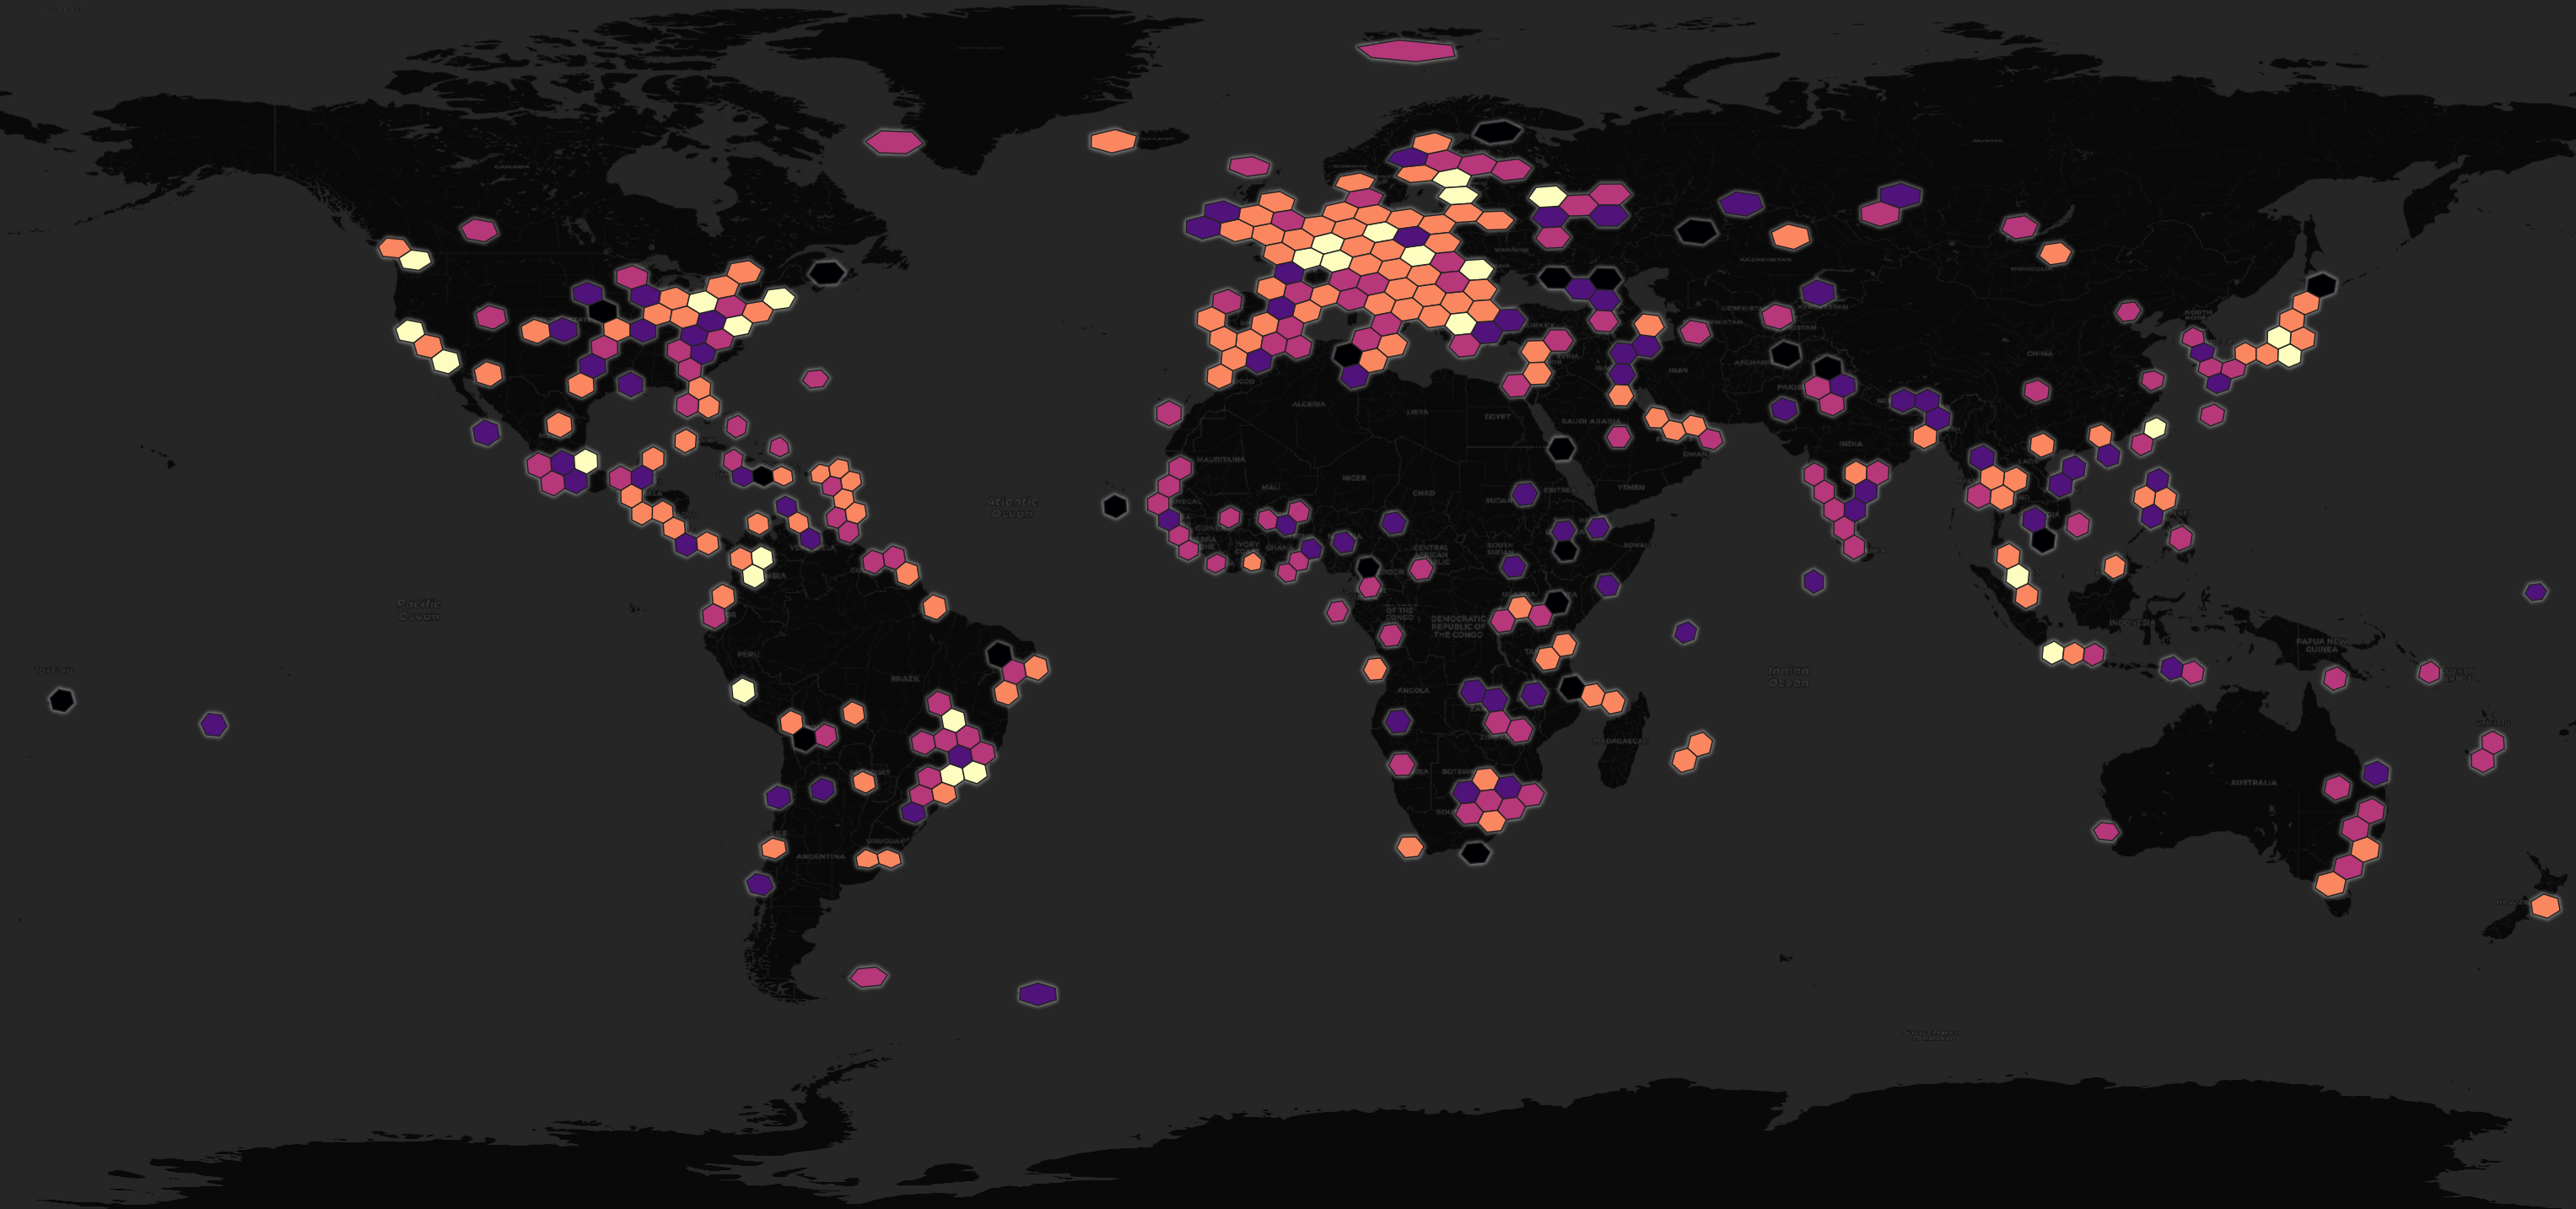
There is a good amount of geographical diversity in this dataset.
$ ~/duckdb
COPY (
    SELECT   h3_cell_to_boundary_wkt(
                    h3_latlng_to_cell(lat, lon, 2))::geometry geom,
             COUNT(*) AS num_recs
    FROM     READ_CSV('metadata_common_attributes.csv')
    WHERE    lon > -175
    AND      lon < 175
    GROUP BY 1
) TO 'h3_2.gpkg'
    WITH (FORMAT GDAL,
          DRIVER 'GPKG',
          LAYER_CREATION_OPTIONS 'WRITE_BBOX=YES');
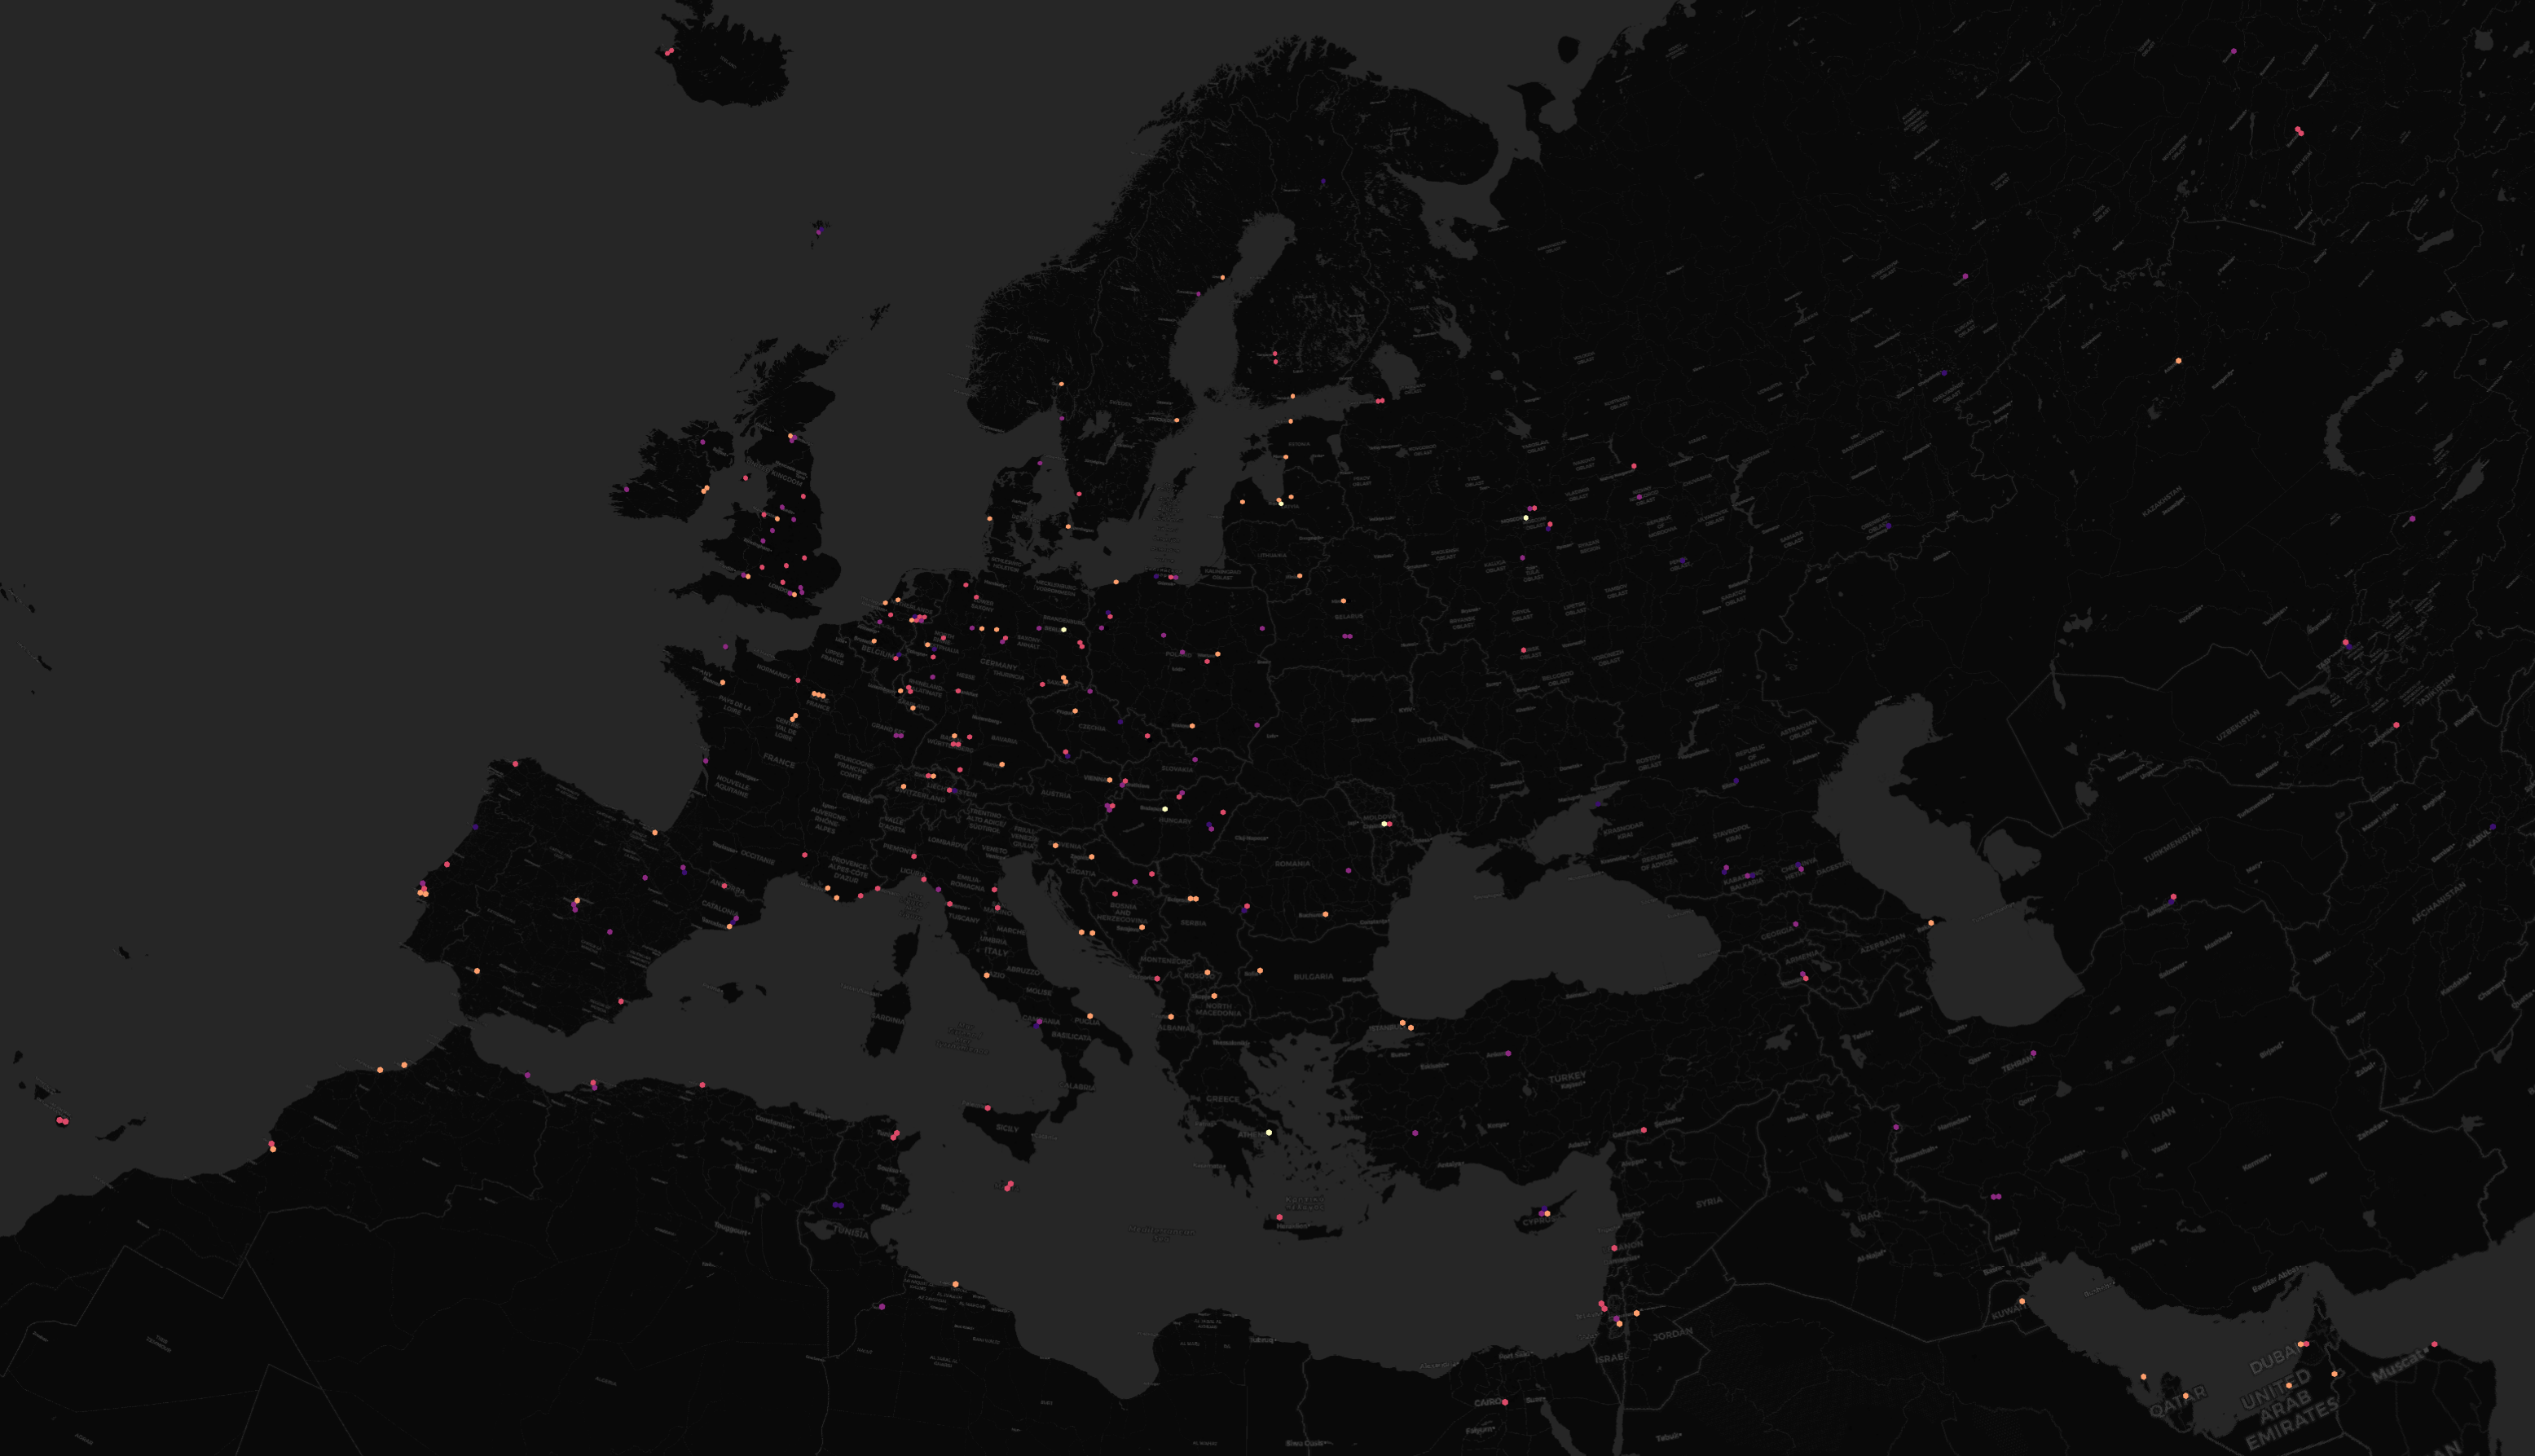
When zooming into Europe though, you can see almost all the imagery is from dense, urban areas. These urban areas also tend to be places people live rather than visit. Only one of the Canary Islands is represented while none of the Balearic Islands are to be found in any of the source imagery.
COPY (
    SELECT   h3_cell_to_boundary_wkt(
                  h3_latlng_to_cell(lat, lon, 5))::geometry geom,
             COUNT(*) AS num_recs
    FROM     READ_CSV('metadata_common_attributes.csv')
    WHERE    lon > -175
    AND      lon < 175
    GROUP BY 1
) TO 'h3.gpkg'
    WITH (FORMAT GDAL,
          DRIVER 'GPKG',
          LAYER_CREATION_OPTIONS 'WRITE_BBOX=YES');
Estonian Imagery
Almost all Estonian imagery is from the Mapillary project.
$ ~/duckdb
WITH a AS (
    SELECT   source,
             year,
             COUNT(*) records
    FROM     READ_CSV('metadata_common_attributes.csv')
    WHERE    lon > 21.3314 AND lon < 28.2156
    AND      lat > 57.7385 AND lat < 59.6237
    GROUP BY 1, 2
)
PIVOT    a
ON       source
USING    SUM(records)
GROUP BY year
ORDER BY year;
┌───────┬───────────┬───────────┐
│ year  │ KartaView │ Mapillary │
│ int64 │  int128   │  int128   │
├───────┼───────────┼───────────┤
│  2010 │           │         1 │
│  2011 │           │         1 │
│  2012 │           │         1 │
│  2013 │           │        14 │
│  2014 │           │       374 │
│  2015 │           │      3085 │
│  2016 │       169 │       276 │
│  2017 │       110 │       288 │
│  2018 │      2219 │      4737 │
│  2019 │           │     23222 │
│  2020 │           │     14928 │
│  2021 │       255 │     14162 │
│  2022 │           │     37458 │
│  2023 │           │      1874 │
├───────┴───────────┴───────────┤
│ 14 rows             3 columns │
└───────────────────────────────┘
I'll build a GeoPackage (GPKG) file with the Estonian Imagery and the metadata and model inference results bundled together. I'll first isolate the metadata records for Estonia from the other 10M records in this dataset.
$ echo "CREATE OR REPLACE TABLE meta_ca AS
            SELECT *
            FROM   READ_CSV('metadata_common_attributes.csv')
            WHERE  lon > 21.3314 AND lon < 28.2156
            AND    lat > 57.7385 AND lat < 59.6237" \
    | ~/duckdb streets.duckdb
Below I'll load the inference and other metadata CSVs into DuckDB. I needed a multi-million-line sample size to get around some inference issues in some of the CSV files but the 10M-line sample size creates a segment fault with segmentation CSV so for that file, I'll use a 100K-line sample size.
$ for TABLE_NAME in climate \
                    contextual \
                    ephem \
                    gadm \
                    ghsl \
                    instances \
                    osm \
                    perception \
                    places365 \
                    season \
                    segmentation \
                    simplemaps \
                    speed \
                    metadata_kv; do
      echo $TABLE_NAME

      if [ "$TABLE_NAME" == "segmentation" ]; then
         SAMPLE_SIZE=100_000
      else
         SAMPLE_SIZE=10_000_000
      fi

      echo "CREATE OR REPLACE TABLE $TABLE_NAME AS
              SELECT a.*
              FROM   READ_CSV('$TABLE_NAME.csv',
                              sample_size=$SAMPLE_SIZE) a
              JOIN   meta_ca b ON (a.source = b.source AND
                                   a.orig_id = b.orig_id);" \
          | ~/duckdb streets.duckdb
  done
KartaView's image and thumbnail URLs are accessible without an API key so I'll include them as the image and thumbnail fields. Mapillary URLs need to be signed with an API key. If this post proves popular, I'll revisit this section and look to add support for their imagery URLs as well.
$ ~/duckdb streets.duckdb
COPY (
    SELECT COLUMNS(a.* EXCLUDE (lat, lon))              AS 'meta_\0',
           ST_POINT(a.lon, a.lat)                       AS geom,
           COLUMNS(b.* EXCLUDE (uuid, source, orig_id)) AS 'climate_\0',
           COLUMNS(c.* EXCLUDE (uuid, source, orig_id)) AS 'context_\0',
           COLUMNS(d.* EXCLUDE (uuid, source, orig_id)) AS 'ephem_\0',
           COLUMNS(e.* EXCLUDE (uuid, source, orig_id)) AS 'gadm_\0',
           COLUMNS(f.* EXCLUDE (uuid, source, orig_id)) AS 'ghsl_\0',
           COLUMNS(g.* EXCLUDE (uuid, source, orig_id)) AS 'inst_\0',
           COLUMNS(h.* EXCLUDE (uuid, source, orig_id)) AS 'osm_\0',
           COLUMNS(i.* EXCLUDE (uuid, source, orig_id)) AS 'inst_\0',
           COLUMNS(j.* EXCLUDE (uuid, source, orig_id)) AS 'perception_\0',
           COLUMNS(k.* EXCLUDE (uuid, source, orig_id)) AS 'season_\0',
           COLUMNS(l.* EXCLUDE (uuid, source, orig_id)) AS 'seg_\0',
           COLUMNS(m.* EXCLUDE (uuid, source, orig_id)) AS 'simplemaps_\0',
           COLUMNS(n.* EXCLUDE (uuid, source, orig_id)) AS 'speed_\0',
           o.kv_fileurlProc                             AS image,
           o.kv_fileurlTh                               AS thumbnail
    FROM meta_ca           a
    JOIN climate           b ON (a.source = b.source AND a.orig_id = b.orig_id)
    JOIN contextual        c ON (a.source = c.source AND a.orig_id = c.orig_id)
    JOIN ephem             d ON (a.source = d.source AND a.orig_id = d.orig_id)
    JOIN gadm              e ON (a.source = e.source AND a.orig_id = e.orig_id)
    JOIN ghsl              f ON (a.source = f.source AND a.orig_id = f.orig_id)
    JOIN instances         g ON (a.source = g.source AND a.orig_id = g.orig_id)
    JOIN osm               h ON (a.source = h.source AND a.orig_id = h.orig_id)
    JOIN perception        i ON (a.source = i.source AND a.orig_id = i.orig_id)
    JOIN places365         j ON (a.source = j.source AND a.orig_id = j.orig_id)
    JOIN season            k ON (a.source = k.source AND a.orig_id = k.orig_id)
    JOIN segmentation      l ON (a.source = l.source AND a.orig_id = l.orig_id)
    JOIN simplemaps        m ON (a.source = m.source AND a.orig_id = m.orig_id)
    JOIN speed             n ON (a.source = n.source AND a.orig_id = n.orig_id)
    LEFT JOIN metadata_kv  o ON (a.source = o.source AND a.orig_id = o.orig_id)
) TO 'estonia.gpkg'
  WITH (FORMAT GDAL,
        DRIVER 'GPKG',
        LAYER_CREATION_OPTIONS 'WRITE_BBOX=YES');
The above produced a 138 MB GPKG file with 101,461 records with 264 fields. Below is an example record.
$ echo "SELECT *
        FROM   ST_READ('estonia.gpkg')
        WHERE  meta_orig_id = 1352139489
        LIMIT  1" \
    | ~/duckdb -json \
    | grep '\[' \
    | jq -S .
[
  {
    "climate_koppen_geiger_zone": "Dfb",
    "climate_zone_description": "Humid continental, no dry season, warm summer",
    "context_glare": "no",
    "context_lighting_condition": "day",
    "context_pano_status": false,
    "context_platform": "walking surface",
    "context_quality": "good",
    "context_reflection": "no",
    "context_view_direction": "front/back",
    "context_weather": "clear",
    "ephem_calculated_day_night": "day",
    "ephem_hrs_aft_sunrise": null,
    "ephem_hrs_aft_sunset": -6.81,
    "ephem_timezone": "Europe/Tallinn",
    "ephem_utc_offset_s": 10800,
    "gadm_CC_1": null,
    "gadm_CC_2": null,
    "gadm_CC_3": null,
    "gadm_CC_4": null,
    "gadm_CC_5": null,
    "gadm_COUNTRY": "Estonia",
    "gadm_ENGTYPE_1": "County",
    "gadm_ENGTYPE_2": "Town",
    "gadm_ENGTYPE_3": "Administrative District",
    "gadm_ENGTYPE_4": null,
    "gadm_ENGTYPE_5": null,
    "gadm_GID_0": "EST",
    "gadm_GID_1": "EST.1_1",
    "gadm_GID_2": "EST.1.20_1",
    "gadm_GID_3": "EST.1.20.3_1",
    "gadm_GID_4": null,
    "gadm_GID_5": null,
    "gadm_HASC_1": "EE.HA",
    "gadm_HASC_2": "EE.HA.TA",
    "gadm_HASC_3": null,
    "gadm_ISO_1": null,
    "gadm_NAME_1": "Harju",
    "gadm_NAME_2": "Tallinn",
    "gadm_NAME_3": "Kesklinna",
    "gadm_NAME_4": null,
    "gadm_NAME_5": null,
    "gadm_NL_NAME_1": null,
    "gadm_NL_NAME_2": null,
    "gadm_NL_NAME_3": null,
    "gadm_TYPE_1": "Maakond",
    "gadm_TYPE_2": "Linn",
    "gadm_TYPE_3": "Linnaosa",
    "gadm_TYPE_4": null,
    "gadm_TYPE_5": null,
    "gadm_VARNAME_1": "Harjumaa|Harju maakond",
    "gadm_VARNAME_2": null,
    "gadm_VARNAME_3": null,
    "gadm_VARNAME_4": null,
    "geom": "POINT (24.750618 59.443103)",
    "ghsl_urban_code": 30,
    "ghsl_urban_term": "urban centre",
    "image": "https://storage13.openstreetcam.org/files/photo/2021/8/1/proc/3754065_7b4fc0ea36f23b810adcc38e2559295c.jpg",
    "inst_Banner": 1,
    "inst_Barrier": 0,
    "inst_Beautiful": 8.48,
    "inst_Bench": 0,
    "inst_Bicycle": 0,
    "inst_Bicyclist": 0,
    "inst_Bike-Lane": 0,
    "inst_Bike-Rack": 0,
    "inst_Billboard": 3,
    "inst_Bird": 0,
    "inst_Boat": 0,
    "inst_Boring": 8.34,
    "inst_Bridge": 0,
    "inst_Building": 1,
    "inst_Bus": 0,
    "inst_CCTV-Camera": 0,
    "inst_Car": 5,
    "inst_Car-Mount": 0,
    "inst_Caravan": 0,
    "inst_Catch-Basin": 0,
    "inst_Crosswalk---Plain": 0,
    "inst_Curb": 0,
    "inst_Curb-Cut": 0,
    "inst_Depressing": 3.26,
    "inst_Ego-Vehicle": 0,
    "inst_Fence": 0,
    "inst_Fire-Hydrant": 0,
    "inst_Ground-Animal": 0,
    "inst_Guard-Rail": 0,
    "inst_Junction-Box": 0,
    "inst_Lane-Marking---Crosswalk": 0,
    "inst_Lane-Marking---General": 0,
    "inst_Lively": 8.61,
    "inst_Mailbox": 0,
    "inst_Manhole": 0,
    "inst_Motorcycle": 0,
    "inst_Motorcyclist": 0,
    "inst_Mountain": 0,
    "inst_On-Rails": 0,
    "inst_Other-Rider": 0,
    "inst_Other-Vehicle": 0,
    "inst_Parking": 0,
    "inst_Pedestrian-Area": 0,
    "inst_Person": 1,
    "inst_Phone-Booth": 0,
    "inst_Pole": 8,
    "inst_Pothole": 0,
    "inst_Rail-Track": 0,
    "inst_Road": 1,
    "inst_Safe": 8.45,
    "inst_Sand": 0,
    "inst_Service-Lane": 0,
    "inst_Sidewalk": 1,
    "inst_Sky": 1,
    "inst_Snow": 0,
    "inst_Street-Light": 0,
    "inst_Terrain": 1,
    "inst_Traffic-Light": 0,
    "inst_Traffic-Sign-(Back)": 0,
    "inst_Traffic-Sign-(Front)": 0,
    "inst_Traffic-Sign-Frame": 0,
    "inst_Trailer": 0,
    "inst_Trash-Can": 0,
    "inst_Truck": 0,
    "inst_Tunnel": 0,
    "inst_Utility-Pole": 0,
    "inst_Vegetation": 1,
    "inst_Wall": 1,
    "inst_Water": 0,
    "inst_Wealthy": 8.93,
    "inst_Wheeled-Slow": 0,
    "meta_datetime_local": "2021-08-01 14:58:52+03",
    "meta_day": 1,
    "meta_hFoV": 66.487946,
    "meta_heading": 301.18,
    "meta_height": 1936,
    "meta_hour": 14,
    "meta_month": 8,
    "meta_orig_id": 1352139489,
    "meta_projection_type": "perspective",
    "meta_sequence_id": "3754065",
    "meta_sequence_img_count": 10,
    "meta_sequence_index": 9,
    "meta_source": "KartaView",
    "meta_uuid": "c09f4824-6cd9-44a2-a9b3-995ddd4940ea",
    "meta_vFoV": 52.171415353124,
    "meta_width": 2592,
    "meta_year": 2021,
    "osm_access": null,
    "osm_area": null,
    "osm_bridge": null,
    "osm_est_width": null,
    "osm_from": 599735029,
    "osm_highway": "footway",
    "osm_junction": null,
    "osm_key": 0,
    "osm_lanes": null,
    "osm_length": 24.061,
    "osm_maxspeed": null,
    "osm_name": null,
    "osm_oneway": false,
    "osm_osmid": "47008731",
    "osm_ref": null,
    "osm_reversed": "True",
    "osm_road_width": null,
    "osm_service": null,
    "osm_snap_dist": 1.8750683746177468,
    "osm_to": 599735028,
    "osm_tunnel": null,
    "osm_type_highway": "walk",
    "osm_u": 599735028,
    "osm_v": 599735029,
    "perception_place": "driveway",
    "season_season": "Summer",
    "seg_Banner": 0,
    "seg_Barrier": 0,
    "seg_Bench": 0,
    "seg_Bicycle": 0,
    "seg_Bicyclist": 0,
    "seg_Bike-Lane": 0,
    "seg_Bike-Rack": 0,
    "seg_Billboard": 7532,
    "seg_Bird": 0,
    "seg_Boat": 0,
    "seg_Bridge": 0,
    "seg_Building": 137443,
    "seg_Bus": 0,
    "seg_CCTV-Camera": 0,
    "seg_Car": 21603,
    "seg_Car-Mount": 0,
    "seg_Caravan": 0,
    "seg_Catch-Basin": 0,
    "seg_Crosswalk---Plain": 0,
    "seg_Curb": 0,
    "seg_Curb-Cut": 0,
    "seg_Ego-Vehicle": 0,
    "seg_Fence": 0,
    "seg_Fire-Hydrant": 0,
    "seg_Ground-Animal": 0,
    "seg_Guard-Rail": 0,
    "seg_Junction-Box": 0,
    "seg_Lane-Marking---Crosswalk": 0,
    "seg_Lane-Marking---General": 0,
    "seg_Mailbox": 0,
    "seg_Manhole": 0,
    "seg_Motorcycle": 0,
    "seg_Motorcyclist": 0,
    "seg_Mountain": 0,
    "seg_On-Rails": 0,
    "seg_Other-Rider": 0,
    "seg_Other-Vehicle": 0,
    "seg_Parking": 0,
    "seg_Pedestrian-Area": 0,
    "seg_Person": 6203,
    "seg_Phone-Booth": 0,
    "seg_Pole": 51701,
    "seg_Pothole": 0,
    "seg_Rail-Track": 0,
    "seg_Road": 49655,
    "seg_Sand": 0,
    "seg_Service-Lane": 0,
    "seg_Sidewalk": 2607613,
    "seg_Sky": 470246,
    "seg_Snow": 0,
    "seg_Street-Light": 0,
    "seg_Terrain": 740808,
    "seg_Total": 4861260,
    "seg_Traffic-Light": 0,
    "seg_Traffic-Sign-(Back)": 0,
    "seg_Traffic-Sign-(Front)": 0,
    "seg_Traffic-Sign-Frame": 0,
    "seg_Trailer": 0,
    "seg_Trash-Can": 0,
    "seg_Truck": 0,
    "seg_Tunnel": 0,
    "seg_Utility-Pole": 0,
    "seg_Vegetation": 753096,
    "seg_Wall": 15360,
    "seg_Water": 0,
    "seg_Wheeled-Slow": 0,
    "simplemaps_admin_name": "Harjumaa",
    "simplemaps_capital": "primary",
    "simplemaps_city": "Tallinn",
    "simplemaps_city_ascii": "Tallinn",
    "simplemaps_city_id": 1233260021,
    "simplemaps_city_lat": 59.4372,
    "simplemaps_city_lon": 24.745,
    "simplemaps_continent": "Europe",
    "simplemaps_country": "Estonia",
    "simplemaps_iso2": "EE",
    "simplemaps_iso3": "EST",
    "simplemaps_population": 438341,
    "speed_avg_speed_from_prev_kph": 6.203131451725688,
    "speed_distance_from_prev_km": 0.0051692762097714,
    "speed_distance_from_prev_m": 5.169276209771407,
    "speed_segmt_speed_max5_mean_kph": null,
    "speed_segmt_speed_max_kph": null,
    "speed_segmt_speed_mean_kph": null,
    "speed_segmt_speed_var_kph2": null,
    "speed_seq_dist_km": 0.0521873813209414,
    "speed_seq_dist_m": 52.18738132094145,
    "speed_seq_img_count": 10,
    "speed_seq_speed_kph": 5.525722728099683,
    "speed_seq_time_hr": 0.0094444444444444,
    "speed_time_from_prev_hr": 0.0008333333333333,
    "speed_time_from_prev_s": 3,
    "thumbnail": "https://storage13.openstreetcam.org/files/photo/2021/8/1/th/3754065_7b4fc0ea36f23b810adcc38e2559295c.jpg"
  }
]
Thumbnails in QGIS
If you drop the estonia.gpkg file onto a new QGIS project you'll see ~100K+ points load onto the scene. Select that layer's properties and select the display tab. Set the HTML Map Tip to the following:
<img src=[% "thumbnail" %] ><br/>

Beautiful: [% "inst_Beautiful" %]<br/>
Boring: [% "inst_Boring" %]<br/>
Place: [% "perception_place" %]<br/>
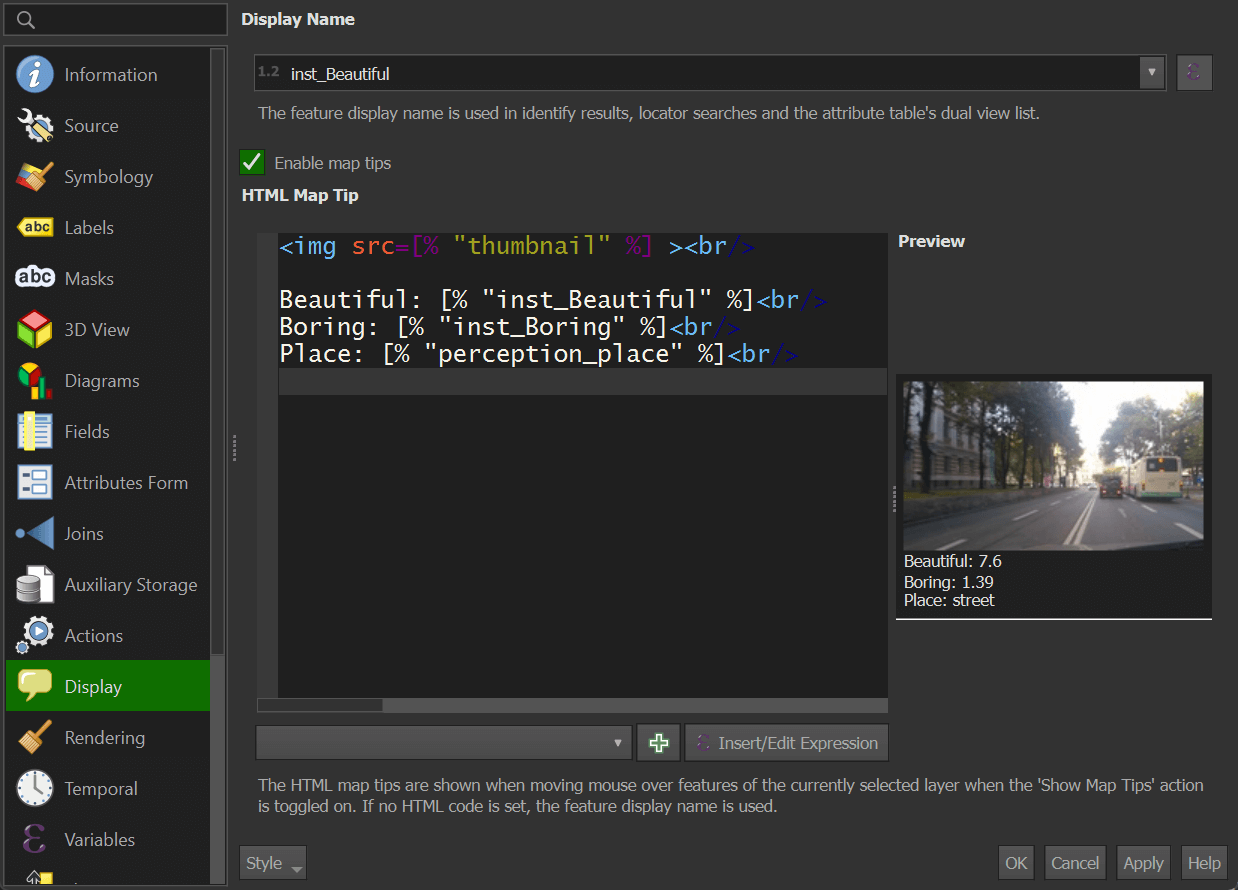
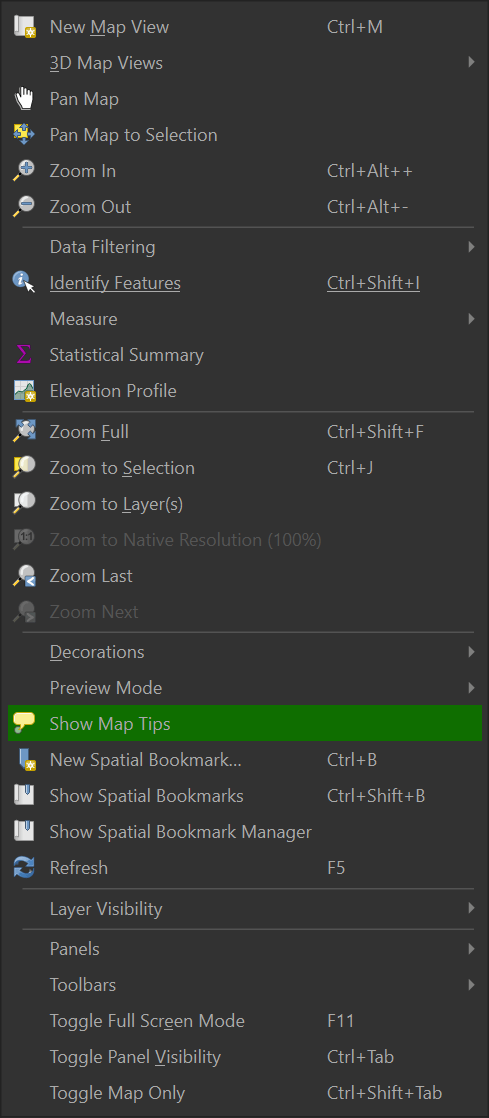
In the View Menu, make sure "Show Map Tips" is selected.
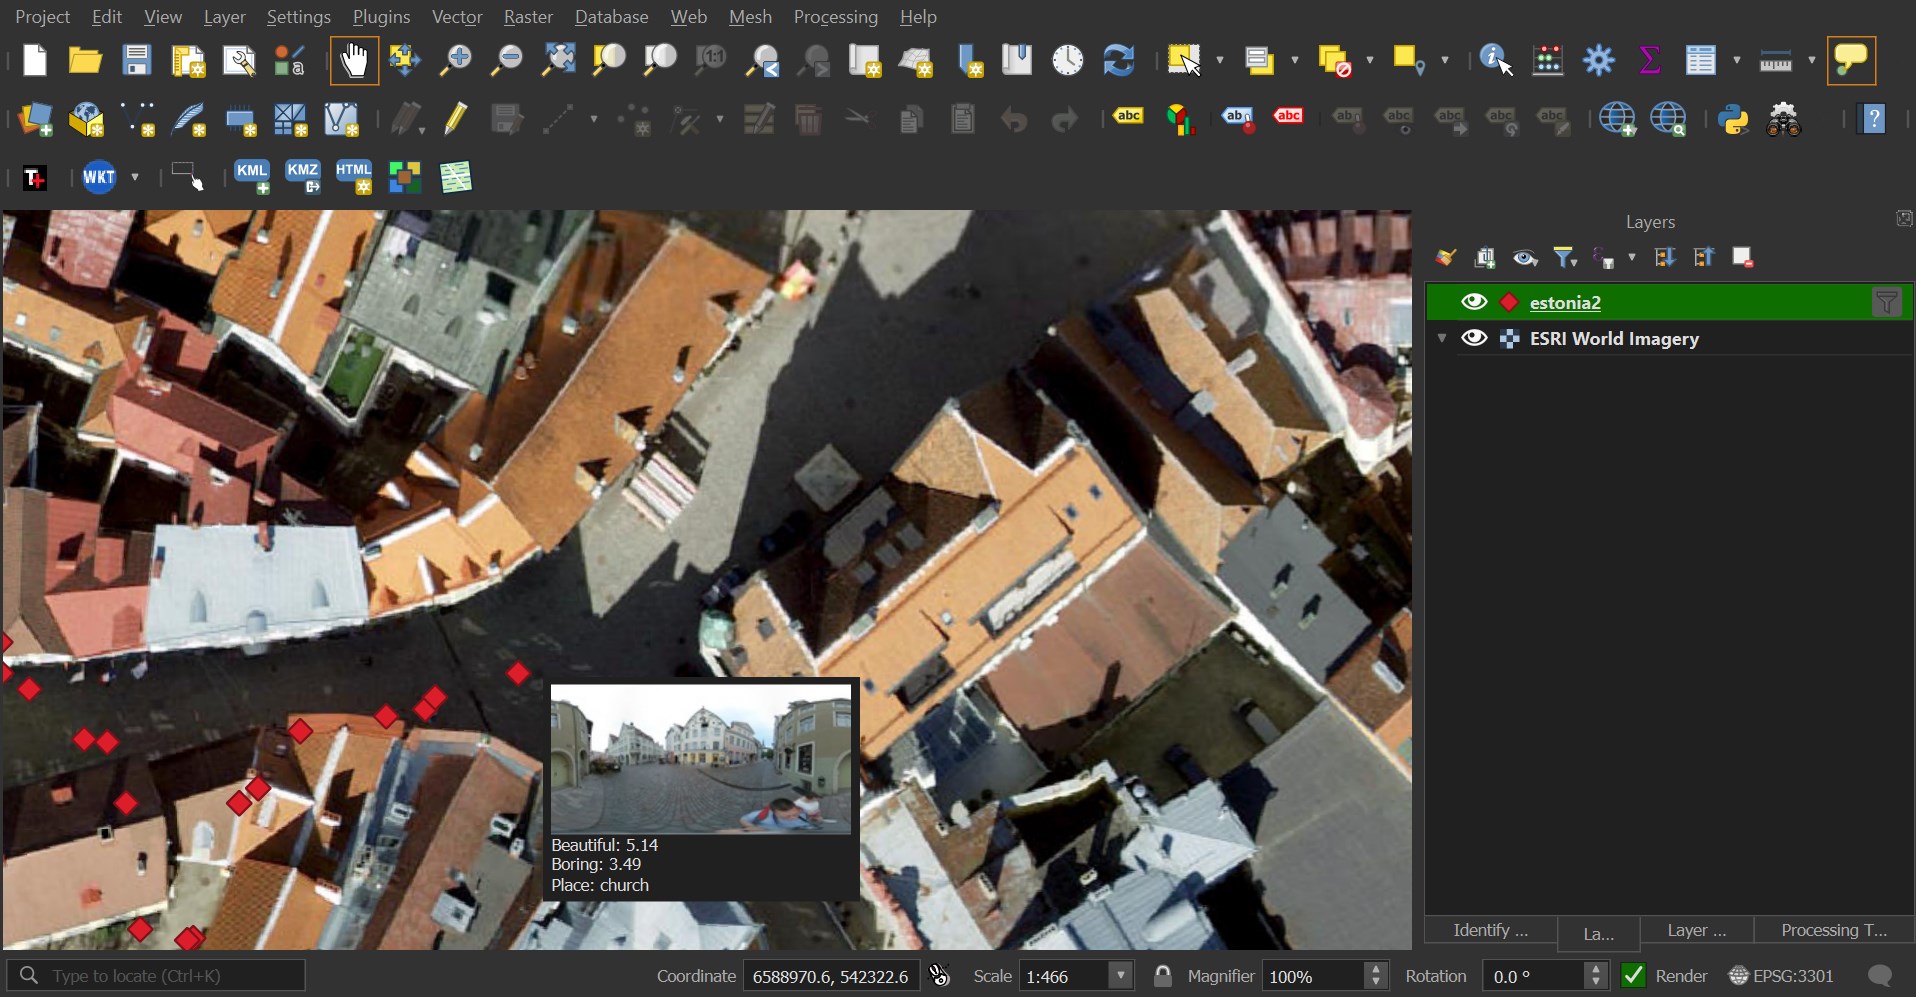
If you haven't selected any points then when you hover your mouse pointer over a KartaView-sourced point while its layer is selected, a thumbnail image should appear.
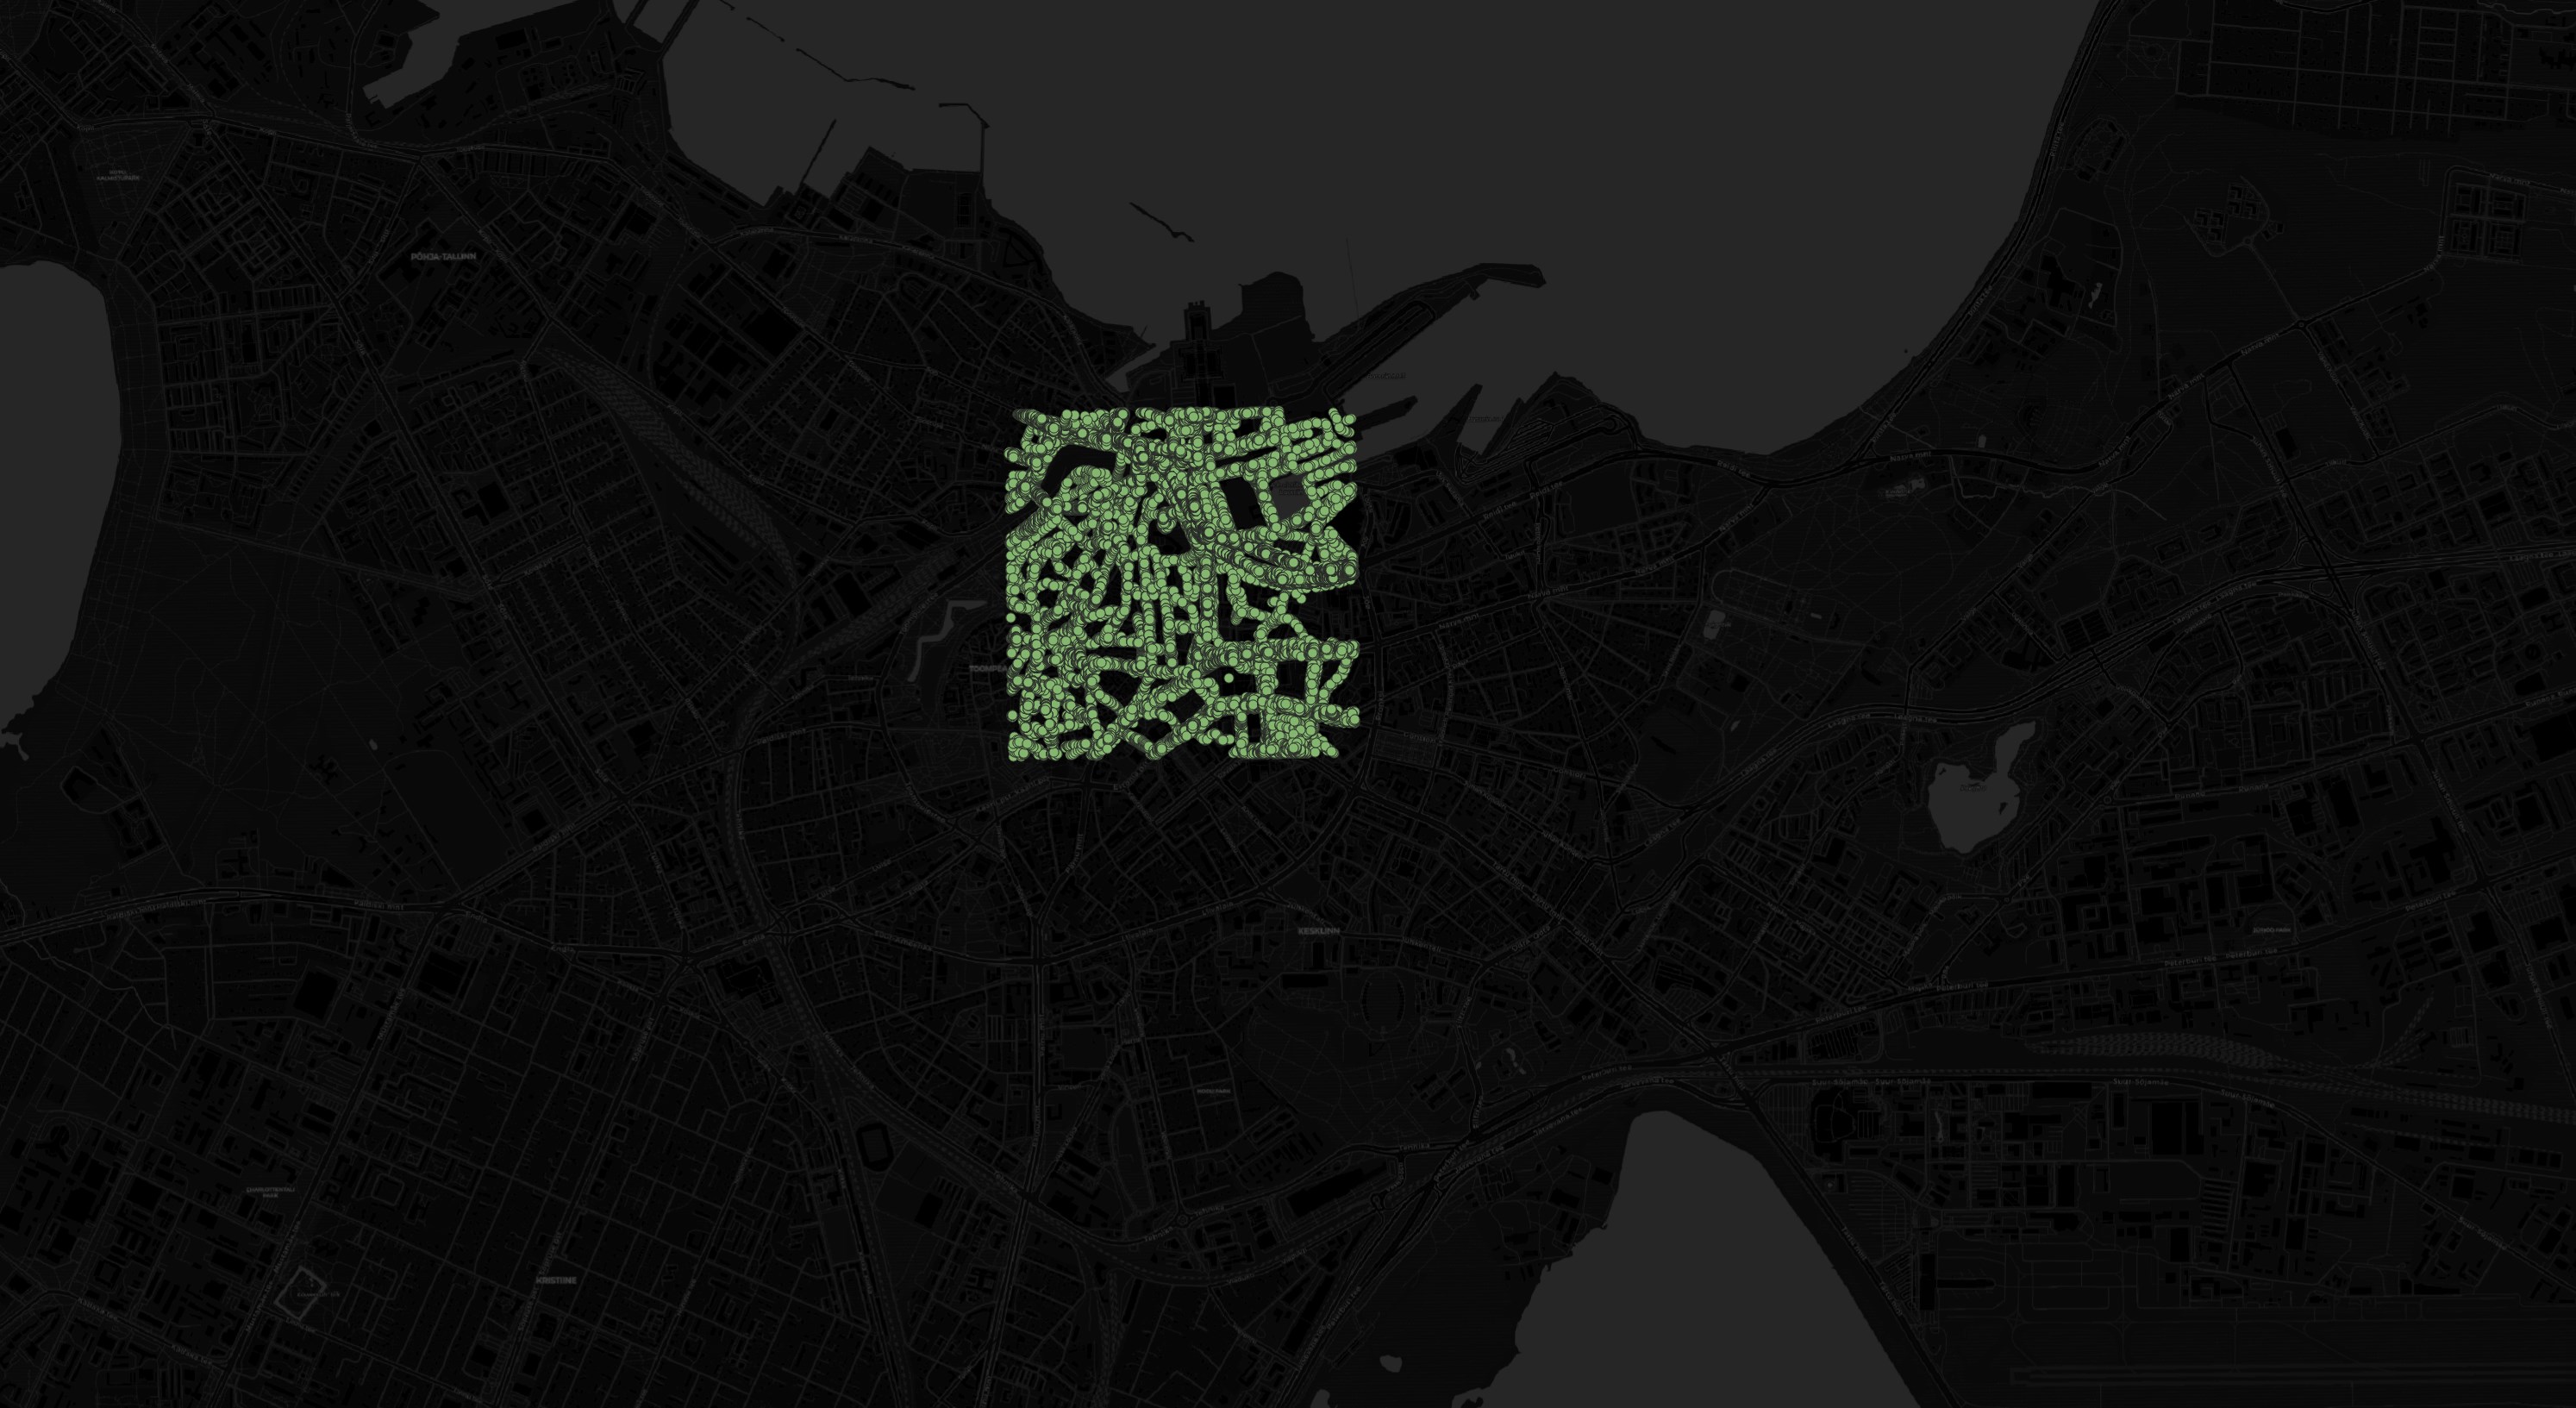
Estonian Observations
The imagery covered only includes a section of central Tallinn and part of central Pärnu. This is the area covered in Tallinn:
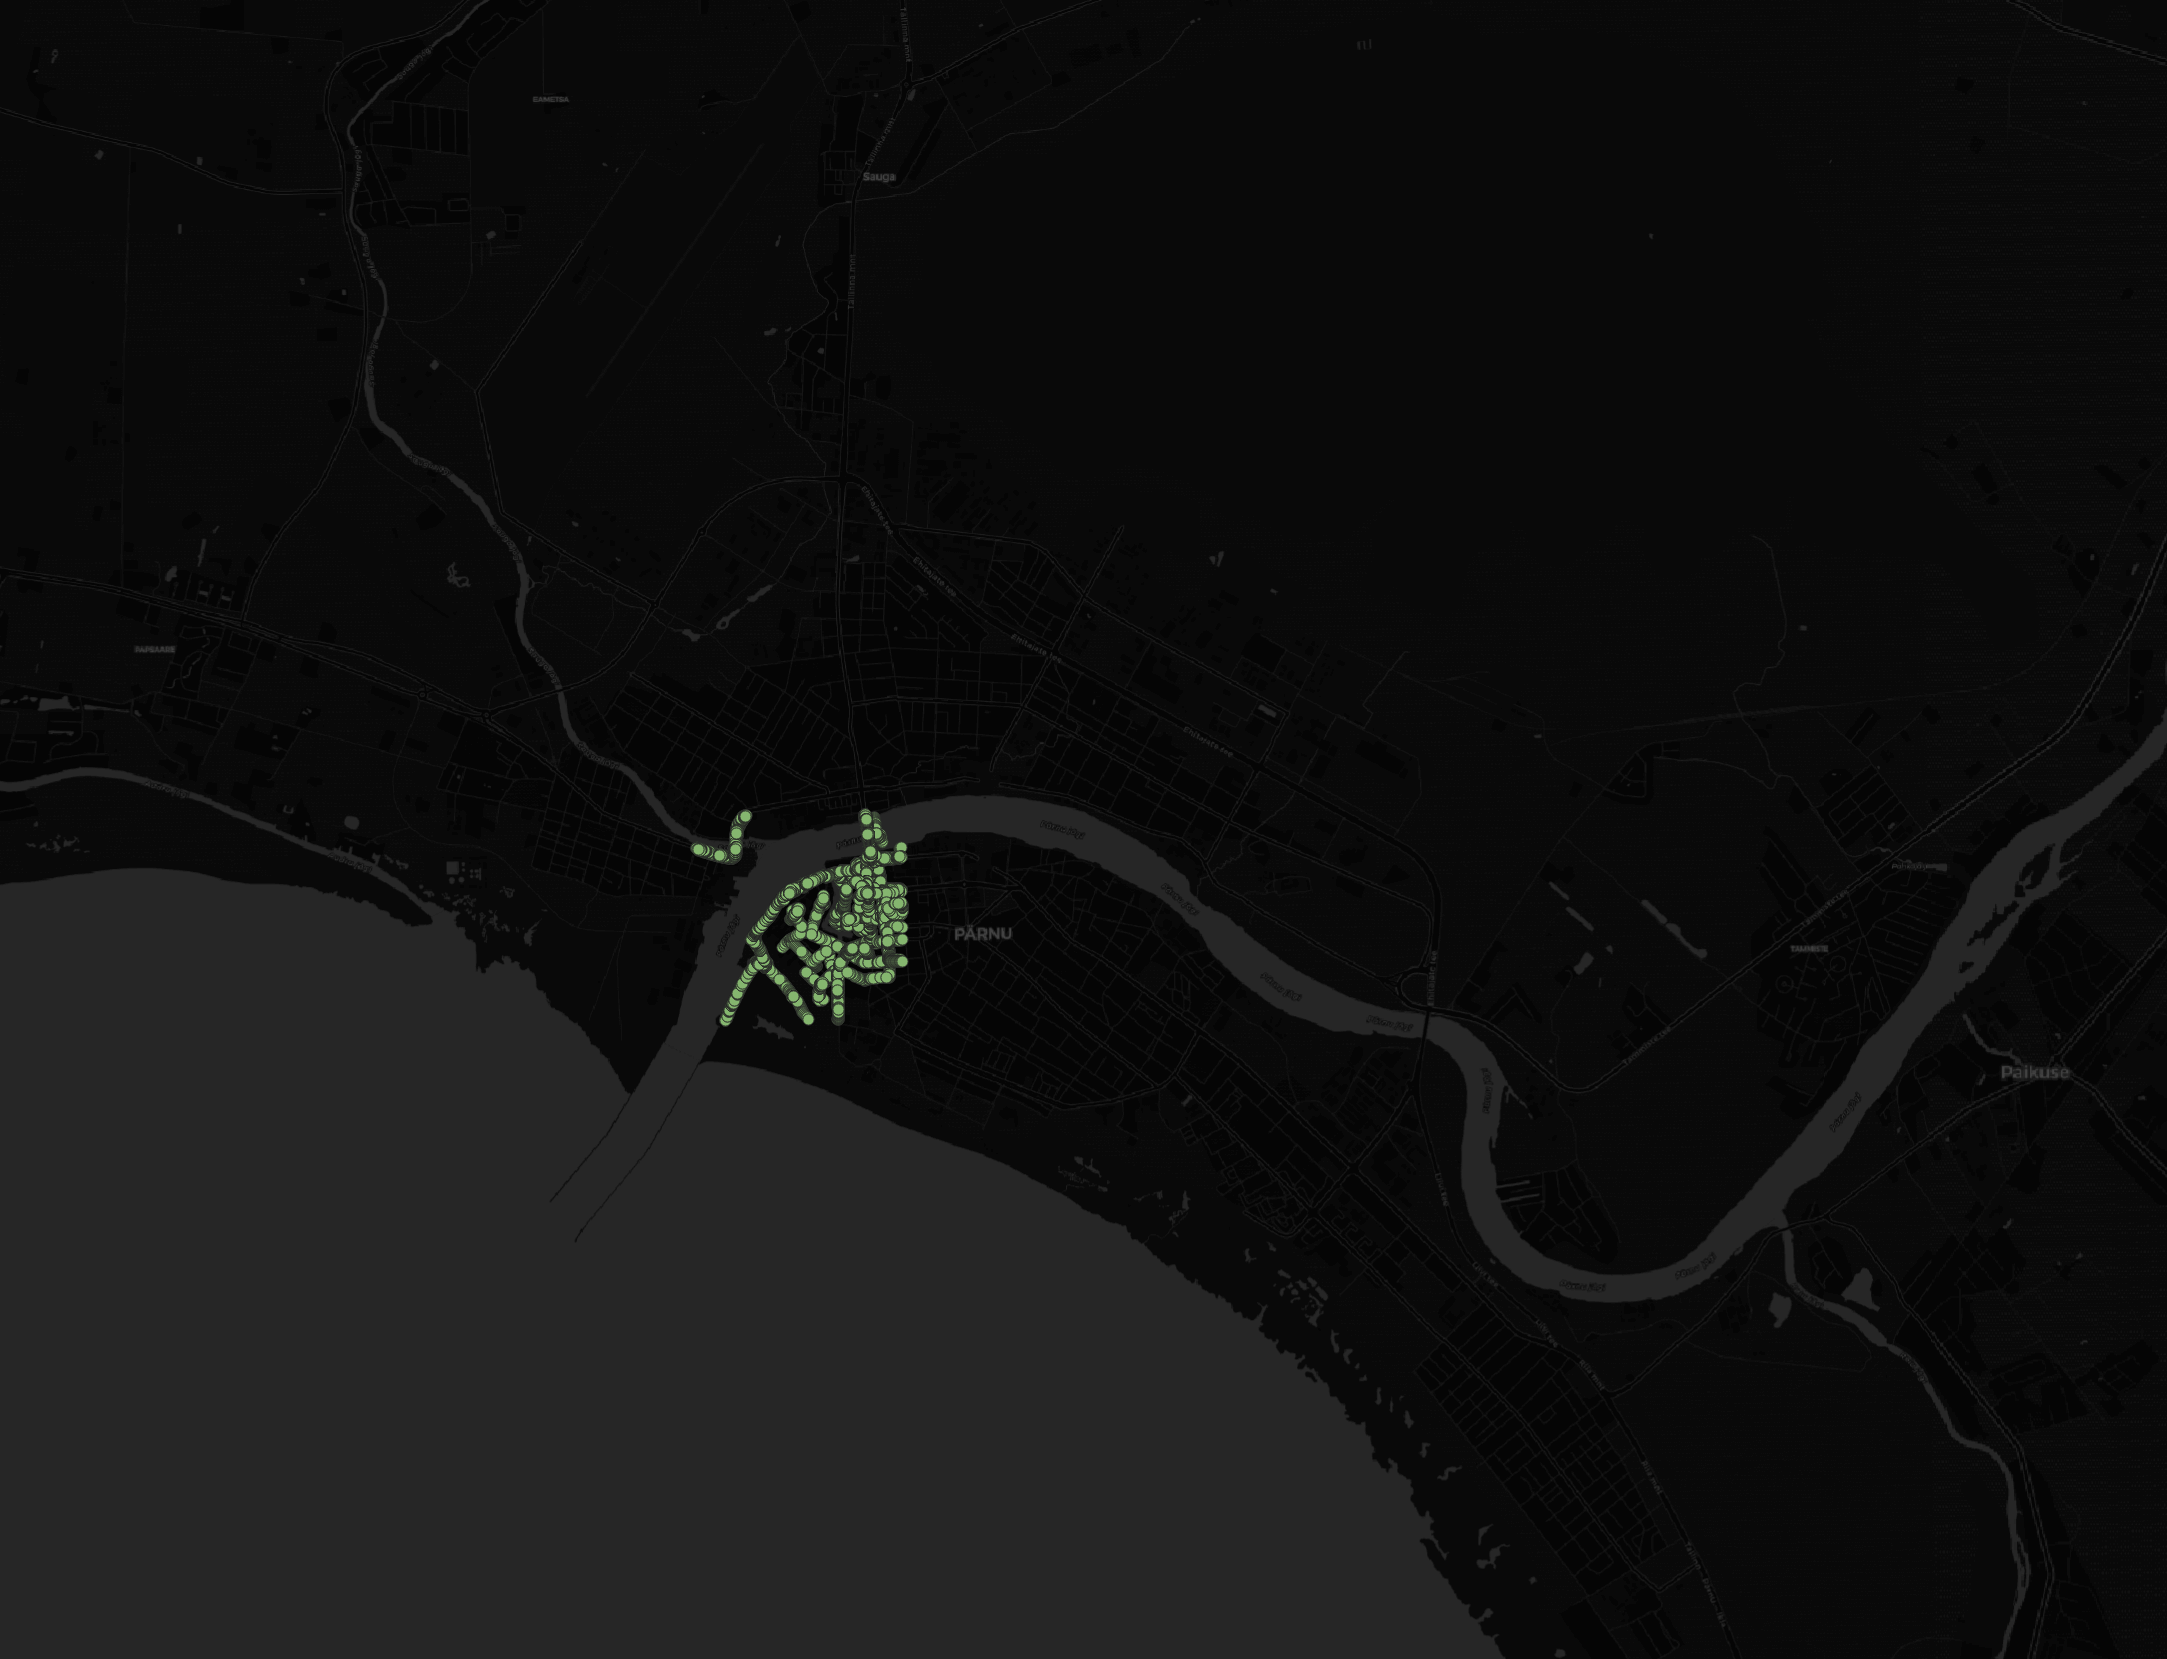
This is the area covered in Pärnu:
Below are the number of distinct place types found for each city for each year.
$ ~/duckdb
WITH a AS (
    SELECT   COUNT(DISTINCT perception_place) as places,
             simplemaps_city,
             meta_year
    from     ST_READ('estonia.gpkg')
    GROUP BY 2, 3
)
PIVOT    a
ON       simplemaps_city
USING    SUM(places)
group by meta_year
ORDER BY meta_year;
┌───────────┬────────┬─────────┐
│ meta_year │ Pärnu  │ Tallinn │
│   int64   │ int128 │ int128  │
├───────────┼────────┼─────────┤
│      2010 │      1 │         │
│      2011 │        │       1 │
│      2012 │        │       1 │
│      2013 │        │      10 │
│      2014 │        │      58 │
│      2015 │      9 │      99 │
│      2016 │      9 │      47 │
│      2017 │     26 │      25 │
│      2018 │     71 │     145 │
│      2019 │     58 │     150 │
│      2020 │     89 │     151 │
│      2021 │     19 │     112 │
│      2022 │    111 │     160 │
│      2023 │     49 │         │
├───────────┴────────┴─────────┤
│ 14 rows            3 columns │
└──────────────────────────────┘
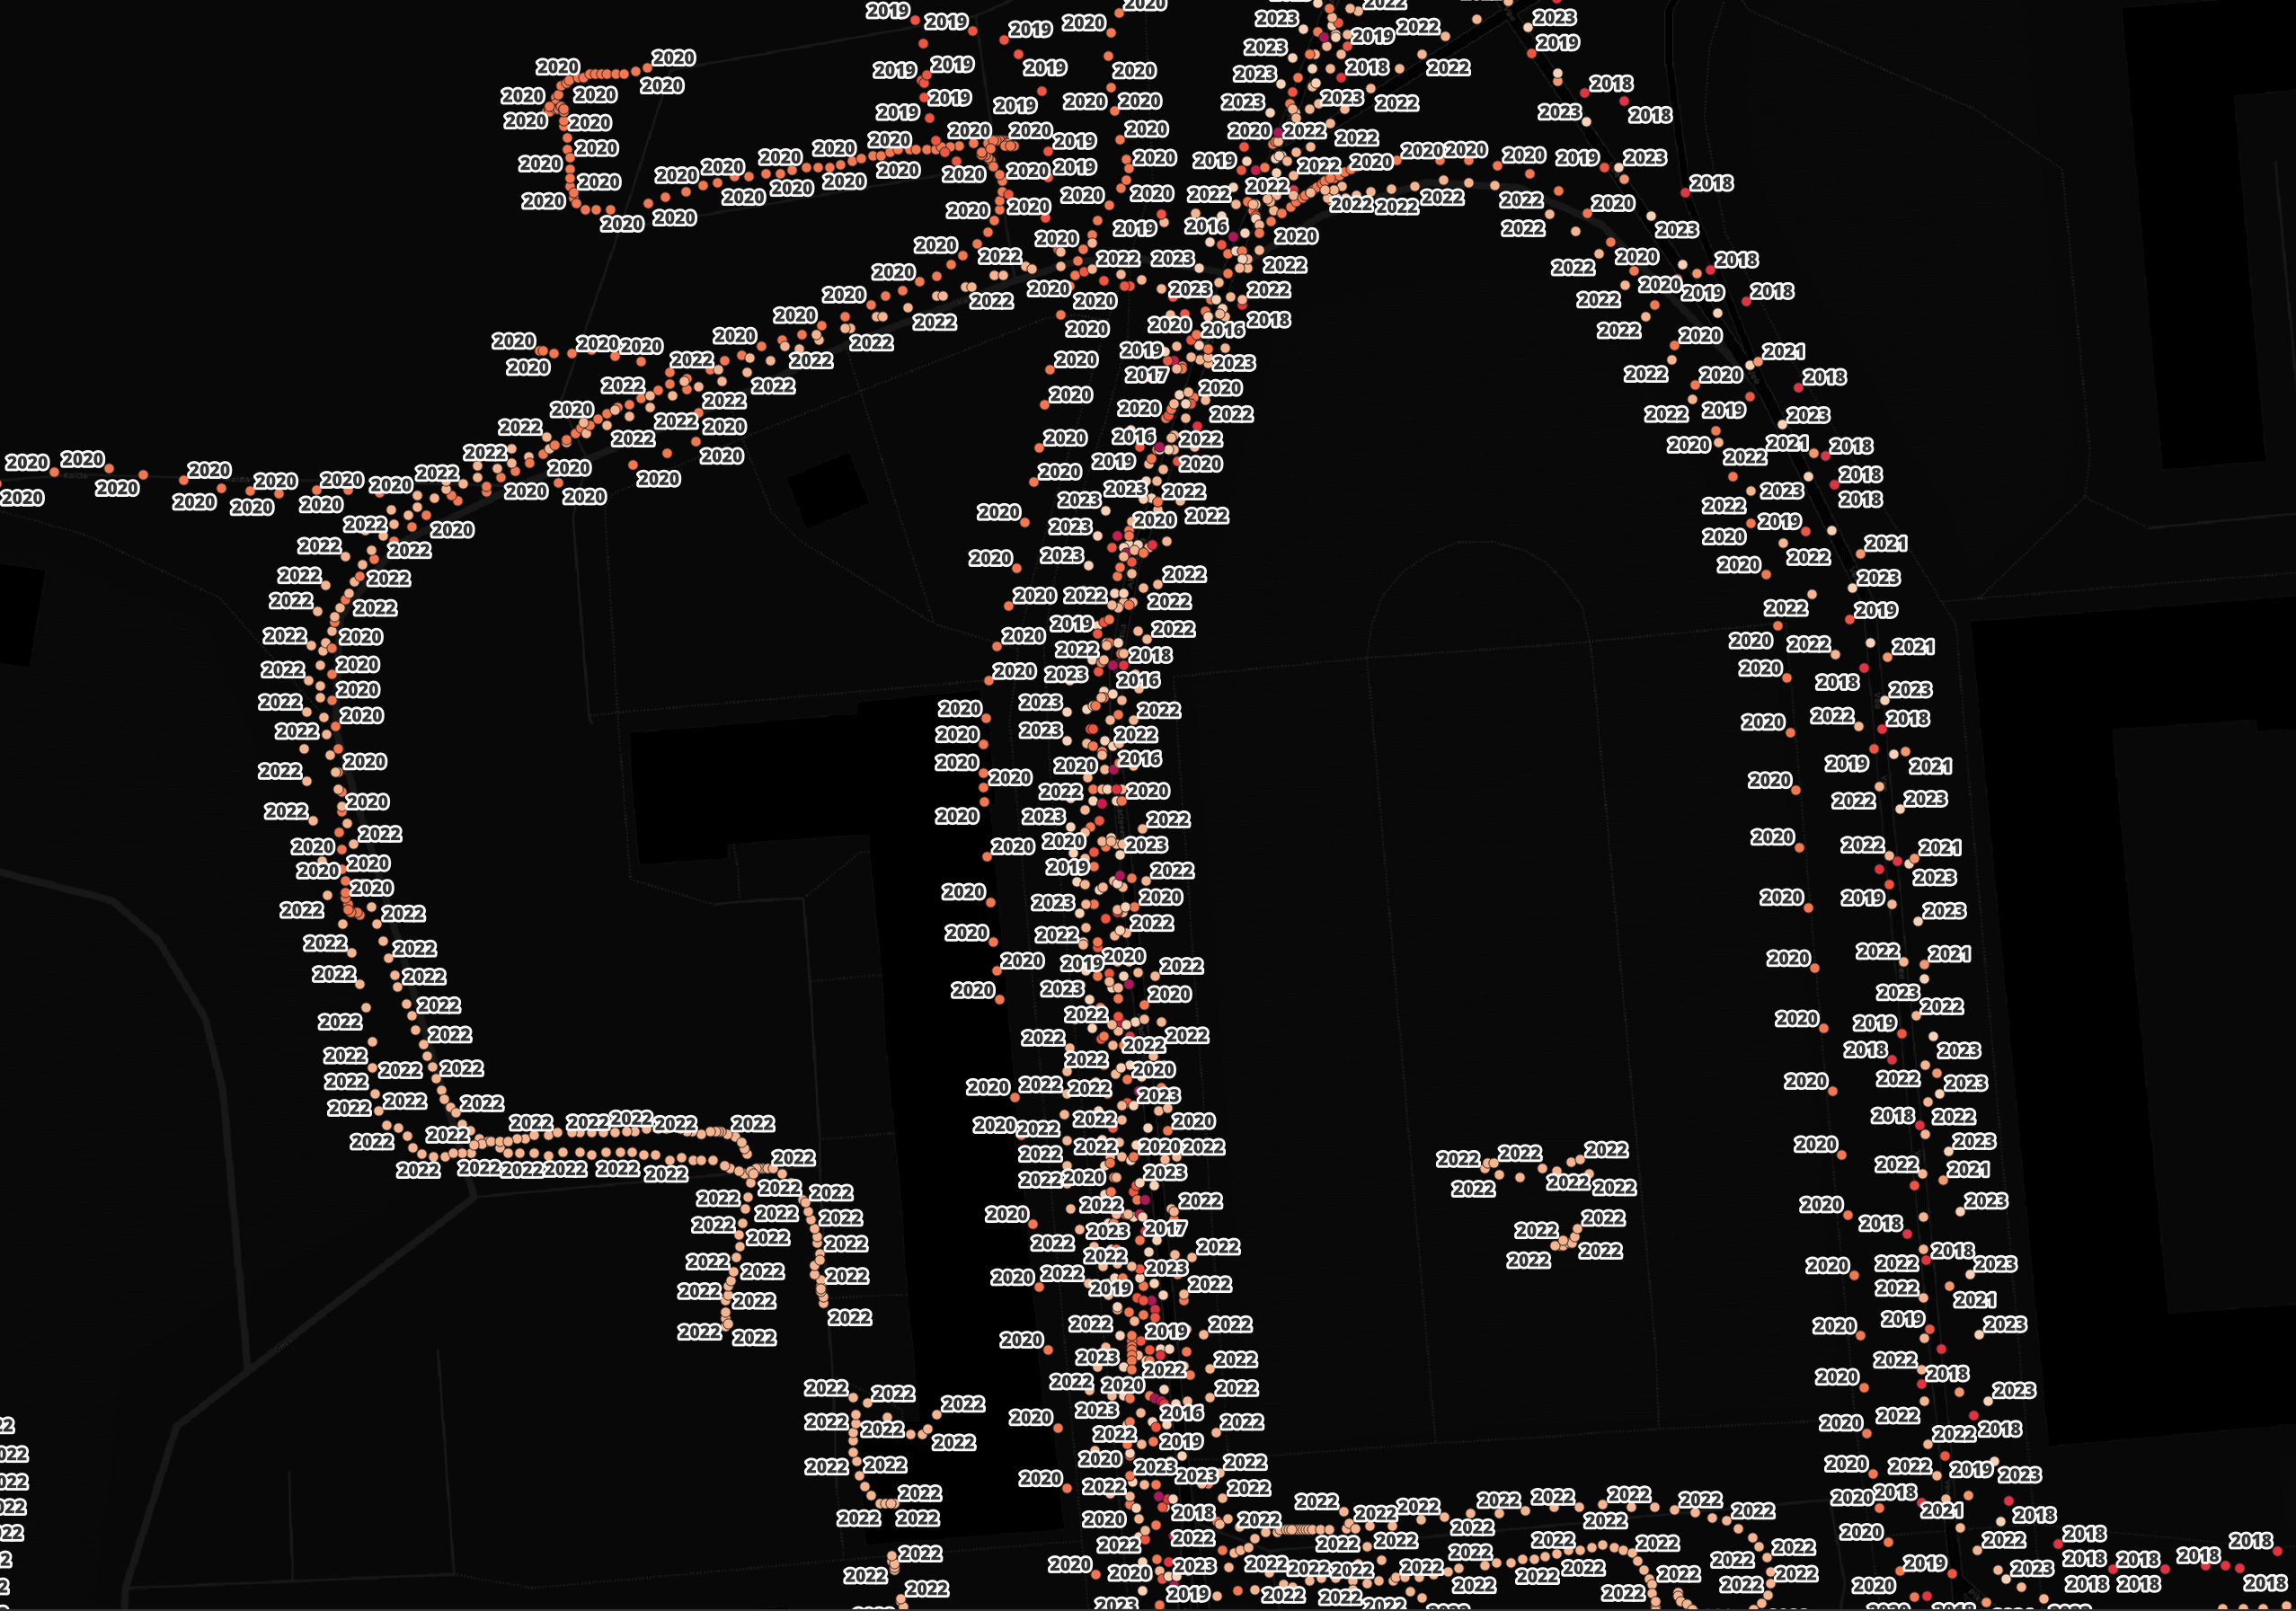
Streets can be re-captured over several years. Below is from central Pärnu showing the years where each image was taken.
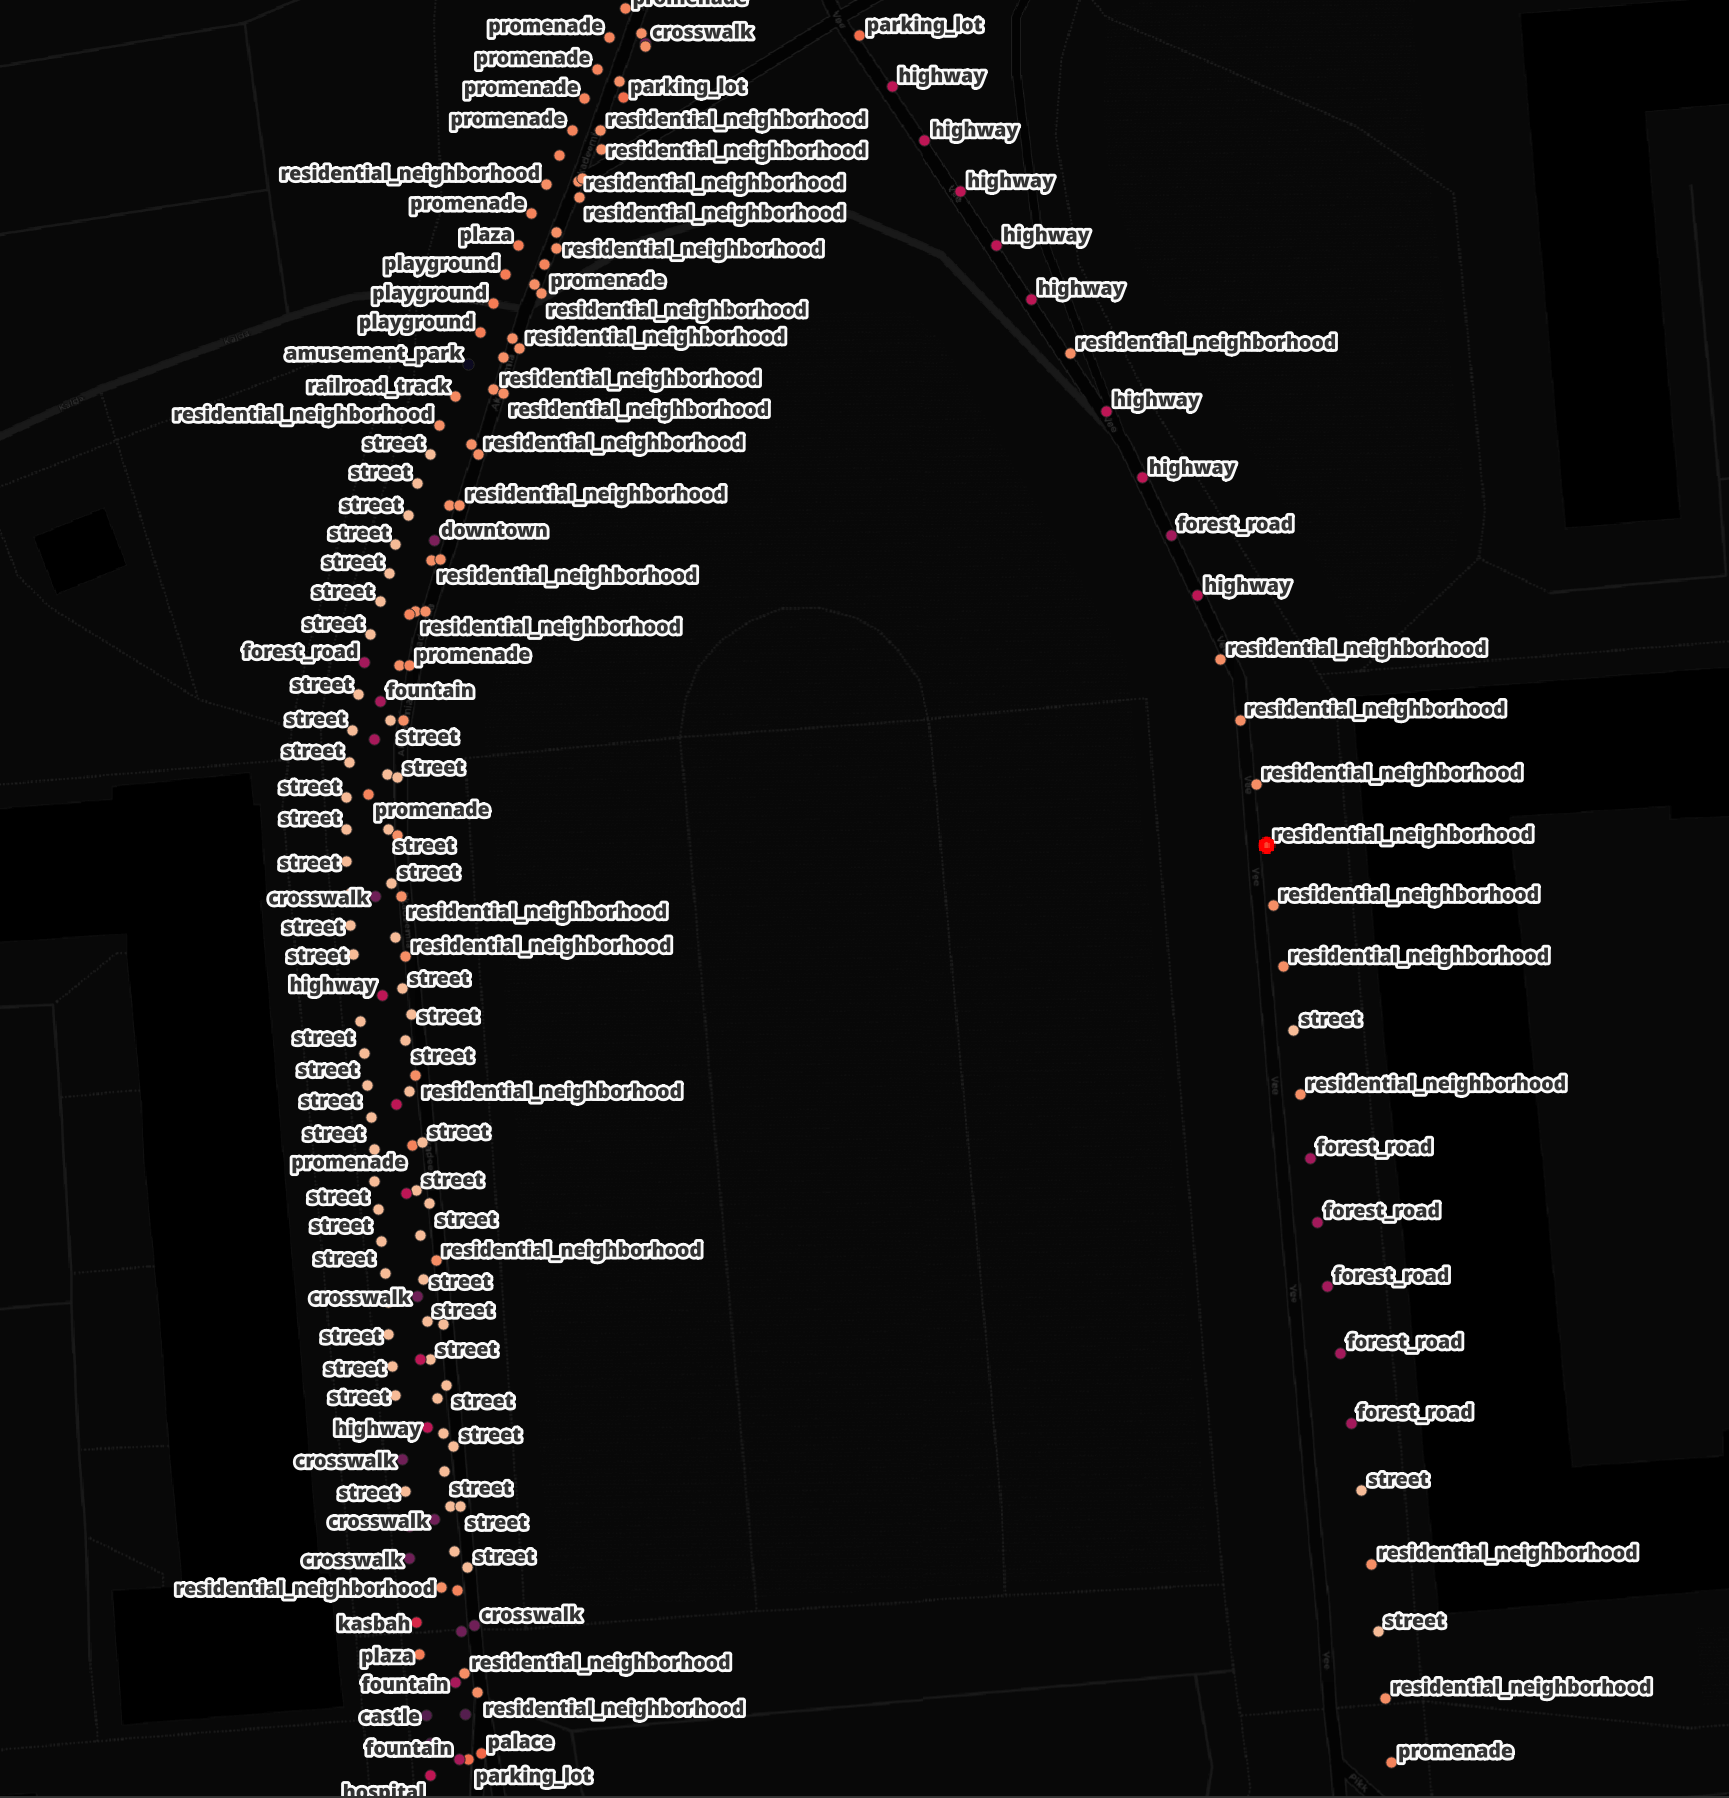
If I filter to imagery taken in 2023, you can see the results of one of the model's inferences as to the type of area each image was photographing.
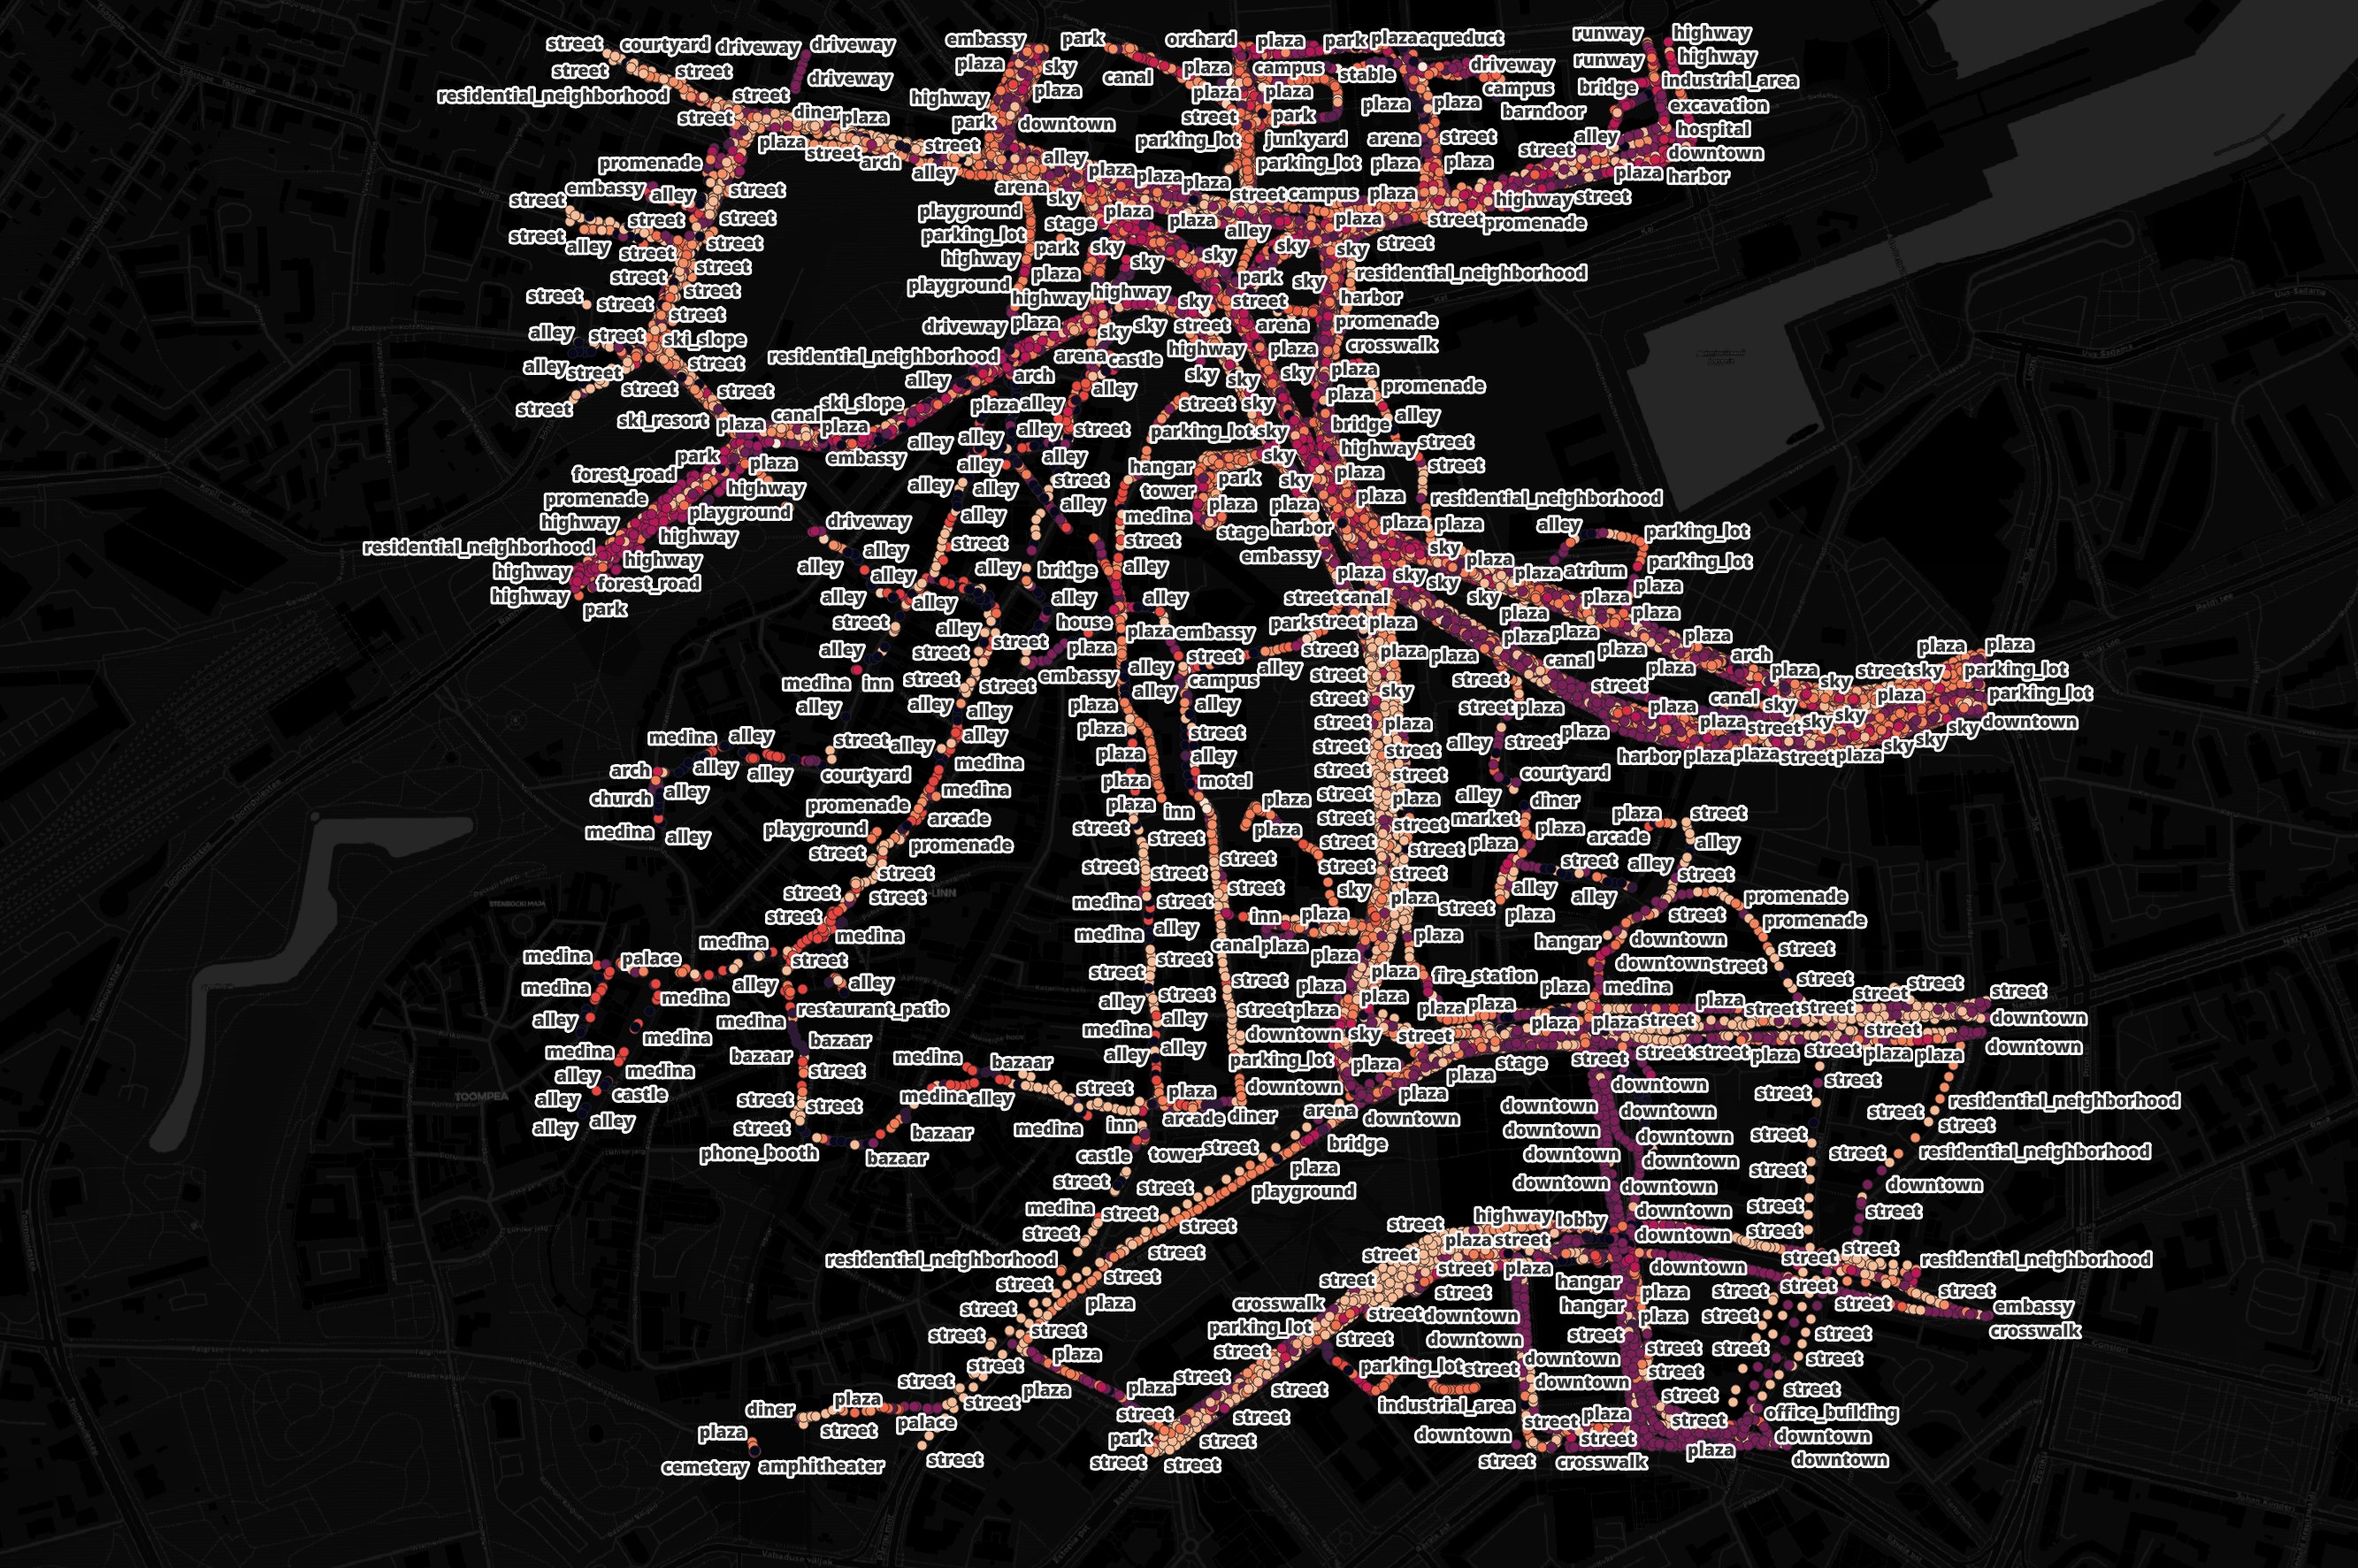
Here are the 2023 model inference results for central Tallinn.
The season attributes align well with the months of the year. If this was produced by AI then that is very impressive.
$ ~/duckdb
WITH a AS (
    SELECT   meta_month,
             season_season,
             COUNT(*) records
    FROM     ST_READ('estonia.gpkg')
    GROUP BY 1, 2
)
PIVOT    a
ON       season_season
USING    SUM(records)
group by meta_month
ORDER BY meta_month;
┌────────────┬────────┬────────┬────────┬────────┐
│ meta_month │ Autumn │ Spring │ Summer │ Winter │
│   int64    │ int128 │ int128 │ int128 │ int128 │
├────────────┼────────┼────────┼────────┼────────┤
│          1 │        │        │        │  11175 │
│          2 │        │        │        │   9939 │
│          3 │        │   4153 │        │        │
│          4 │        │   8547 │        │        │
│          5 │        │  14140 │        │        │
│          6 │        │        │   6928 │        │
│          7 │        │        │  13186 │        │
│          8 │        │        │   8925 │        │
│          9 │   6553 │        │        │        │
│         10 │   7006 │        │        │        │
│         11 │   9074 │        │        │        │
│         12 │        │        │        │   1835 │
├────────────┴────────┴────────┴────────┴────────┤
│ 12 rows                              5 columns │
└────────────────────────────────────────────────┘
Below are the weather conditions each image was captured in.
$ ~/duckdb
WITH a AS (
    SELECT   meta_month,
             context_weather,
             COUNT(*) records
    FROM     ST_READ('estonia.gpkg')
    GROUP BY 1, 2
)
PIVOT    a
ON       context_weather
USING    SUM(records)
group by meta_month
ORDER BY meta_month;
┌────────────┬────────┬────────┬────────┬────────┬────────┐
│ meta_month │ clear  │ cloudy │ foggy  │ rainy  │ snowy  │
│   int64    │ int128 │ int128 │ int128 │ int128 │ int128 │
├────────────┼────────┼────────┼────────┼────────┼────────┤
│          1 │   2155 │     92 │        │    102 │   8826 │
│          2 │   1790 │     40 │        │     98 │   8011 │
│          3 │   1550 │    745 │     16 │    139 │   1703 │
│          4 │   4635 │   1777 │      4 │     12 │   2119 │
│          5 │  10660 │   2696 │        │    188 │    596 │
│          6 │   6559 │    284 │      1 │     61 │     23 │
│          7 │   9725 │   2536 │        │     19 │    906 │
│          8 │   7597 │   1205 │        │     41 │     82 │
│          9 │   3814 │   2540 │      1 │    124 │     74 │
│         10 │   3335 │   2876 │        │    445 │    350 │
│         11 │   4413 │   1321 │        │    340 │   3000 │
│         12 │    875 │    117 │        │     73 │    770 │
├────────────┴────────┴────────┴────────┴────────┴────────┤
│ 12 rows                                       6 columns │
└─────────────────────────────────────────────────────────┘
Estonia is so far North that the Sun is up at night during the summer months. Very few images report being taken at night in this dataset between the beginning of May and the end of August.
$ ~/duckdb
WITH a AS (
    SELECT   meta_hour,
             context_lighting_condition,
             COUNT(*) records
    from     ST_READ('estonia.gpkg')
    WHERE    meta_month > 4 AND meta_month < 9
    GROUP BY 1, 2
)
PIVOT    a
ON       context_lighting_condition
USING    SUM(records)
group by meta_hour
ORDER BY meta_hour;
┌───────────┬────────┬───────────┬────────┐
│ meta_hour │  day   │ dusk/dawn │ night  │
│   int64   │ int128 │  int128   │ int128 │
├───────────┼────────┼───────────┼────────┤
│         0 │    282 │        29 │     36 │
│         1 │    729 │       183 │    113 │
│         2 │   1246 │       146 │     46 │
│         3 │      1 │           │        │
│         4 │     54 │       171 │        │
│         5 │    183 │        53 │        │
│         7 │    281 │        13 │        │
│         8 │     43 │         1 │        │
│         9 │   1881 │         2 │        │
│        10 │   5519 │         6 │     15 │
│        11 │   3186 │        45 │      2 │
│        12 │   3028 │           │      1 │
│        13 │   4292 │         4 │      4 │
│        14 │   2102 │         1 │        │
│        15 │   2448 │        27 │     20 │
│        16 │   4192 │        30 │        │
│        17 │   1780 │        15 │        │
│        18 │   3264 │        33 │        │
│        19 │   2154 │       347 │        │
│        20 │    890 │        60 │        │
│        21 │    891 │        41 │        │
│        22 │   1026 │         5 │        │
│        23 │   1761 │       125 │    372 │
├───────────┴────────┴───────────┴────────┤
│ 23 rows                       4 columns │
└─────────────────────────────────────────┘
Further Research
As I uncover more insights into this dataset, I'll update this post with my findings.