Since 2014, Microsoft has published GlobalMLBuildingFootprints, a building footprint and height database covering much of the world. It's constructed from running machine learning algorithms against satellite and other aerial imagery. The imagery has been sourced from providers such as Maxar (now re-branded as Vantor), Airbus, Vexcel and IGN France.
The dataset is made up of 1.4B records and has a disk footprint of 113 GB across 30,344 GZIP-compressed, CSV files.
I previously wrote about this dataset in October 2024 but since then, there have been six documented updates and the entire dataset was re-built and re-published two weeks ago.
In this post, I'll examine their latest release.
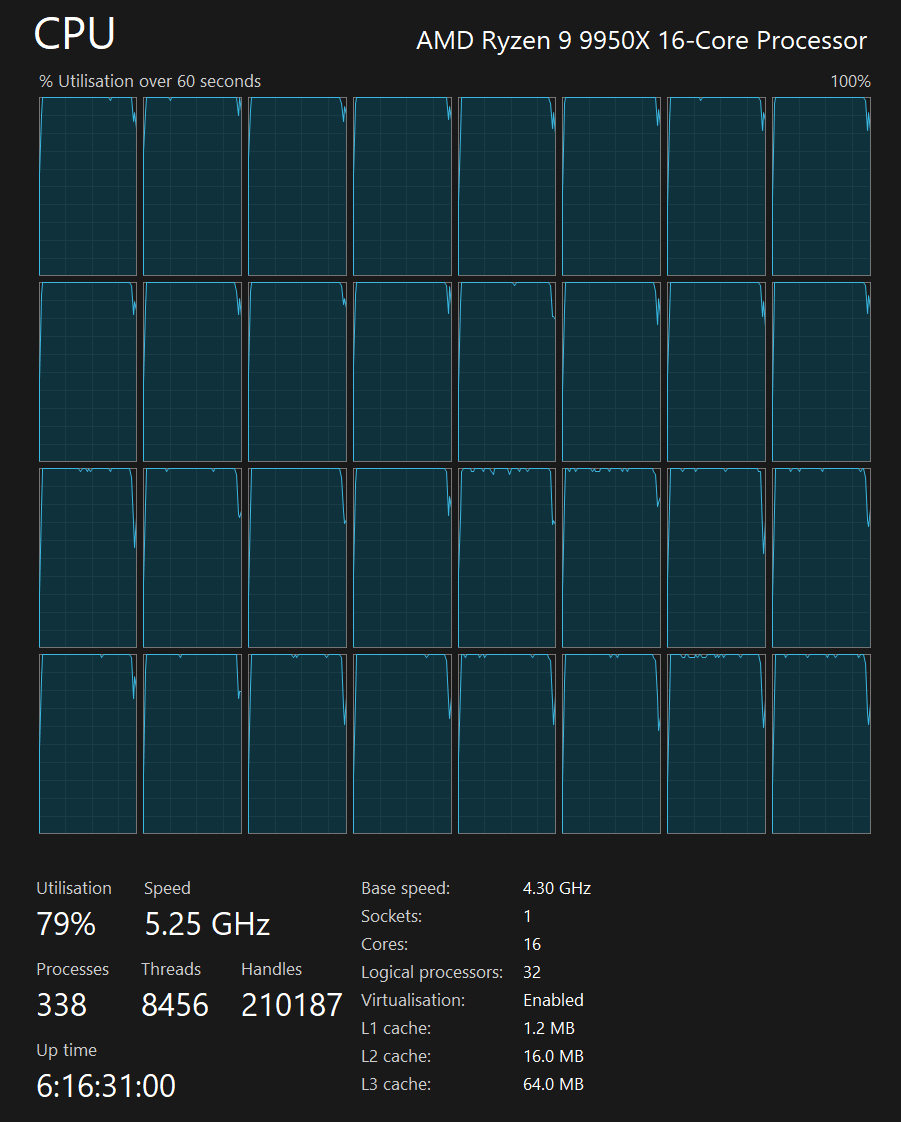
My Workstation
I'm using a 5.7 GHz AMD Ryzen 9 9950X CPU. It has 16 cores and 32 threads and 1.2 MB of L1, 16 MB of L2 and 64 MB of L3 cache. It has a liquid cooler attached and is housed in a spacious, full-sized Cooler Master HAF 700 computer case.
The system has 96 GB of DDR5 RAM clocked at 4,800 MT/s and a 5th-generation, Crucial T700 4 TB NVMe M.2 SSD which can read at speeds up to 12,400 MB/s. There is a heatsink on the SSD to help keep its temperature down. This is my system's C drive.
The system is powered by a 1,200-watt, fully modular Corsair Power Supply and is sat on an ASRock X870E Nova 90 Motherboard.
I'm running Ubuntu 24 LTS via Microsoft's Ubuntu for Windows on Windows 11 Pro. In case you're wondering why I don't run a Linux-based desktop as my primary work environment, I'm still using an Nvidia GTX 1080 GPU which has better driver support on Windows and ArcGIS Pro only supports Windows natively.
Installing Prerequisites
I'll use DuckDB v1.4.3, along with its H3, JSON, Lindel, Parquet and Spatial extensions, in this post.
$ cd ~
$ wget -c https://github.com/duckdb/duckdb/releases/download/v1.4.3/duckdb_cli-linux-amd64.zip
$ unzip -j duckdb_cli-linux-amd64.zip
$ chmod +x duckdb
$ ~/duckdb
INSTALL h3 FROM community;
INSTALL lindel FROM community;
INSTALL json;
INSTALL parquet;
INSTALL spatial;
I'll set up DuckDB to load every installed extension each time it launches.
$ vi ~/.duckdbrc
.timer on
.width 180
LOAD h3;
LOAD lindel;
LOAD json;
LOAD parquet;
LOAD spatial;
The maps in this post were rendered using QGIS version 3.44. QGIS is a desktop application that runs on Windows, macOS and Linux. The application has grown in popularity in recent years and has ~15M application launches from users all around the world each month.
I used QGIS' Tile+ and HCMGIS plugins to add basemaps from Bing and Esri to the maps in this post.
Thousands of CSVs
Below, I'll download the manifest of the 30,344 CSV files that make up this dataset.
$ mkdir -p ~/ms_buildings_2026
$ cd ~/ms_buildings_2026

$ wget https://minedbuildings.z5.web.core.windows.net/global-buildings/dataset-links.csv
Below is an example record from the manifest.
$ echo "FROM     'dataset-links.csv'
        ORDER BY UploadDate DESC
        LIMIT    1" \
    | ~/duckdb -json \
    | jq -S .
[
  {
    "Location": "Abyei",
    "QuadKey": "122320113",
    "Size": "74.6KB",
    "UploadDate": "2026-01-15",
    "Url": "https://minedbuildings.z5.web.core.windows.net/global-buildings/2026-01-09/global-buildings.geojsonl/RegionName=Abyei/quadkey=122320113/part-00108-66ec874b-f074-4991-9da4-67716003c6cd.c000.csv.gz"
  }
]
I'll import this manifest into DuckDB and clean up its fields.
$ ~/duckdb
CREATE OR REPLACE TABLE mlb AS
    SELECT *,
           region: SPLIT_PART(SPLIT_PART(Url, '/', 7), '=', 2),
           num_bytes:
                CASE
                WHEN Size LIKE '%KB' THEN ((REPLACE(Size, 'KB', '')::FLOAT) * 1024)::BIGINT
                WHEN Size LIKE '%MB' THEN ((REPLACE(Size, 'MB', '')::FLOAT) * 1024 ** 2)::BIGINT
                WHEN Size LIKE '%B'  THEN ((REPLACE(Size, 'B',  ''))::FLOAT)::BIGINT
                ELSE Size::BIGINT END,
           unique_key: UUIDv4()
    FROM 'dataset-links.csv';
The manifest describes the dataset as having a footprint of 113 GB across 30,344 files, all with a publication date of 2026-01-15.
SELECT gb: SUM(num_bytes) / 1024 ** 3
FROM   mlb;
┌────────────────────┐
│         gb         │
│       double       │
├────────────────────┤
│ 113.94016721565276 │
└────────────────────┘
SELECT   UploadDate,
         COUNT(*)
FROM     mlb
GROUP BY 1;
┌────────────┬──────────────┐
│ UploadDate │ count_star() │
│    date    │    int64     │
├────────────┼──────────────┤
│ 2026-01-15 │    30344     │
└────────────┴──────────────┘
I'll build a BASH script that will download each CSV file into its own unique filename.
COPY (
    SELECT 'wget -c -O source/'
            || unique_key
            || '.csv.gz "'
            || Url
            || '"'
    FROM   mlb
) TO 'manifest.bash' (
        HEADER False,
        QUOTE '');
The following will download the 30,344 GZIP-compressed CSV files with four concurrent downloads at any one time.
$ mkdir -p source

$ cat manifest.bash \
    | xargs -P4 \
            -I% \
            bash -c "%"
CSV to Parquet
This dataset suffers from a small-file problem. The largest files are 100s of MB while the smallest are 100s of bytes.
$ ls -lS source/*.csv.gz | head
306627976 ... source/cdcae05e-e44b-4c1c-a571-0c315cc99cad.csv.gz
202647620 ... source/cee4b164-fca8-42f6-995d-f78df92a9d6f.csv.gz
190078342 ... source/5d4c71dc-58d2-4be9-8873-02ff15387b97.csv.gz
186396633 ... source/4c477651-366c-469f-86fd-321597e75f40.csv.gz
178589273 ... source/5683e3c5-07cf-4527-b412-743f55dfcf56.csv.gz
177762037 ... source/e2edc6da-368f-41bf-bf81-911b1393b896.csv.gz
176717777 ... source/f6dd29c9-be49-4b45-9b25-138281668829.csv.gz
173960772 ... source/7524bfe1-c314-40bb-b9c0-35418ba01f8c.csv.gz
172921655 ... source/5dd97452-8e58-4be8-ba1f-a8a13c339669.csv.gz
167773711 ... source/de07c8a4-a4f2-4c1c-9de1-fb1c107402bc.csv.gz
$ ls -lS source/*.csv.gz | tail
182 ... source/670f7c64-553a-481e-920e-9acbbae98a9d.csv.gz
182 ... source/a8e9994c-a016-481a-9062-a1209aaec5ef.csv.gz
181 ... source/d5709426-efab-404c-bb0c-3f0849283fc8.csv.gz
178 ... source/271643a9-5700-44d4-a82e-9d089bb5b10d.csv.gz
177 ... source/1ae077ff-615b-472f-9bad-2418b55aab17.csv.gz
177 ... source/dcc3f082-9da2-45ea-917f-ceea0e841e28.csv.gz
172 ... source/1f9f324e-9ad4-4af9-94f3-f00fbb9715a7.csv.gz
170 ... source/41afa18a-d3c0-49f3-85d9-5d34a7e24f5f.csv.gz
168 ... source/4e1ca57b-3aac-49ad-ad7b-ef6c3dcacb0f.csv.gz
163 ... source/9c03ce06-df35-4ddc-9ef5-c59fb71b3ef6.csv.gz
While these files were downloading, I converted each of them into Parquet, cleaning up their height and confidence values in the process. The confidence values were binned to the nearest 10th.
$ mkdir -p parquet

$ while :
      do
      for FILENAME in source/*.csv.gz; do
          echo $FILENAME

          BASENAME=`basename $FILENAME | cut -d. -f1`
          OUTPUT="parquet/$BASENAME.parquet"

          if [ ! -f $OUTPUT ]; then
              gunzip -c $FILENAME > working.csv

              echo "CREATE OR REPLACE TABLE buildings AS
                        SELECT height:     a.properties.height::FLOAT,
                               confidence: a.properties.confidence::FLOAT,
                               geometry:   ST_GEOMFROMGEOJSON(a.geometry)
                        FROM (SELECT a: column0::JSON
                              FROM   READ_CSV('working.csv',
                                              header=false,
                                              columns={'column0': 'VARCHAR'}));

                    COPY(
                        SELECT   height:     IF(height='-1.0',     NULL, height::FLOAT),
                                 confidence: IF(confidence='-1.0', NULL, (confidence::FLOAT * 10)::INT / 10),
                                 geometry,
                                 bbox:       {'xmin': ST_XMIN(ST_EXTENT(geometry)),
                                              'ymin': ST_YMIN(ST_EXTENT(geometry)),
                                              'xmax': ST_XMAX(ST_EXTENT(geometry)),
                                              'ymax': ST_YMAX(ST_EXTENT(geometry))}
                        FROM     buildings
                        WHERE    ST_Y(ST_CENTROID(geometry)) IS NOT NULL
                        ORDER BY HILBERT_ENCODE([ST_Y(ST_CENTROID(geometry)),
                                                 ST_X(ST_CENTROID(geometry))]::double[2])
                  ) TO '$OUTPUT' (
                      FORMAT 'PARQUET',
                      CODEC  'ZSTD',
                      COMPRESSION_LEVEL 22,
                      ROW_GROUP_SIZE 15000);
                  " | ~/duckdb
          fi
      done

      echo "Finished a pass of the manifest file. Sleeping for 5 minutes.."
      sleep 300
  done
I then merged the 30,344 resulting Parquet files into 16 larger files.
$ mkdir -p merged

$ for PREFIX in `ls parquet/ | cut -c1 | sort | uniq`; do
      echo 'Merging Prefix:', $PREFIX, \
           'file(s):',        `ls parquet/$PREFIX* | wc -l`

      echo "COPY(
                FROM     'parquet/$PREFIX*.parquet'
                WHERE    ST_Y(ST_CENTROID(geometry)) IS NOT NULL
                ORDER BY HILBERT_ENCODE([ST_Y(ST_CENTROID(geometry)),
                                         ST_X(ST_CENTROID(geometry))]::double[2])
            ) TO 'merged/$PREFIX.parquet' (
                FORMAT 'PARQUET',
                CODEC  'ZSTD',
                COMPRESSION_LEVEL 22,
                ROW_GROUP_SIZE 15000);" \
        | ~/duckdb
  done
The above maxed out my CPU and my RAM's high water mark usage hit ~56 GB.
The above produced 16 Parquet files with a combined 1,409,848,189 records and a disk footprint of 109 GB.
$ ~/duckdb
SELECT COUNT(*)
FROM   'merged/*.parquet';
┌────────────────┐
│  count_star()  │
│     int64      │
├────────────────┤
│   1409848189   │
│ (1.41 billion) │
└────────────────┘
Below is an example record of the resulting dataset.
$ echo "SELECT   * EXCLUDE(bbox),
                 bbox: bbox::JSON
        FROM     'merged/*.parquet'
        WHERE    height     IS NOT NULL
        AND      confidence IS NOT NULL
        LIMIT    1" \
    | ~/duckdb -json \
    | jq -S .
[
  {
    "bbox": {
      "xmax": 0.0000429153442383,
      "xmin": 0.0,
      "ymax": 45.01591632361135,
      "ymin": 45.015844272478645
    },
    "confidence": 0.9,
    "geometry": "POLYGON ((0 45.015844272478645, 0.000042915344238 45.015844272478645, 0.000042915344238 45.01591632361135, 0 45.01591632361135, 0 45.015844272478645))",
    "height": 1.0493422
  }
]
The above only managed to shave a few GB off of the deliverable Microsoft published. Floating-point values are the toughest data type for compression codecs to recognise patterns within and thus often produce poor compression ratios. This dataset is entirely made up of floating-point values so even with sorting it was hard to improve on the GZIP-compressed CSV disk footprint.
The bounding boxes do add some weight to the dataset but will help avoid the need to read the entire dataset when looking for specific geographies. In previous posts, I've only needed a few MB of bandwidth to pull data for entire cities out of 100 GB+, S3-hosted, Parquet-based, spatially-sorted and ZStandard-compressed datasets.
The statistics collected every 15K rows means some queries can be answered by looking at a few MB of metadata rather than the underlying GBs of data.
Turning 30K+ files into 16 means the file system overheads will be greatly reduced. Also, fewer files and arguably larger row-group sizes offer a good cost optimisation for request-metered CDNs like Cloudflare.
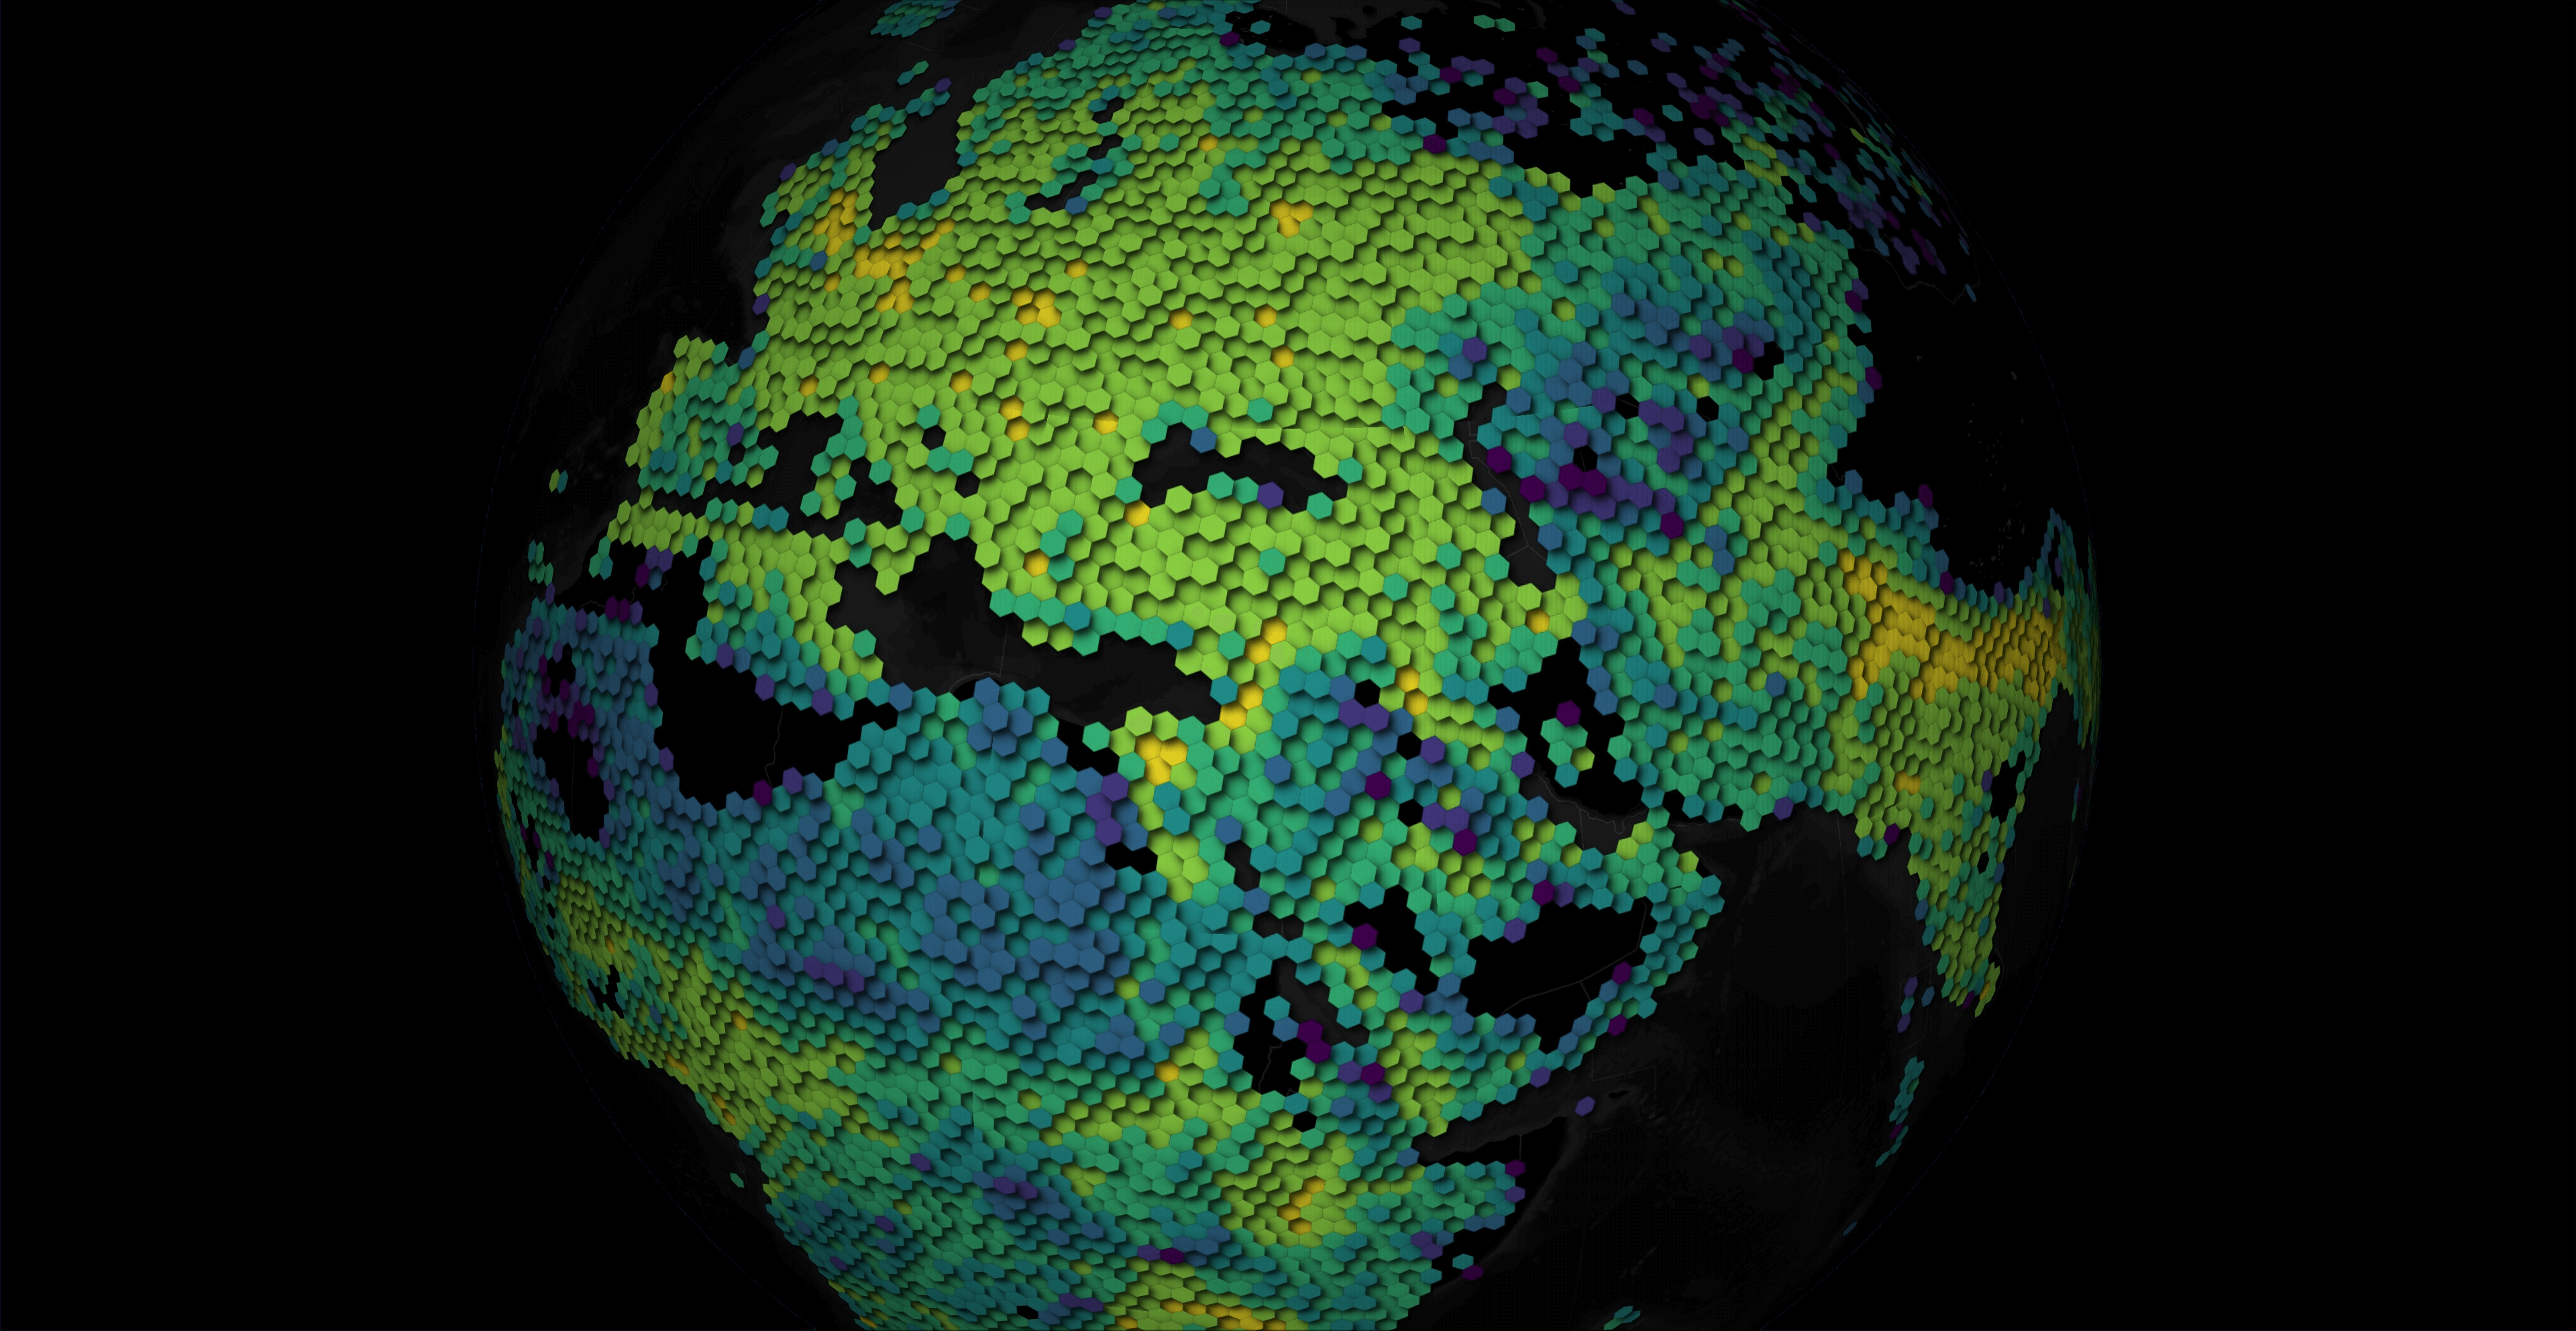
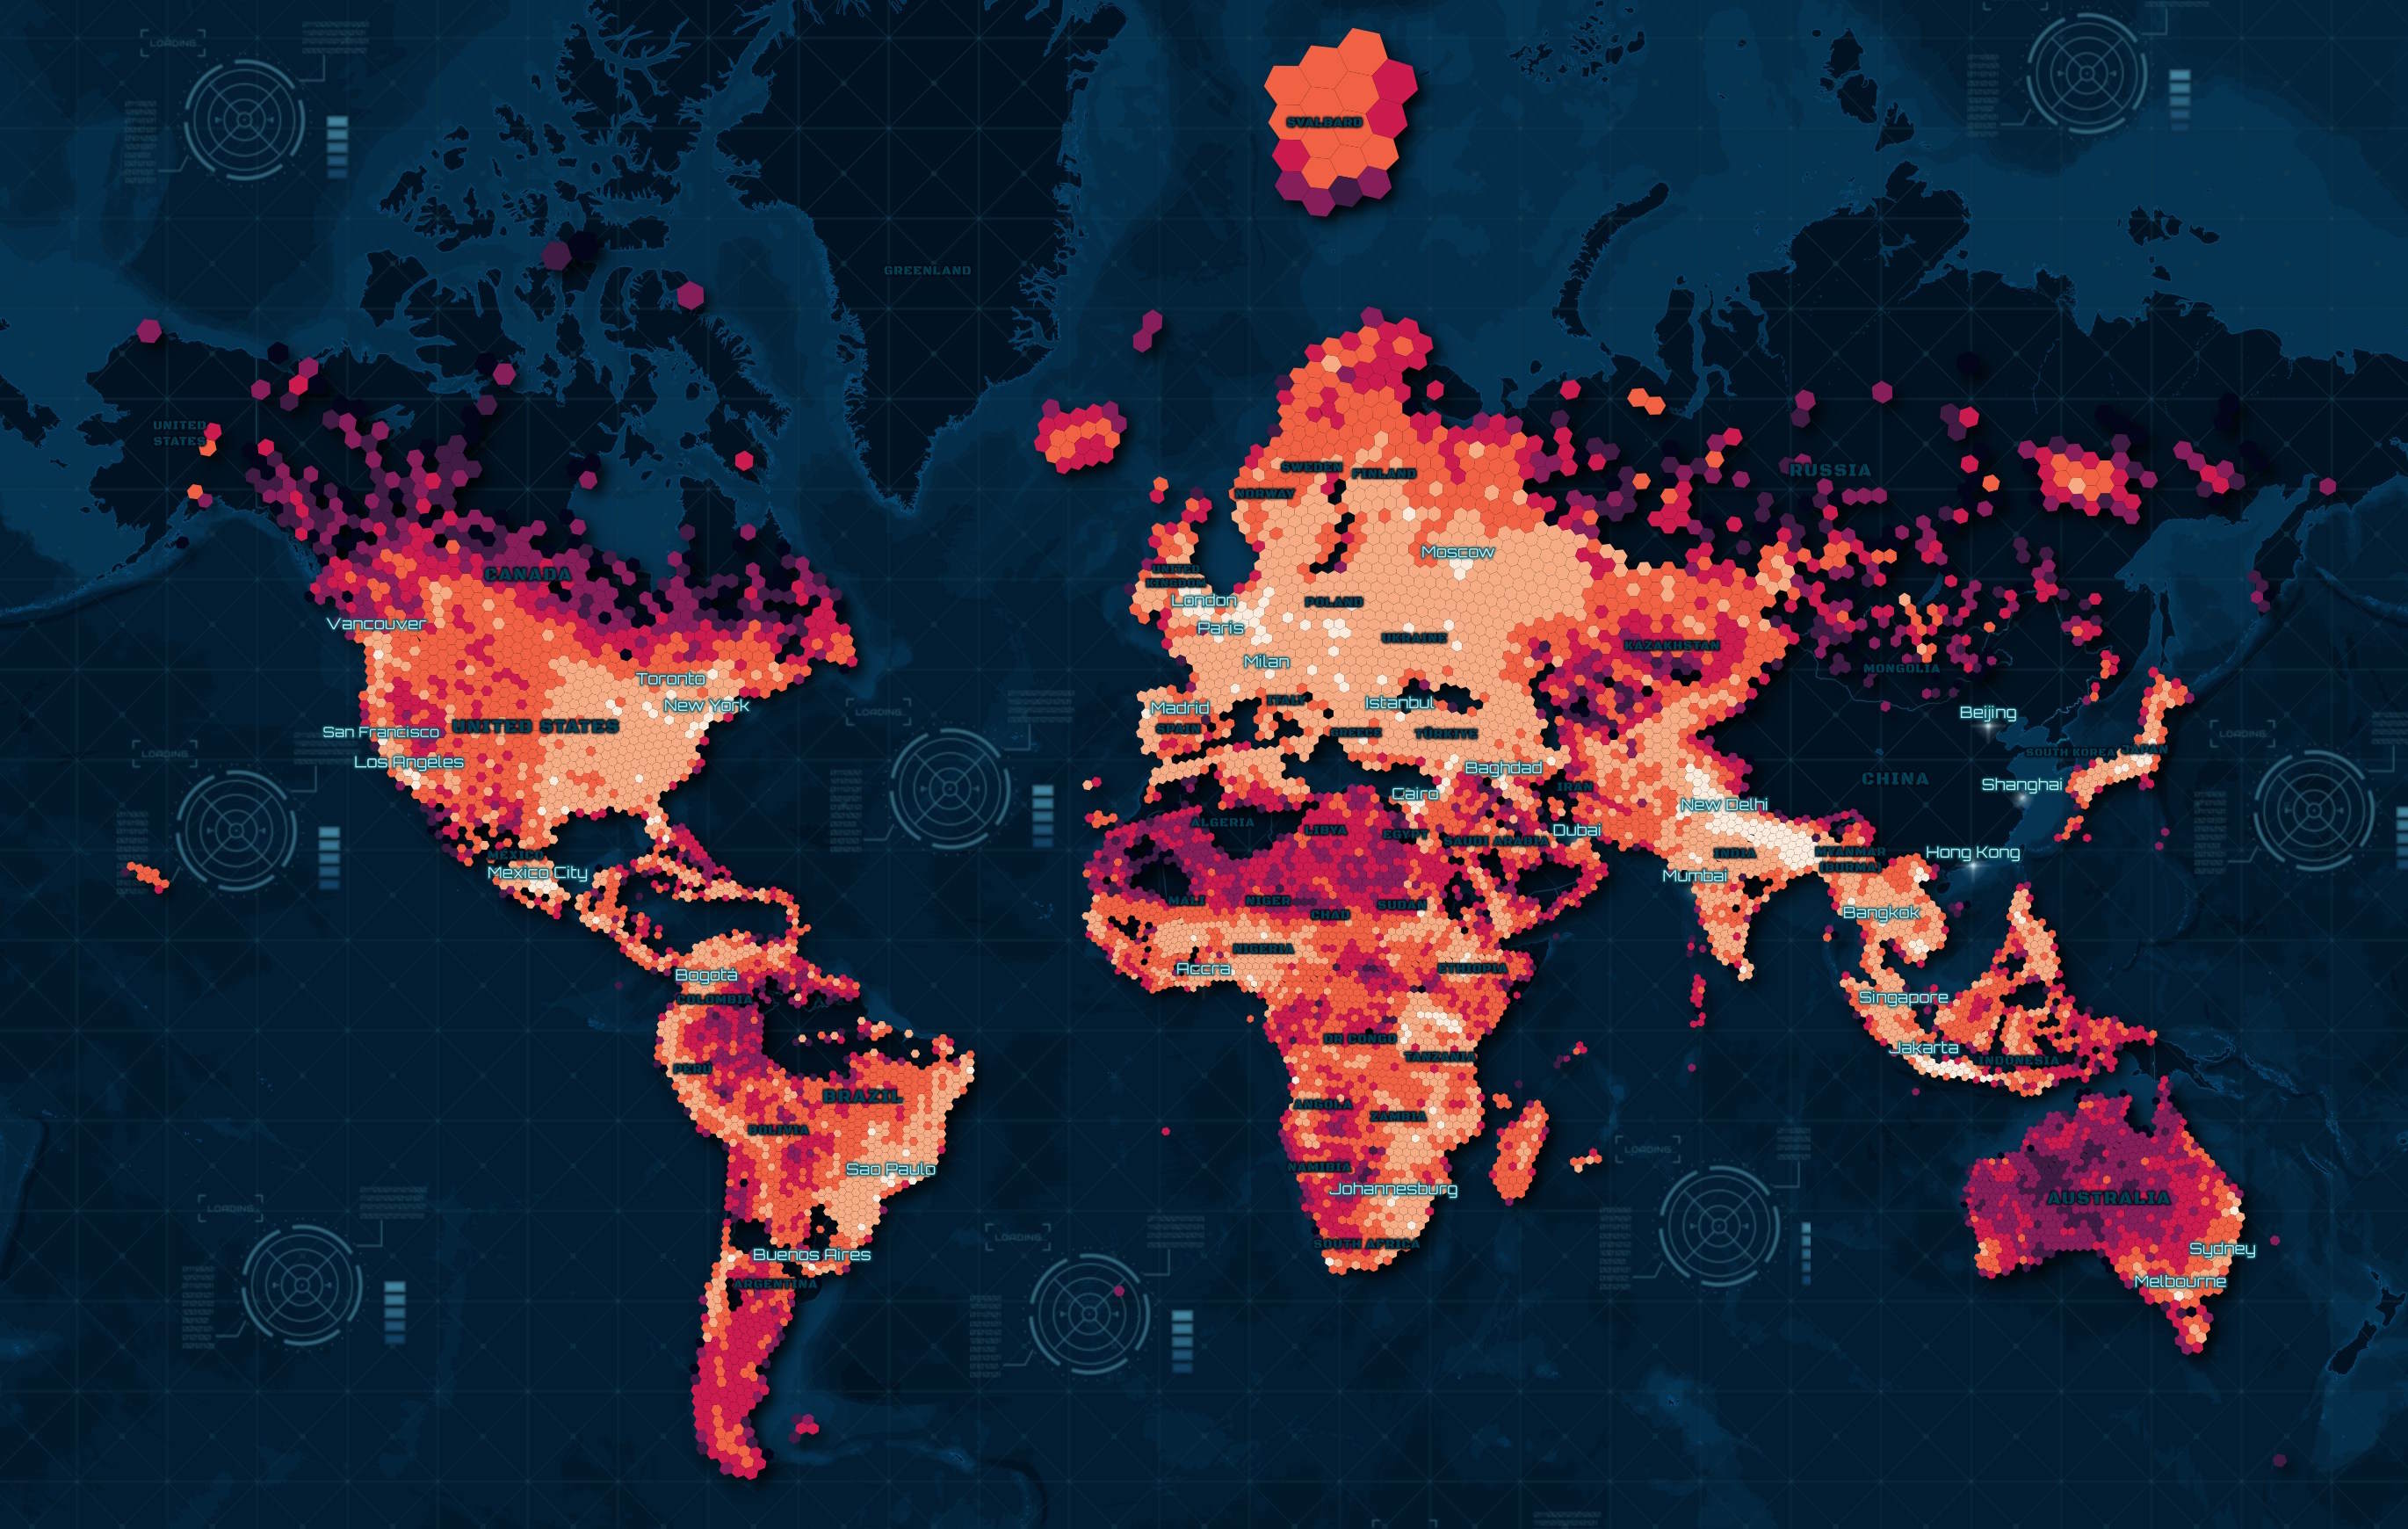
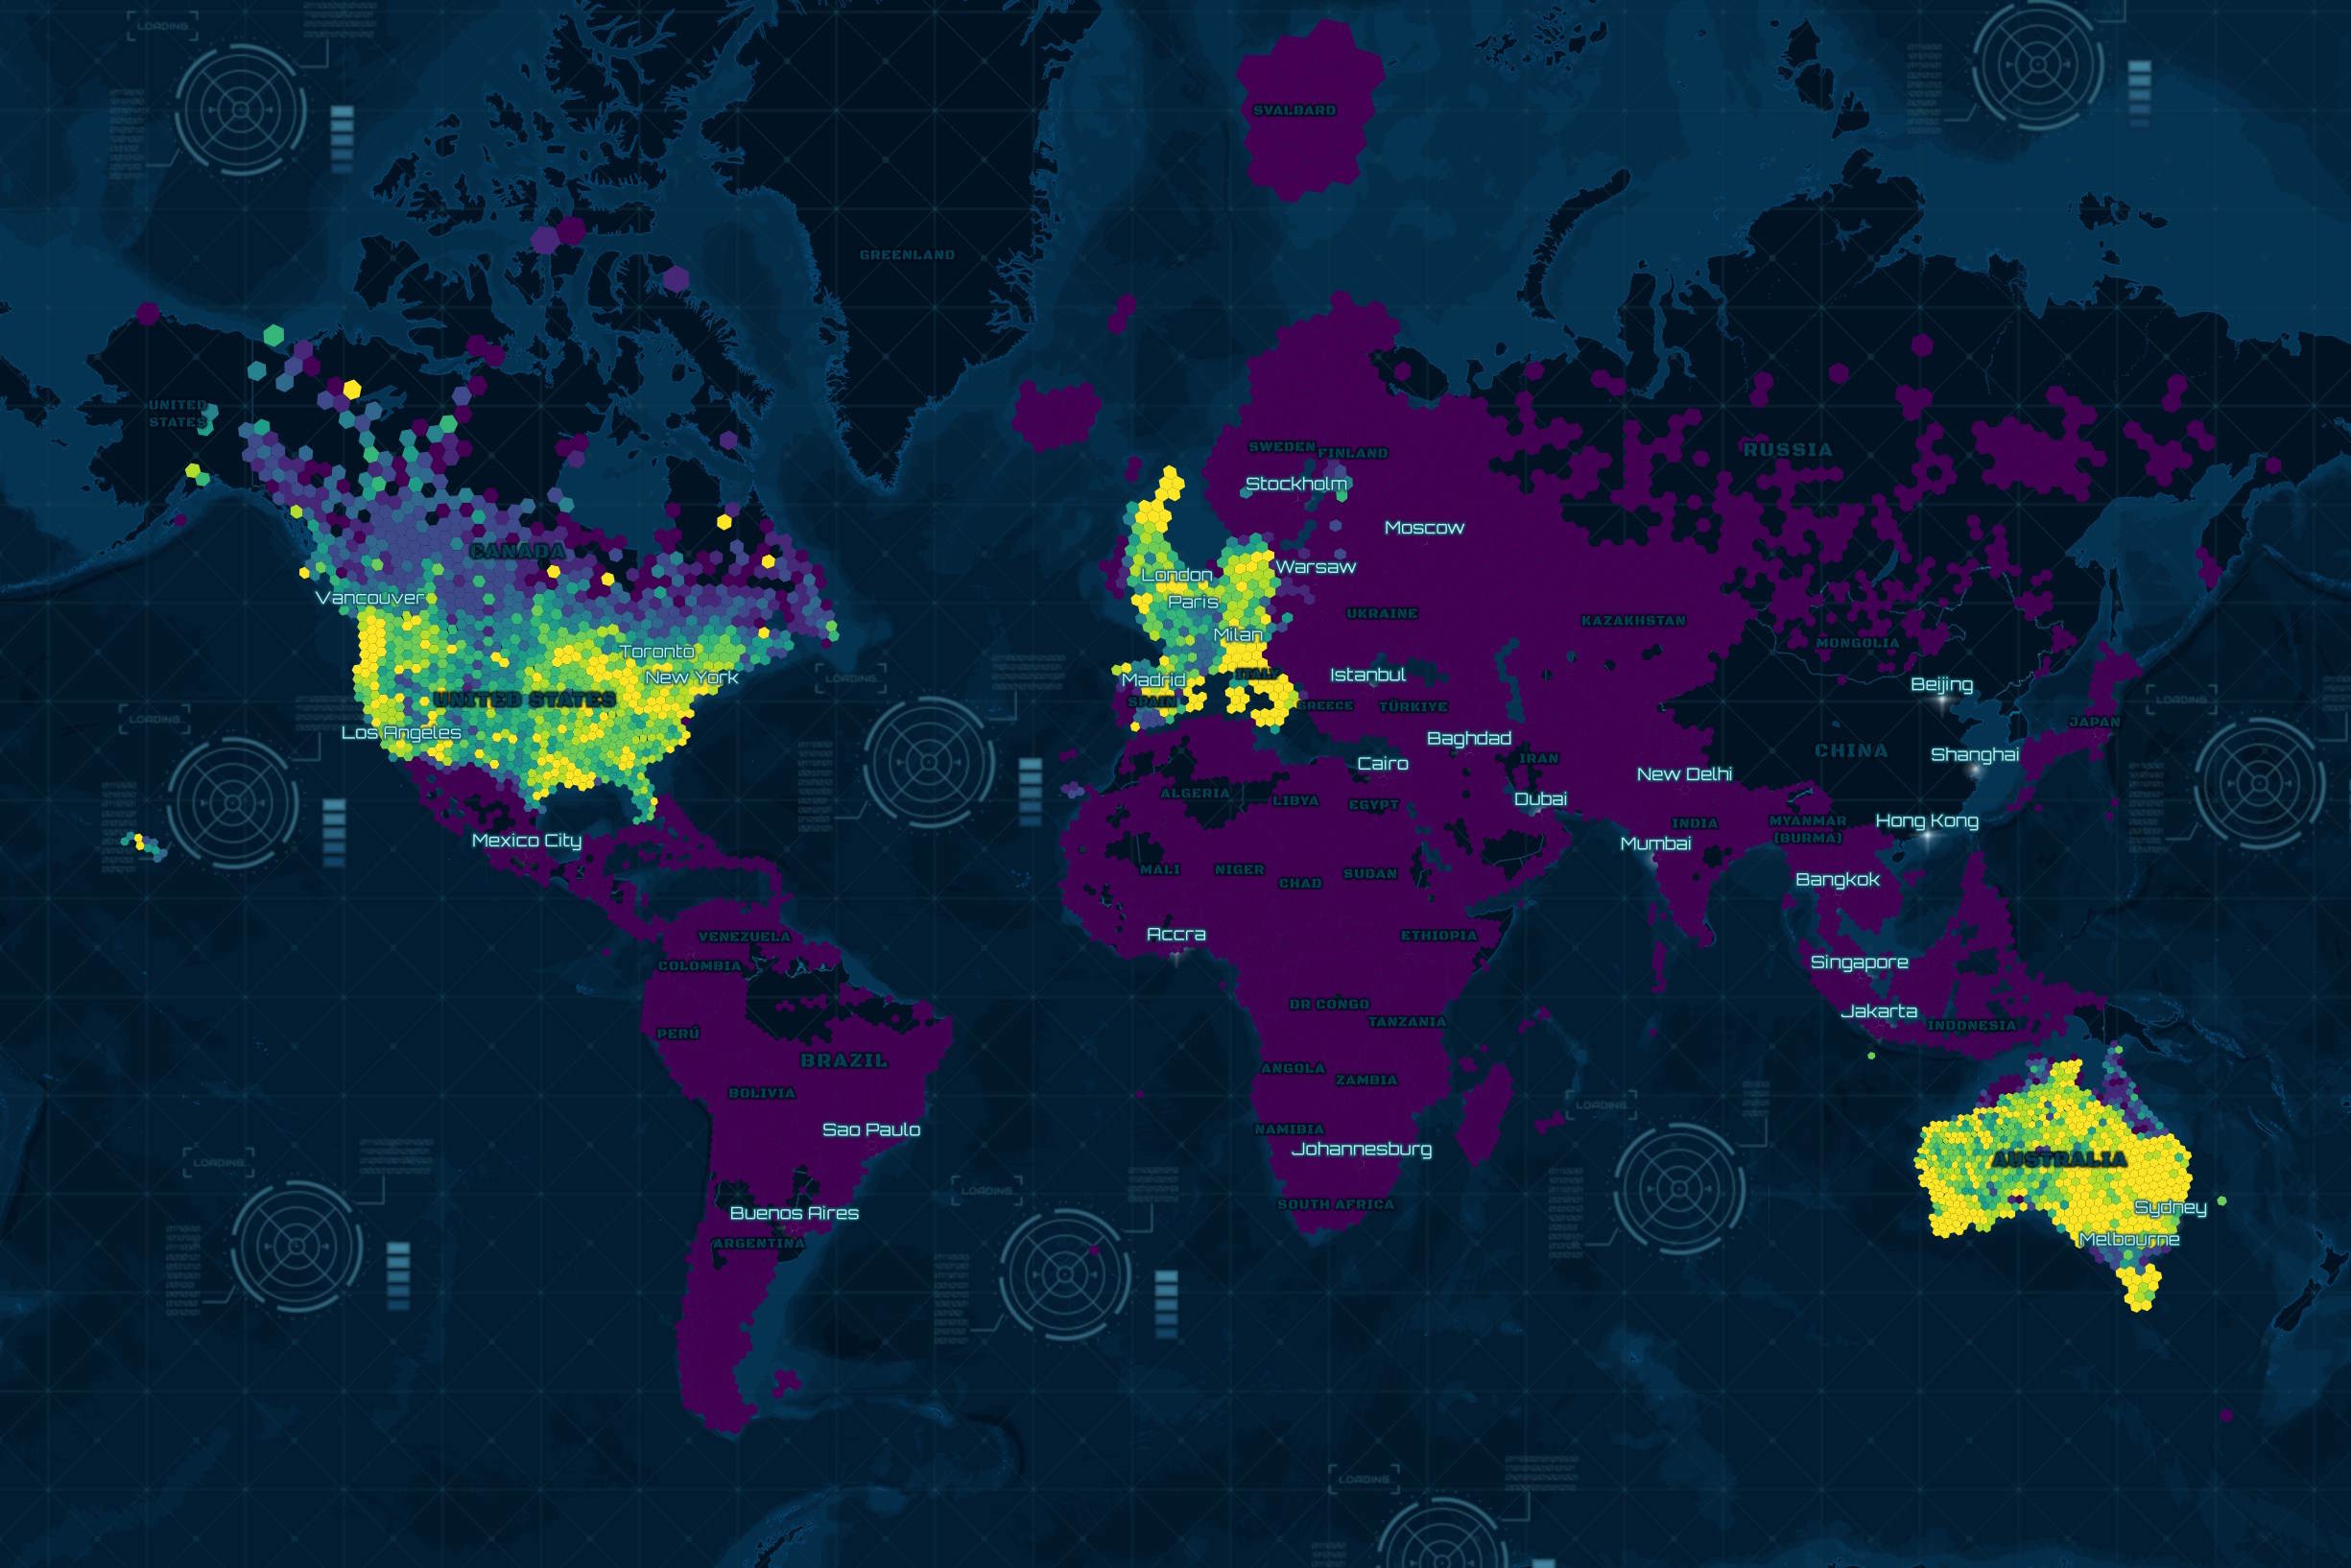
Buildings Heatmap
Below is a heatmap of the buildings across the Globe.
$ ~/duckdb
CREATE OR REPLACE TABLE h3_3_stats AS
    SELECT   h3_3: H3_LATLNG_TO_CELL(
                       bbox.ymin,
                       bbox.xmin,
                       3),
             num_locations: COUNT(*)
    FROM     'merged/*.parquet'
    GROUP BY 1;

COPY (
    SELECT geometry: ST_ASWKB(H3_CELL_TO_BOUNDARY_WKT(h3_3)::geometry),
           num_locations
    FROM   h3_3_stats
    WHERE  ST_XMIN(geometry::geometry) BETWEEN -179 AND 179
    AND    ST_XMAX(geometry::geometry) BETWEEN -179 AND 179
) TO 'merged.h3_3_stats.parquet' (
        FORMAT 'PARQUET',
        CODEC  'ZSTD',
        COMPRESSION_LEVEL 22,
        ROW_GROUP_SIZE 15000);
Building Heights
225M buildings in this dataset contain height information.
$ ~/duckdb
SELECT   COUNT(*),
         height IS NULL
FROM     'merged/*.parquet'
GROUP BY 2;
┌──────────────┬──────────────────┐
│ count_star() │ (height IS NULL) │
│    int64     │     boolean      │
├──────────────┼──────────────────┤
│    225418753 │ false            │
│   1184429436 │ true             │
└──────────────┴──────────────────┘
The brightest hexagons have the greatest ratio of buildings with height information.
CREATE OR REPLACE TABLE h3_3_stats AS
      SELECT   h3_3: H3_LATLNG_TO_CELL(
                             bbox.ymin,
                             bbox.xmin,
                             3),
               null_ratio: ROUND(100 /
                                 COUNT(*) *
                                 COUNT(*) FILTER (height IS NULL), 1)
      FROM     'merged/*.parquet'
      GROUP BY 1;

COPY (
    SELECT geometry: ST_ASWKB(H3_CELL_TO_BOUNDARY_WKT(h3_3)::geometry),
           null_ratio
    FROM   h3_3_stats
    WHERE  ST_XMIN(geometry::geometry) BETWEEN -179 AND 179
    AND    ST_XMAX(geometry::geometry) BETWEEN -179 AND 179
) TO 'height_null_ratio.h3_3_stats.parquet' (
        FORMAT 'PARQUET',
        CODEC  'ZSTD',
        COMPRESSION_LEVEL 22,
        ROW_GROUP_SIZE 15000);
Below are the hexagon counts by null ratio, binned to the nearest 10th.
SELECT   null_ratio_bin: round(null_ratio / 10) * 10,
         COUNT(*)
FROM     h3_3_stats
GROUP BY null_ratio_bin
ORDER BY 1;
┌────────────────┬──────────────┐
│ null_ratio_bin │ count_star() │
│     double     │    int64     │
├────────────────┼──────────────┤
│            0.0 │          318 │
│           10.0 │          372 │
│           20.0 │          292 │
│           30.0 │          260 │
│           40.0 │          202 │
│           50.0 │          158 │
│           60.0 │          131 │
│           70.0 │          187 │
│           80.0 │          180 │
│           90.0 │          116 │
│          100.0 │         6996 │
├────────────────┴──────────────┤
│ 11 rows             2 columns │
└───────────────────────────────┘
Confidence Levels
334M Buildings in this dataset have a confidence level attached to their record.
$ ~/duckdb
SELECT   COUNT(*),
         confidence IS NULL
FROM     'merged/*.parquet'
GROUP BY 2;
┌──────────────┬──────────────────────┐
│ count_star() │ (confidence IS NULL) │
│    int64     │       boolean        │
├──────────────┼──────────────────────┤
│   1065597051 │ true                 │
│    344251138 │ false                │
└──────────────┴──────────────────────┘
Below are the most common confidence values for locations with them broken down by hexagons at zoom-level 5.
CREATE OR REPLACE TABLE h3_5s AS
    WITH b AS (
        WITH a AS (
            SELECT   H3_LATLNG_TO_CELL(bbox.ymin,
                                       bbox.xmin,
                                       5) h3_5,
                     confidence,
                     COUNT(*) num_recs
            FROM     'merged/*.parquet'
            GROUP BY 1, 2
        )
        SELECT *,
               ROW_NUMBER() OVER (PARTITION BY h3_5
                                  ORDER BY     num_recs DESC) AS rn
        FROM   a
    )
    FROM     b
    WHERE    rn = 1
    ORDER BY num_recs DESC;

COPY (
    SELECT geometry: H3_CELL_TO_BOUNDARY_WKT(h3_5)::GEOMETRY,
           confidence
    FROM   h3_5s
    WHERE  ST_XMIN(geometry::geometry) BETWEEN -179 AND 179
    AND    ST_XMAX(geometry::geometry) BETWEEN -179 AND 179
) TO 'confidence.h3_5_stats.parquet' (
    FORMAT 'PARQUET',
    CODEC  'ZSTD',
    COMPRESSION_LEVEL 22,
    ROW_GROUP_SIZE 15000);
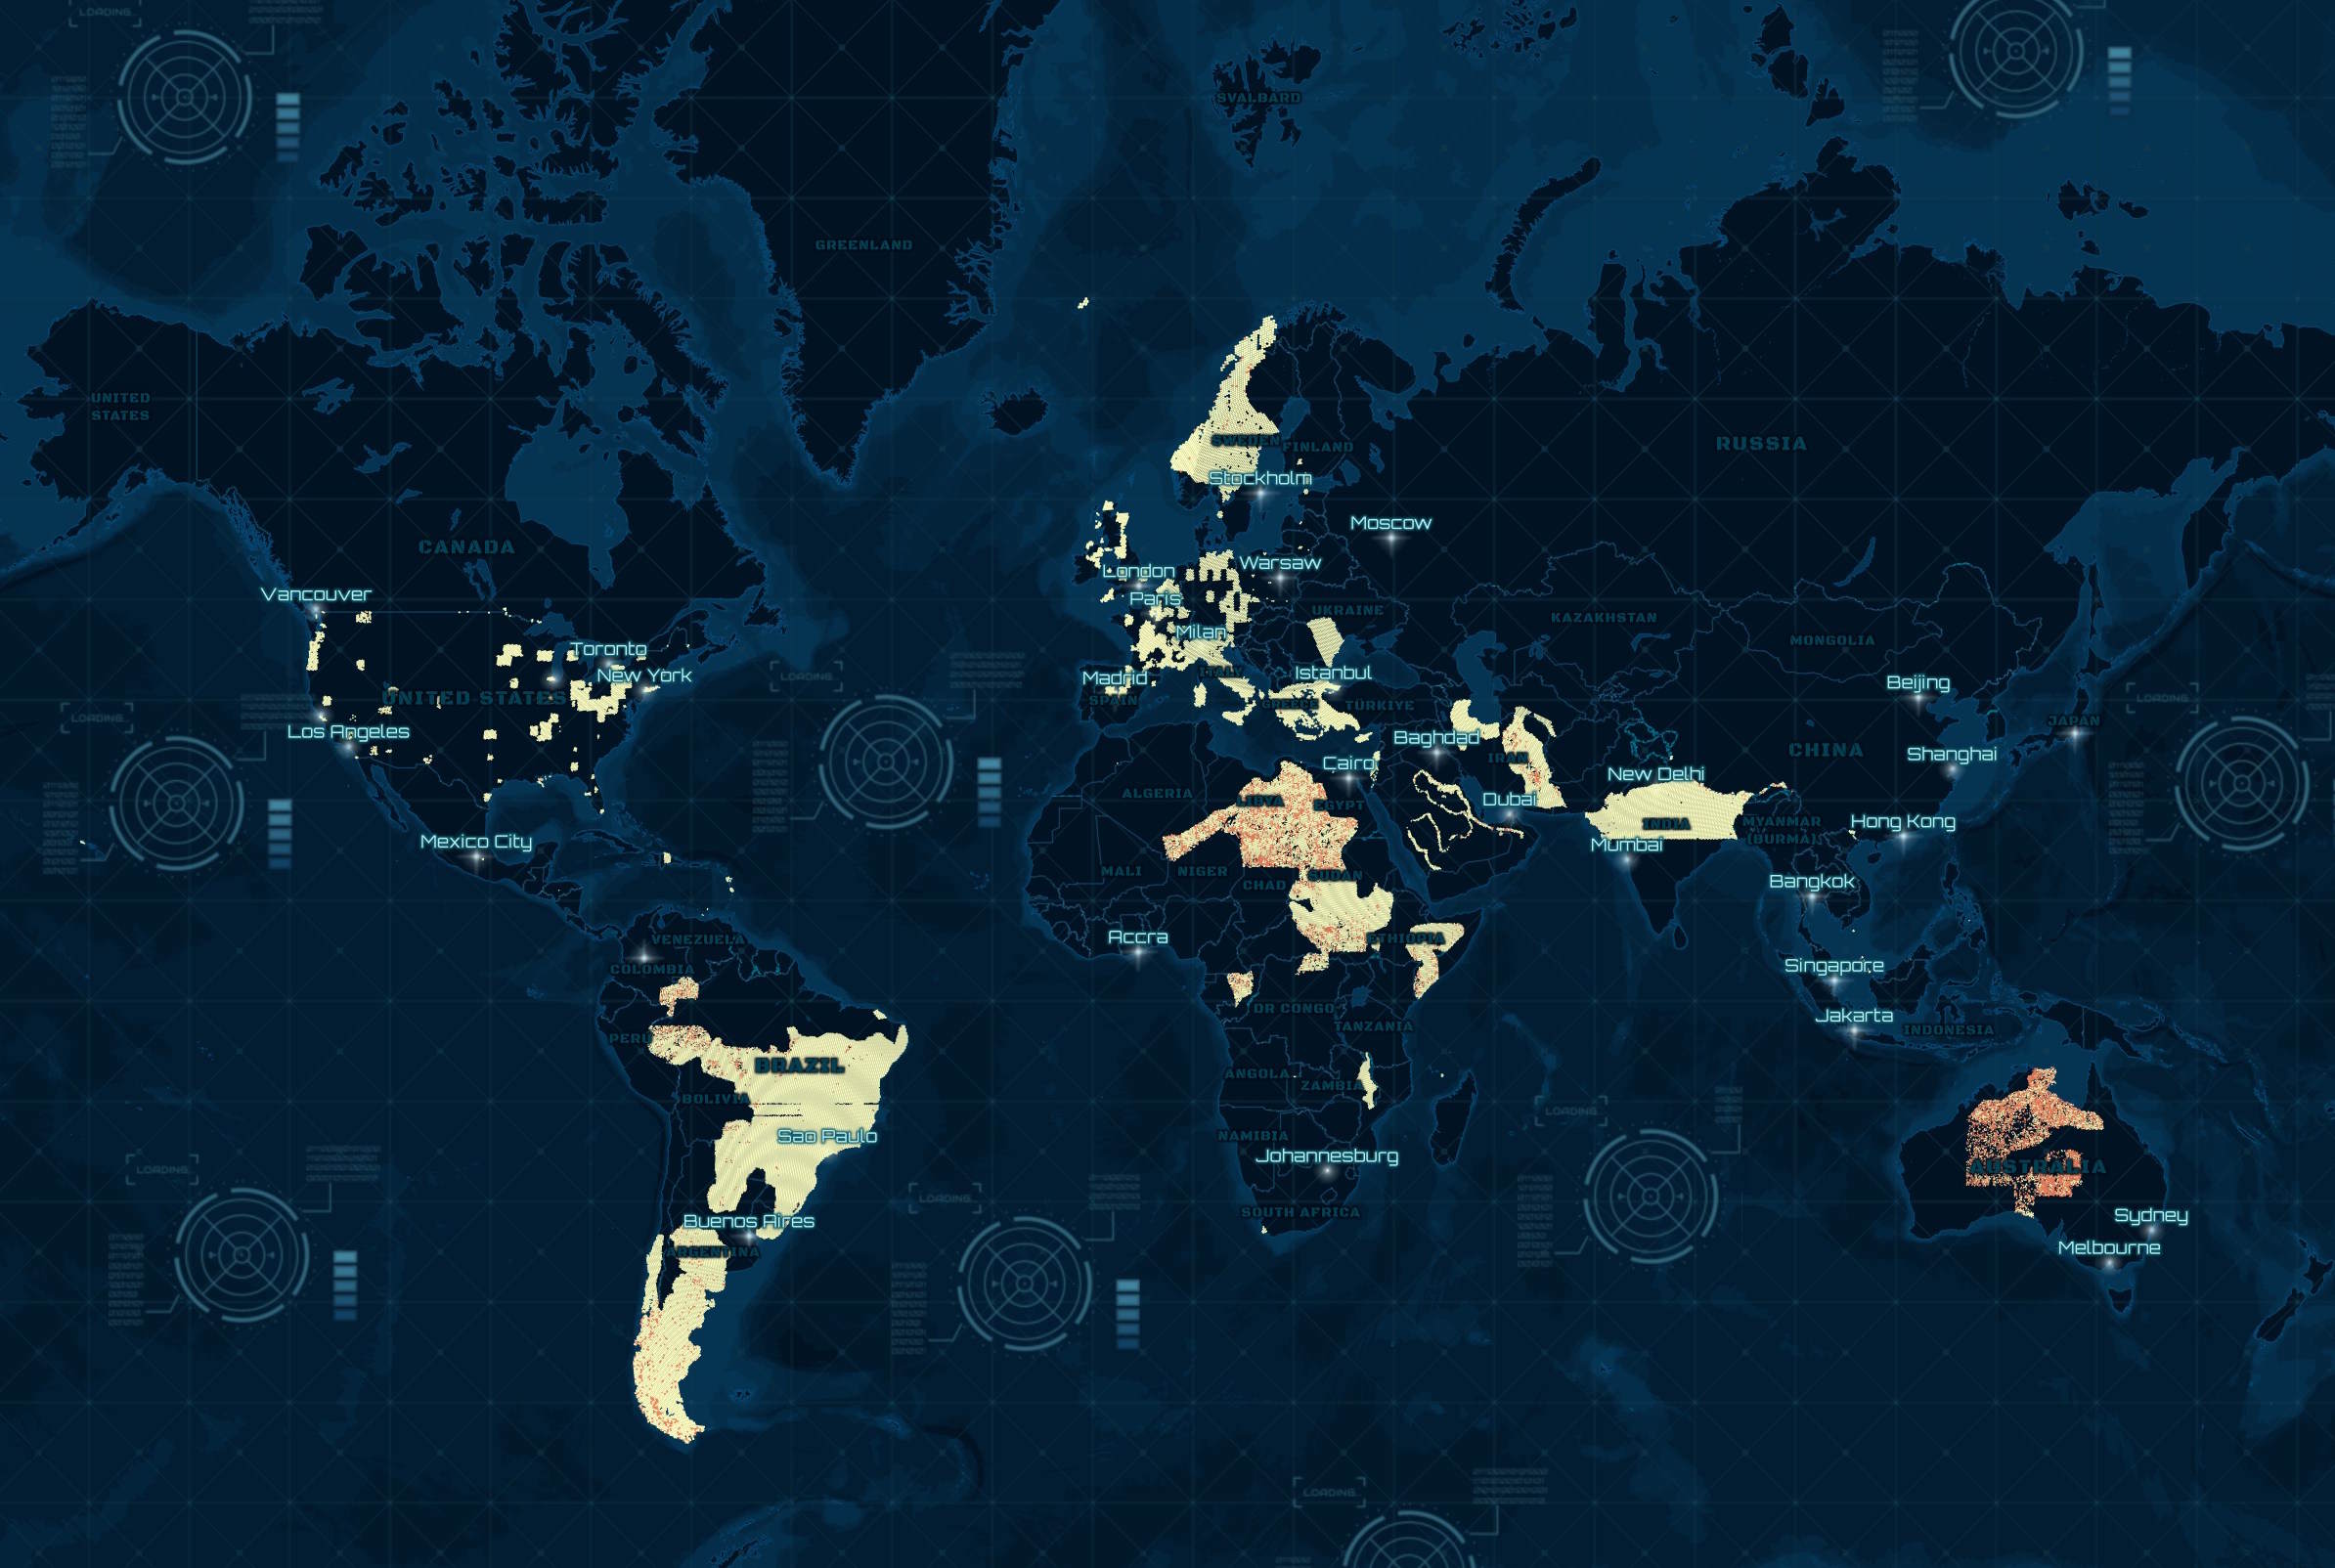
Below are the hexagon counts by confidence value. In almost all cases, where there is a confidence level, it's above 90%.
SELECT   confidence,
         COUNT(*)
FROM     h3_5s
GROUP BY confidence
ORDER BY 1;
┌────────────┬──────────────┐
│ confidence │ count_star() │
│   double   │    int64     │
├────────────┼──────────────┤
│        0.2 │            1 │
│        0.4 │            1 │
│        0.5 │            6 │
│        0.6 │            6 │
│        0.7 │           10 │
│        0.8 │           52 │
│        0.9 │         8748 │
│        1.0 │        67702 │
│       NULL │       233423 │
└────────────┴──────────────┘
It's a shame the confidence level couldn't be applied more stringently or allow for more nuance beyond most records having no confidence level at all.
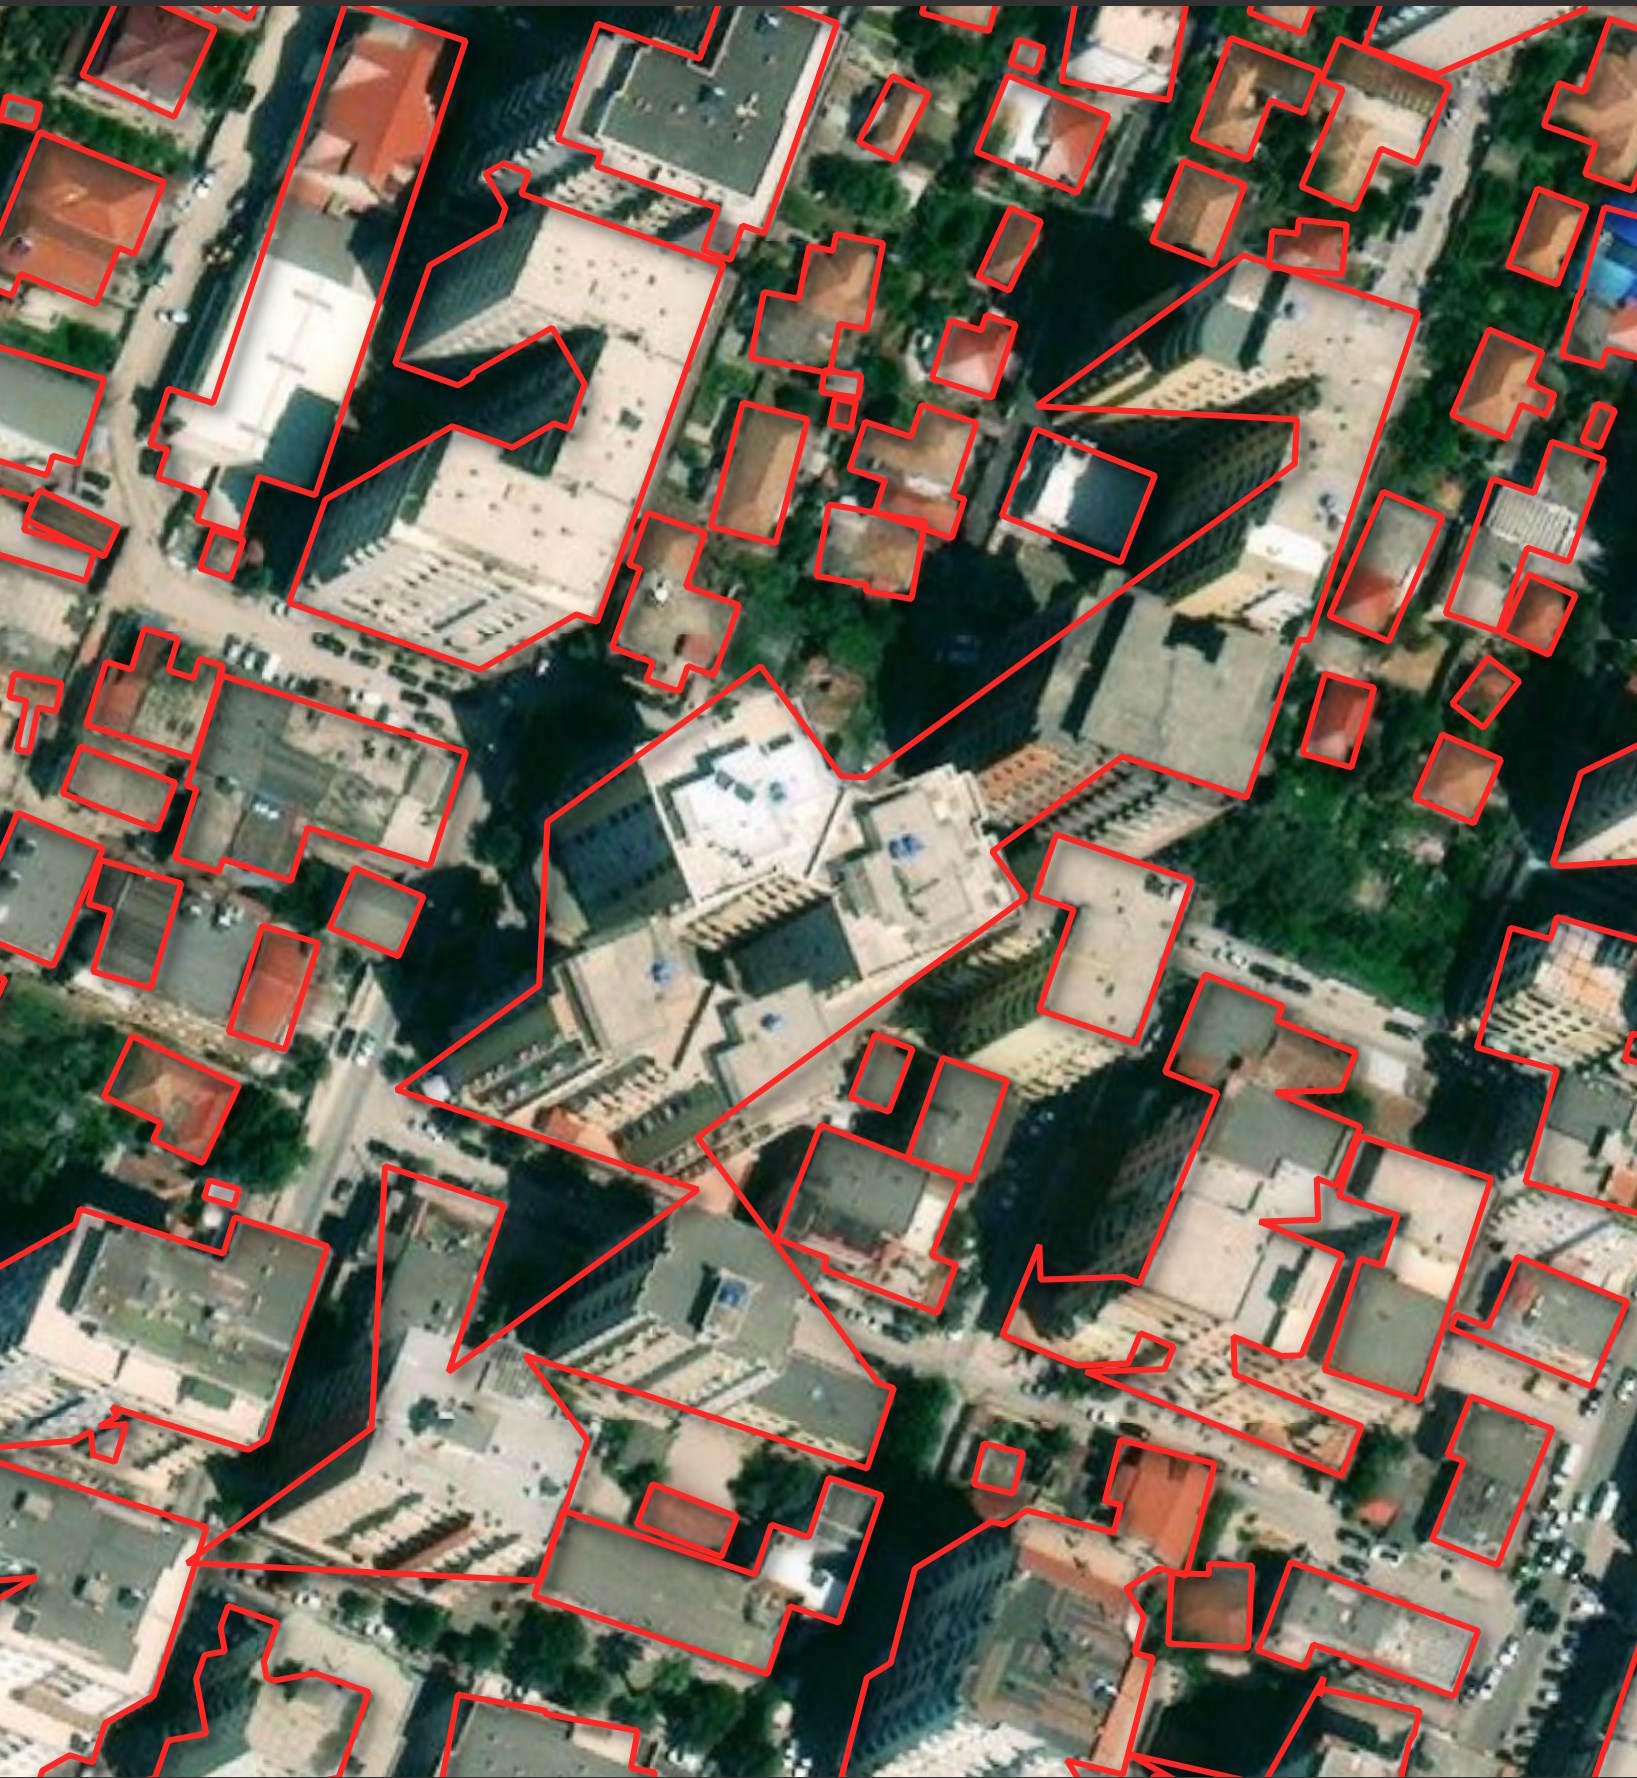
Detection Edge Cases
Below, I'll go over some of the strange detection edge cases I've come across in this dataset. This shouldn't suggest these problems are widespread, just that when there is an issue with a building's footprint being detected, these are some of the ways they're manifested.
Below, at least six apartment buildings in Albania are detected as a single building. I don't know what imagery Microsoft used for this detection but the latest imagery on Bing has these buildings captured off-nadir in a way that lines up well with the detection. These buildings aren't very tall by global standards and even they suffer from the sides of the buildings being included in the building footprint.
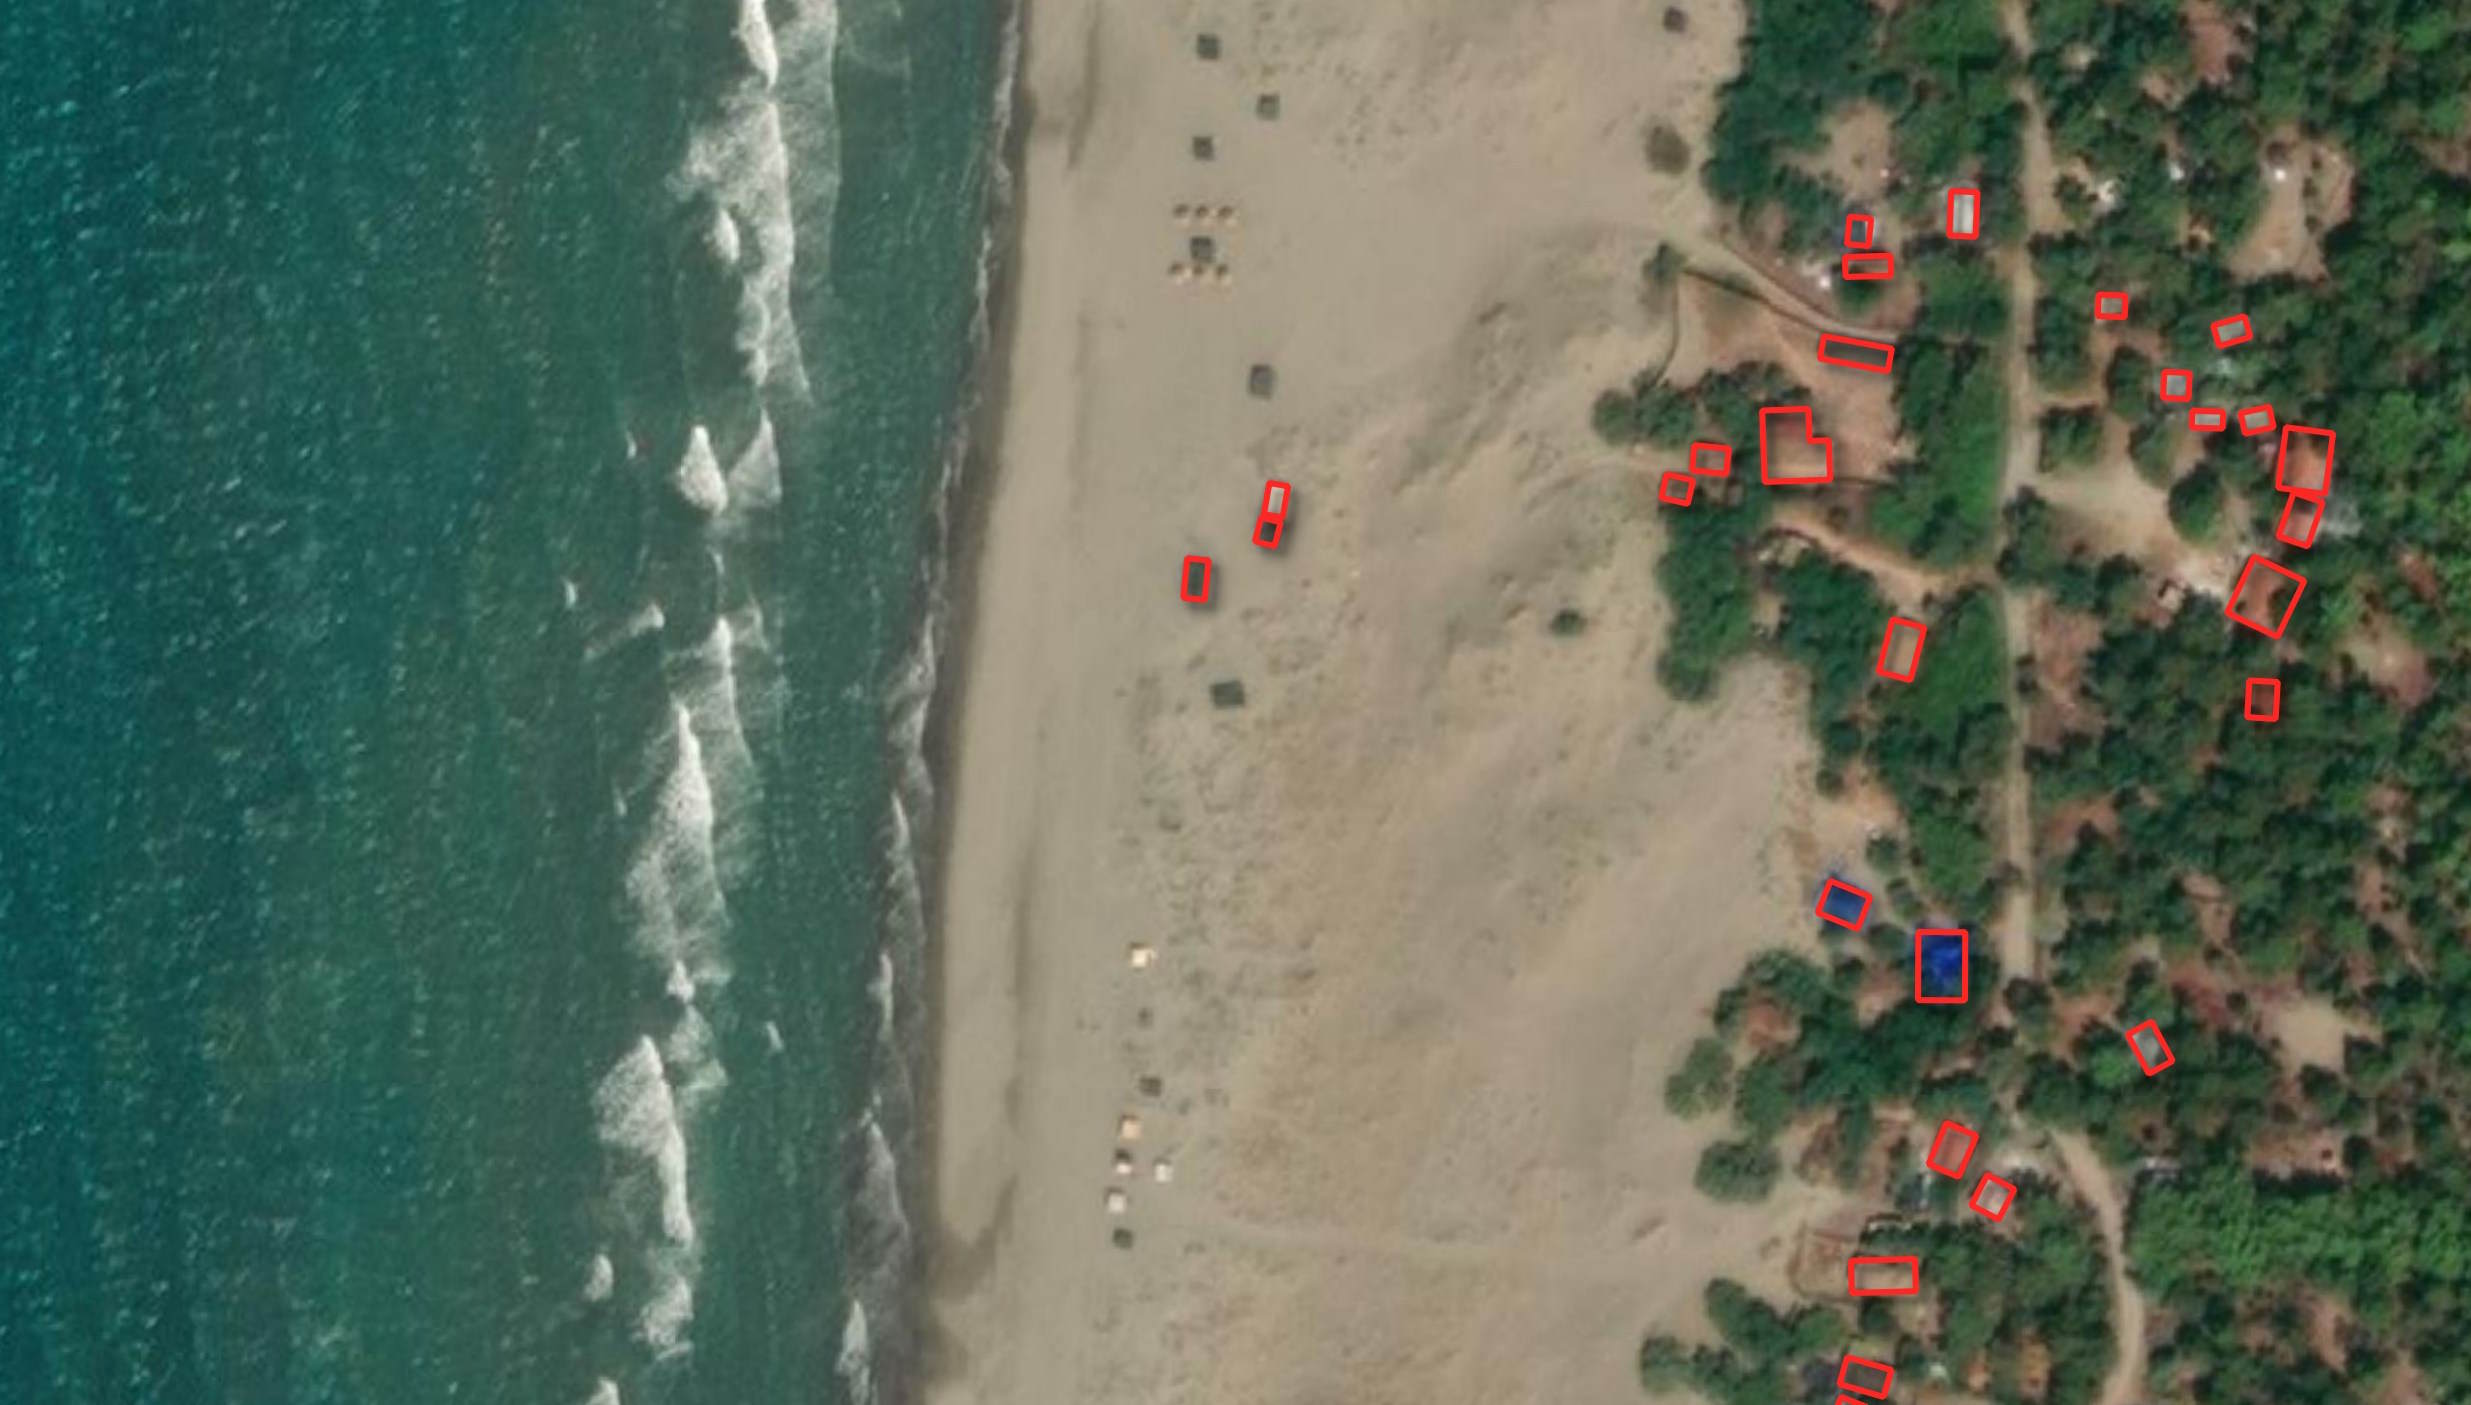
Some of the pieces of furniture laid out on the Albanian beach below are detected as buildings.
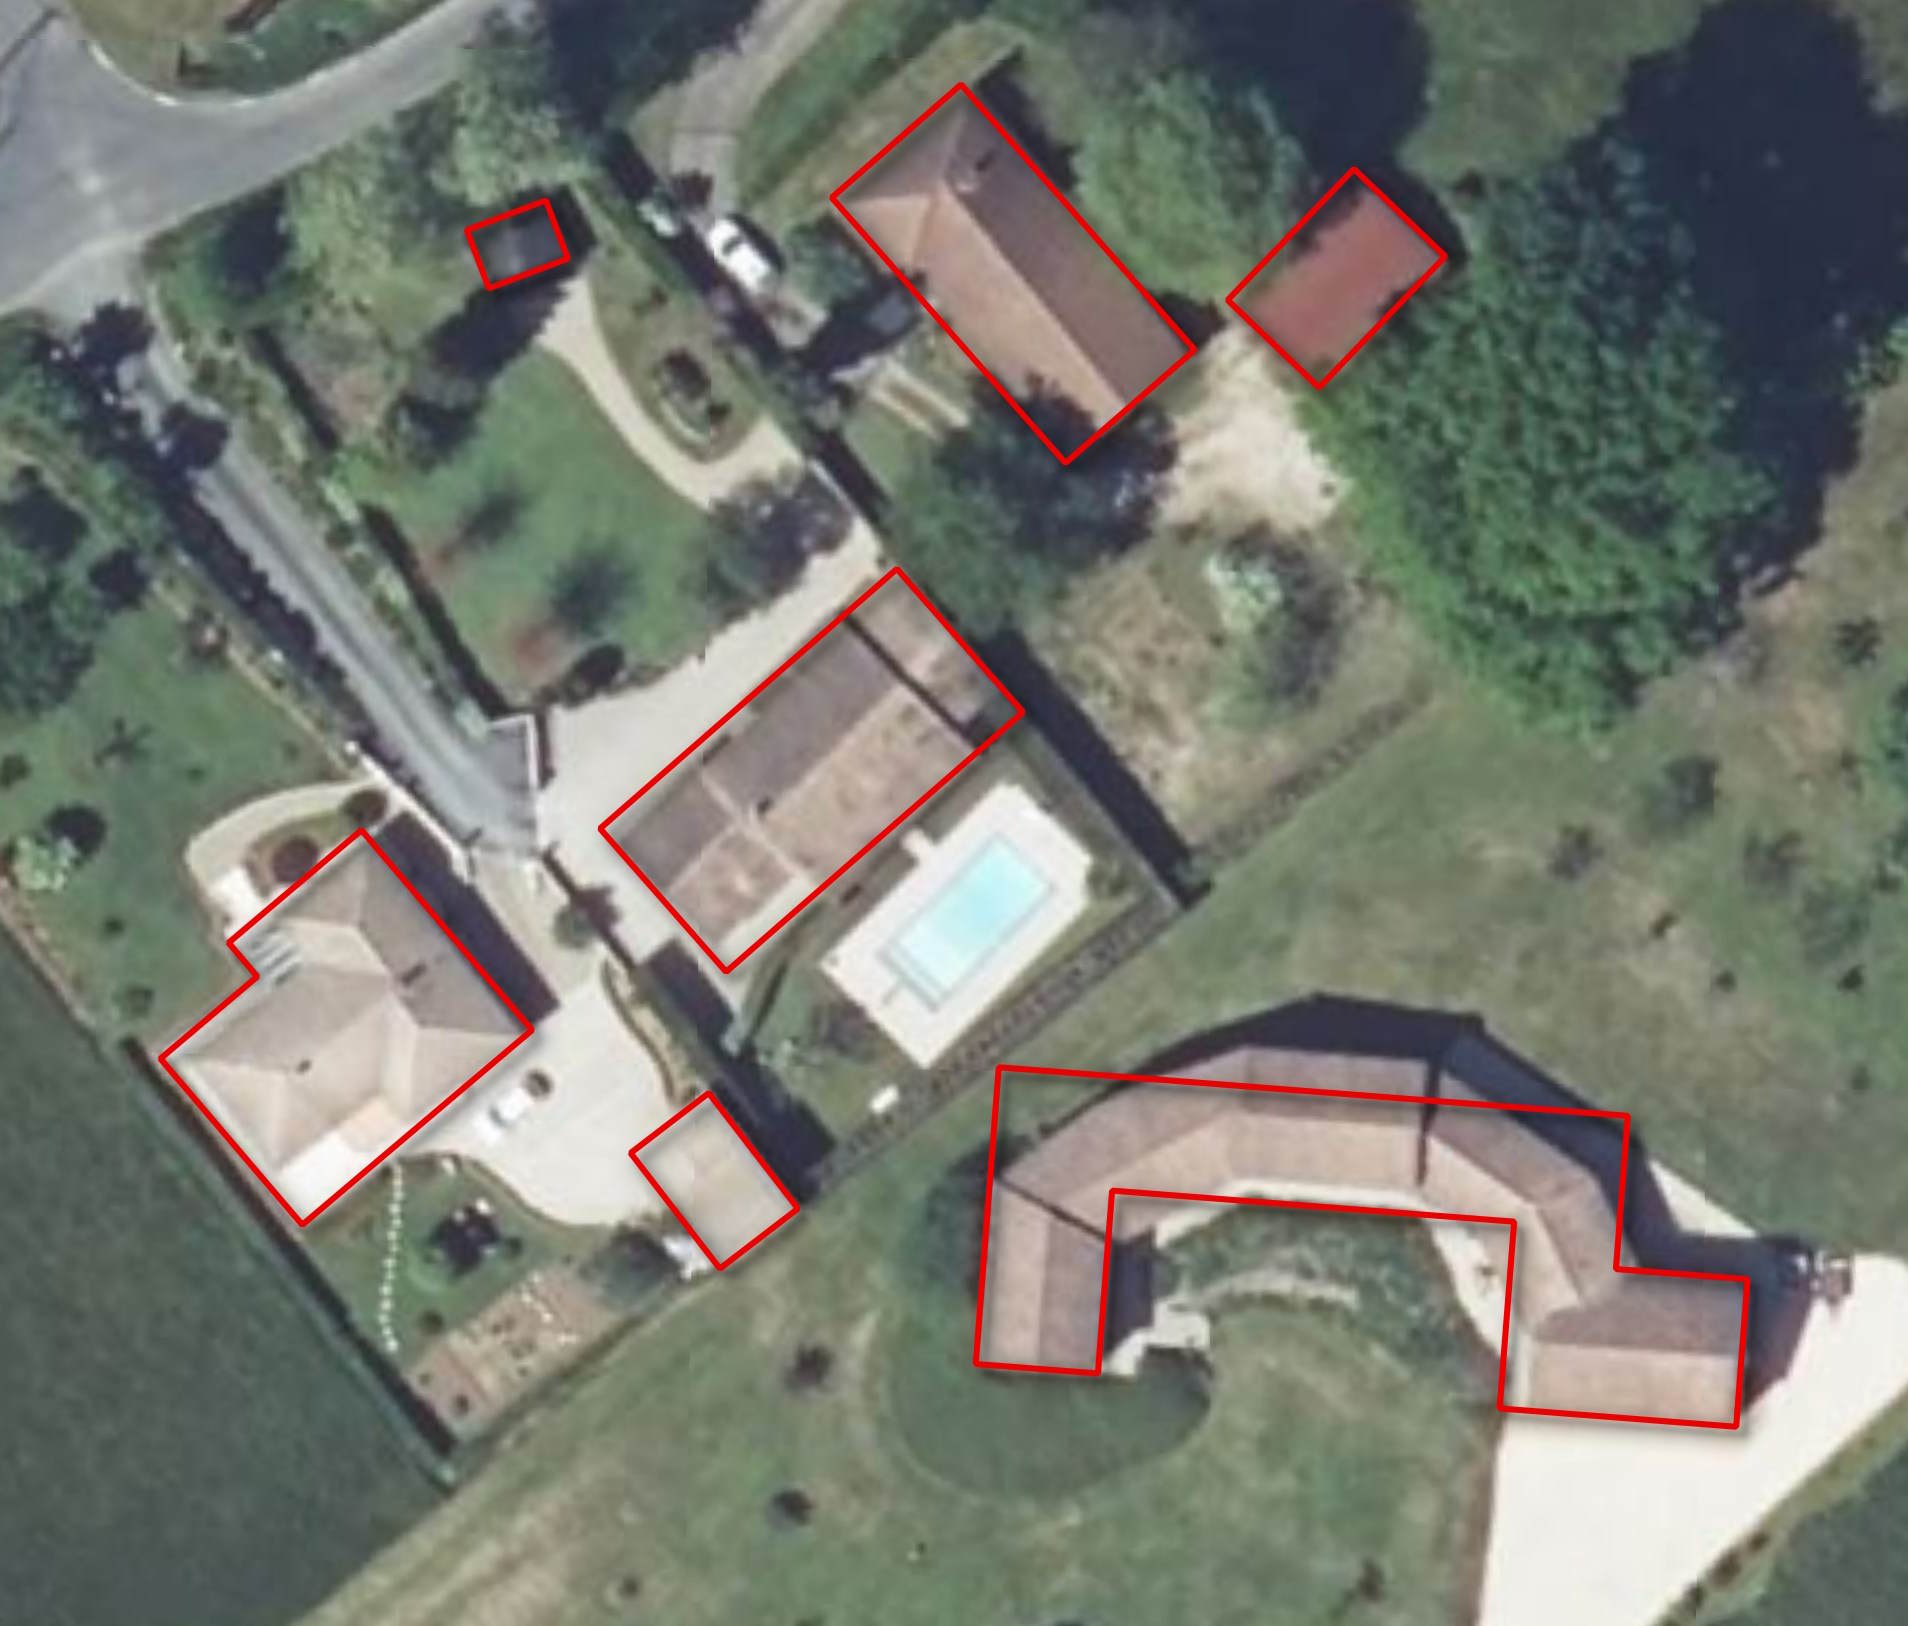
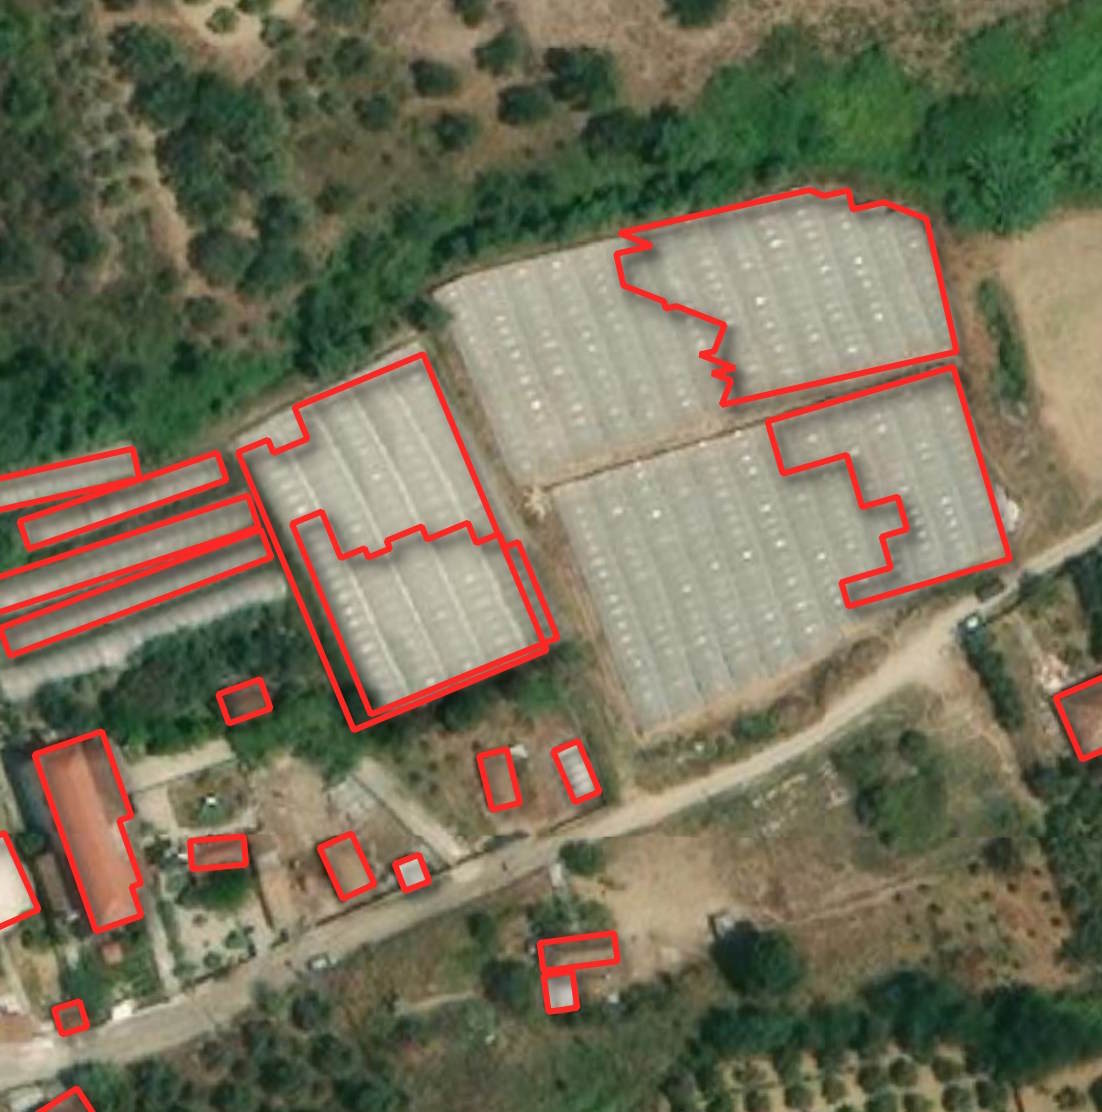
Larger buildings might not be completely detected and may be left with unnatural shapes.
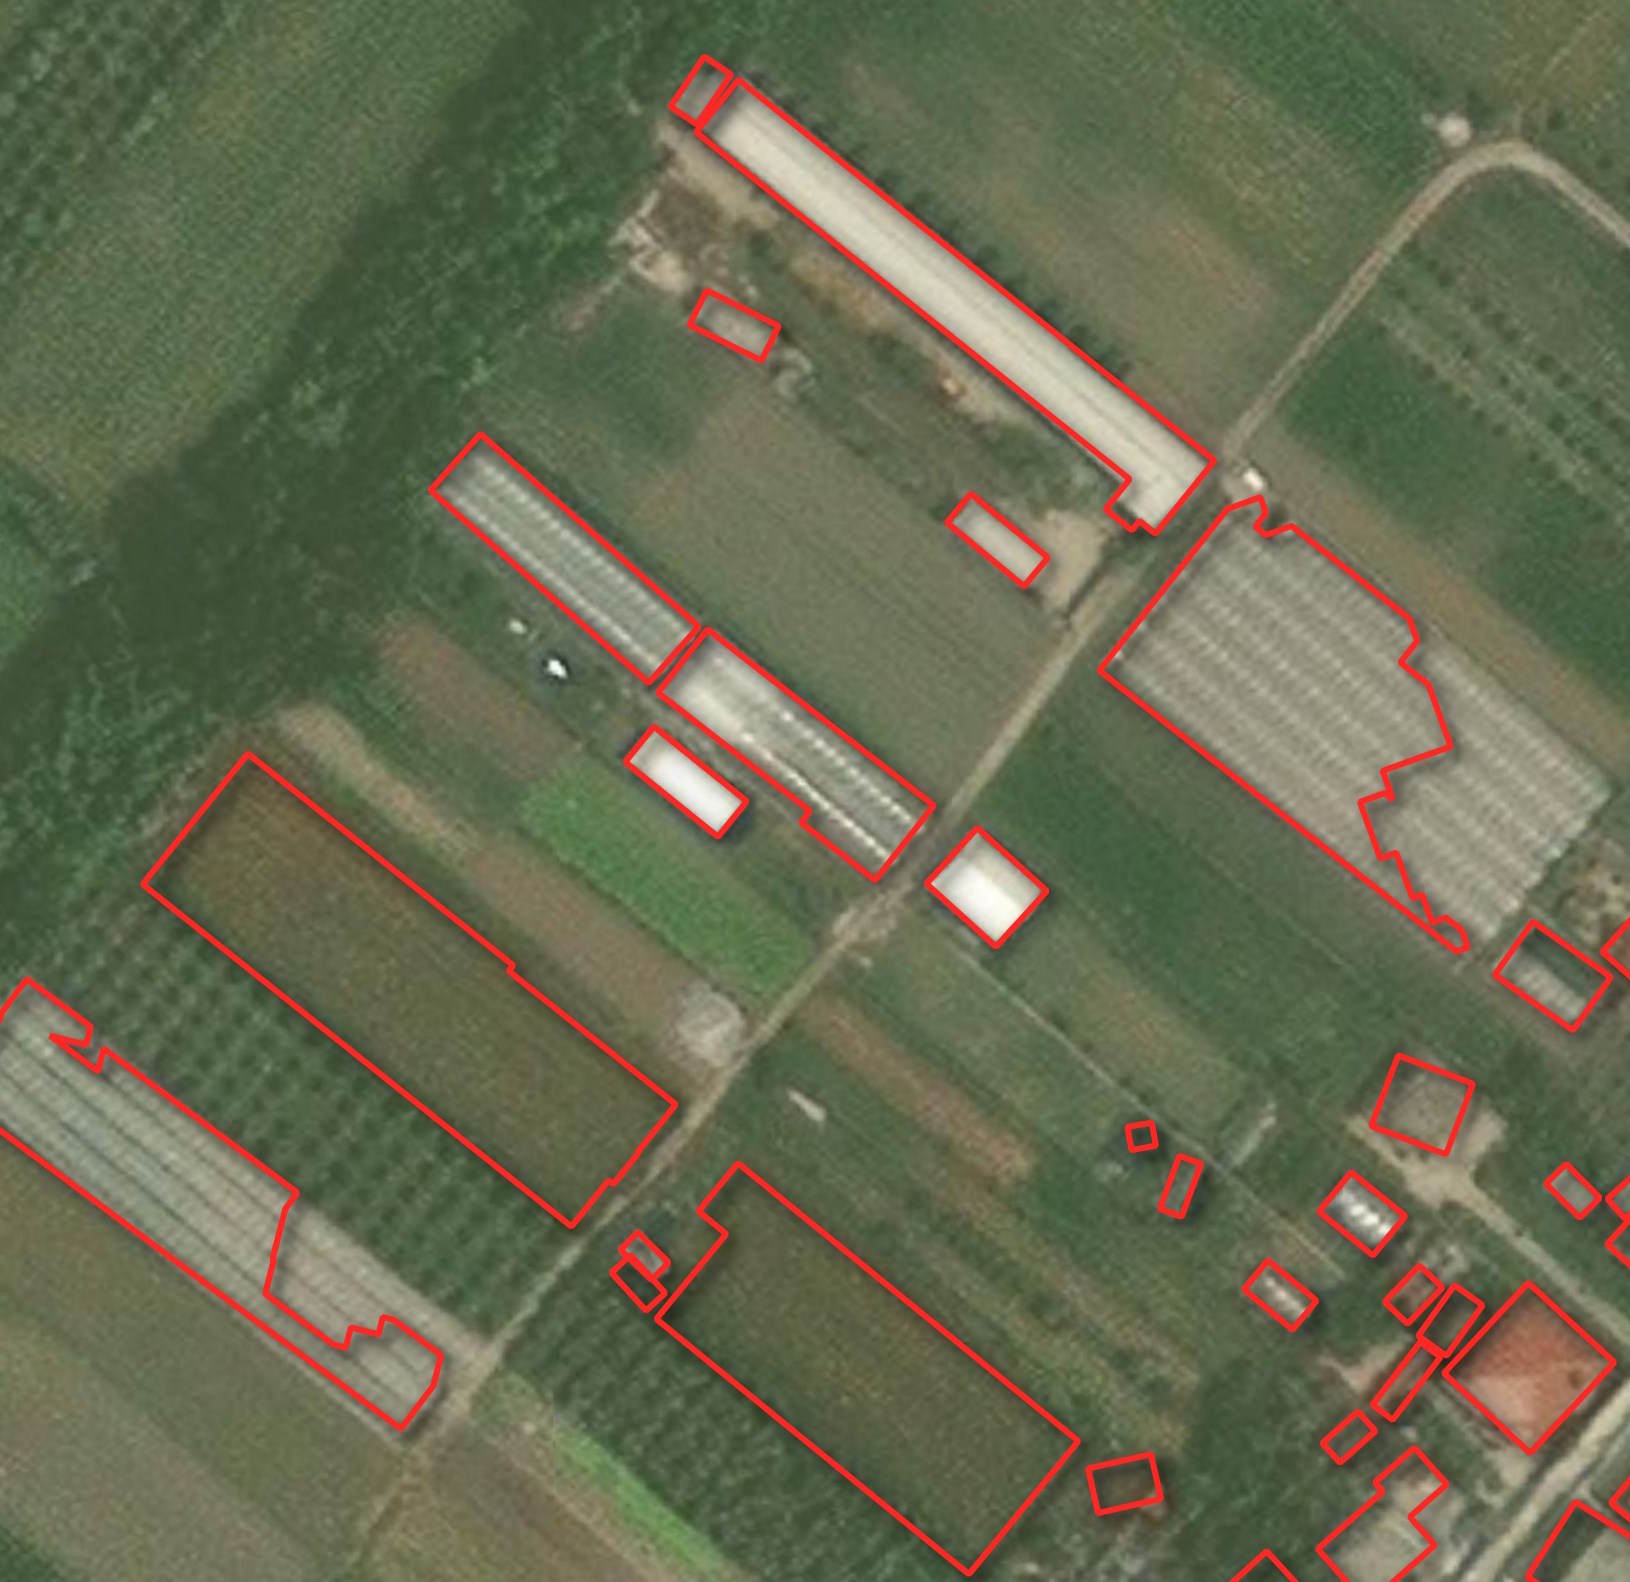
There can be footprints that overlap one another.
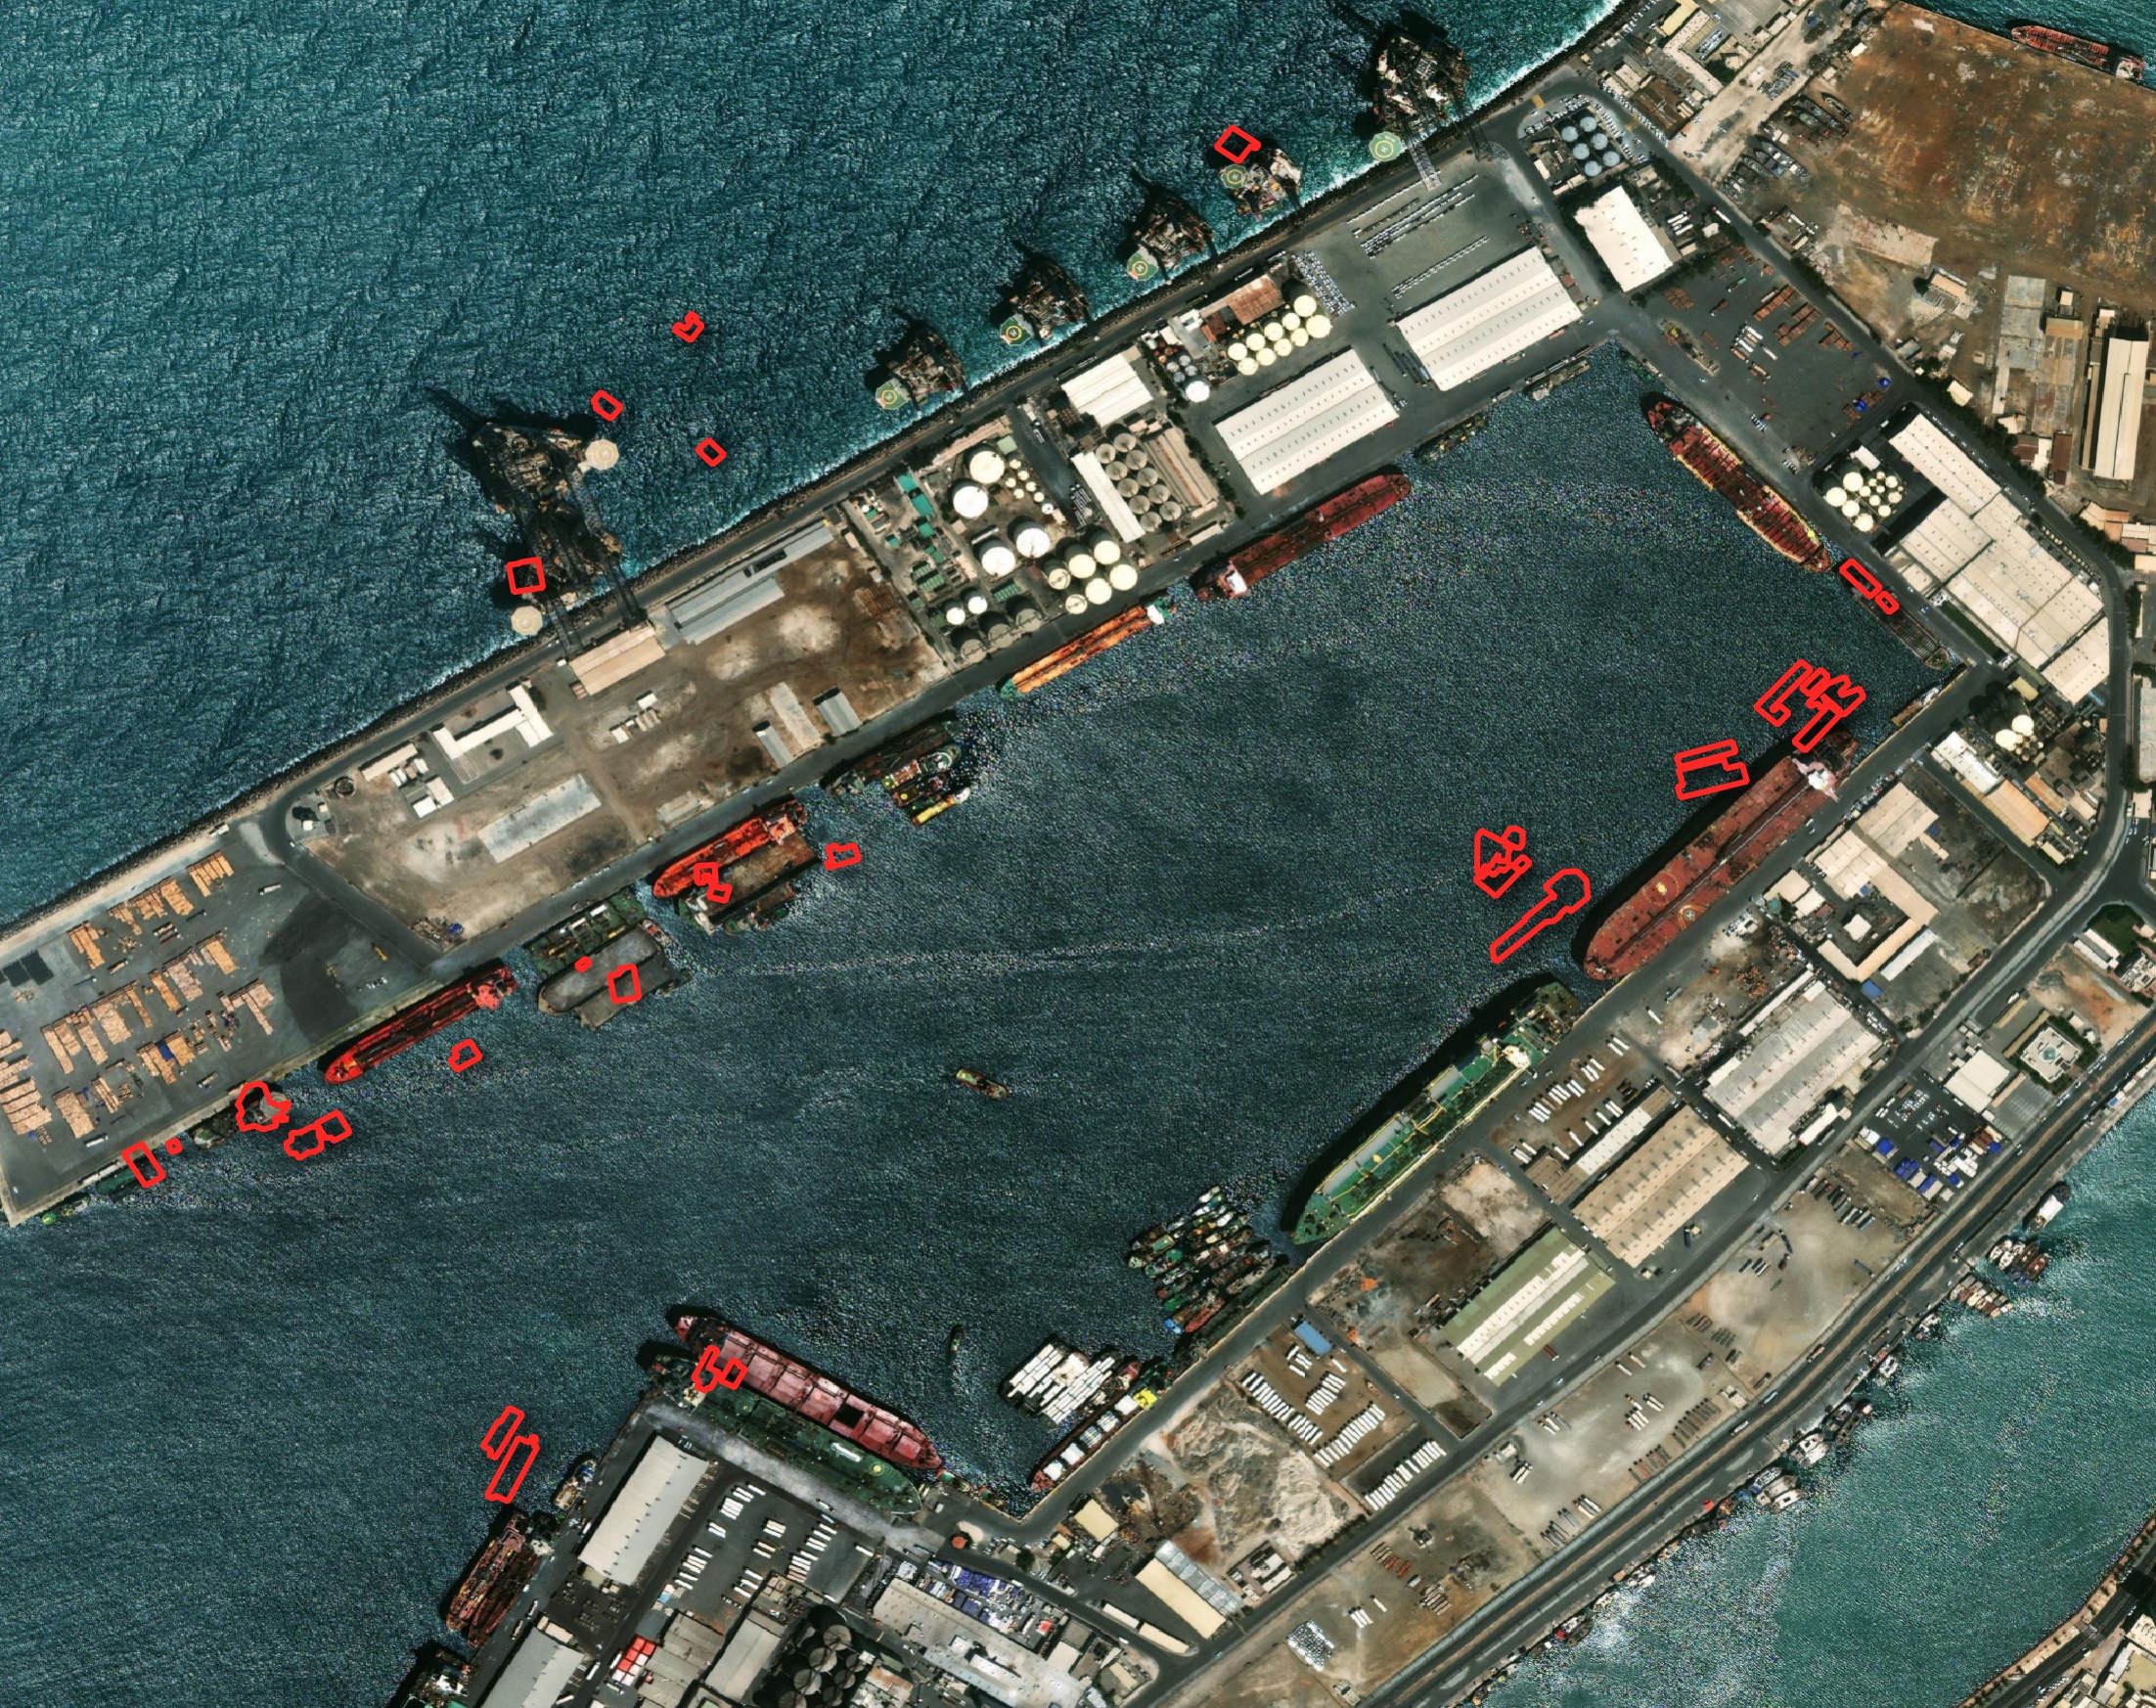
Below, there are maritime vessels being mistaken for buildings.
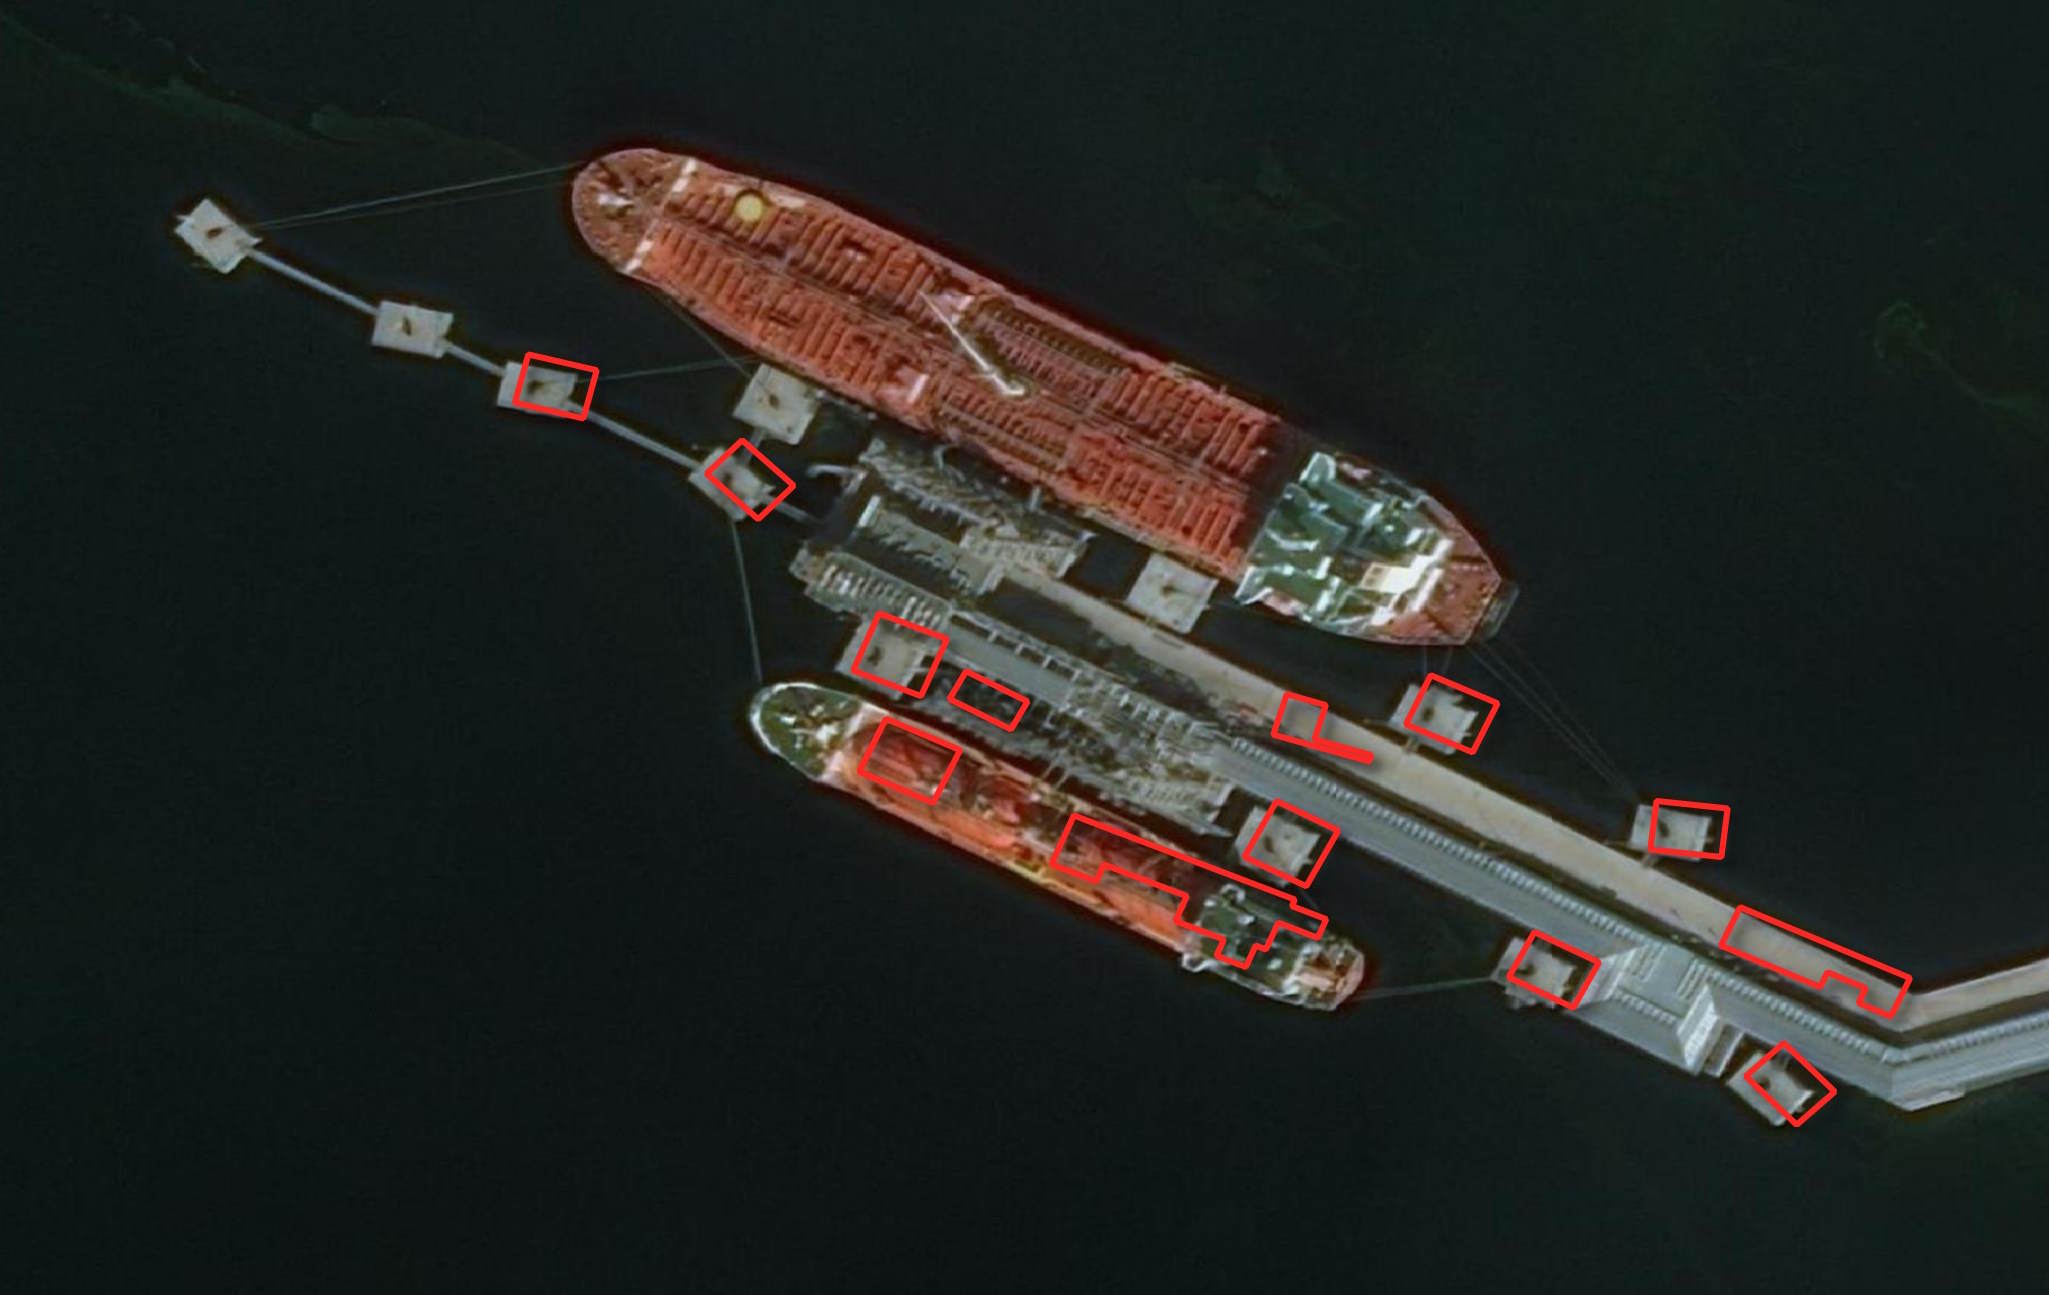
The Omani hydrocarbon-maritime infrastructure below was mistaken for buildings.
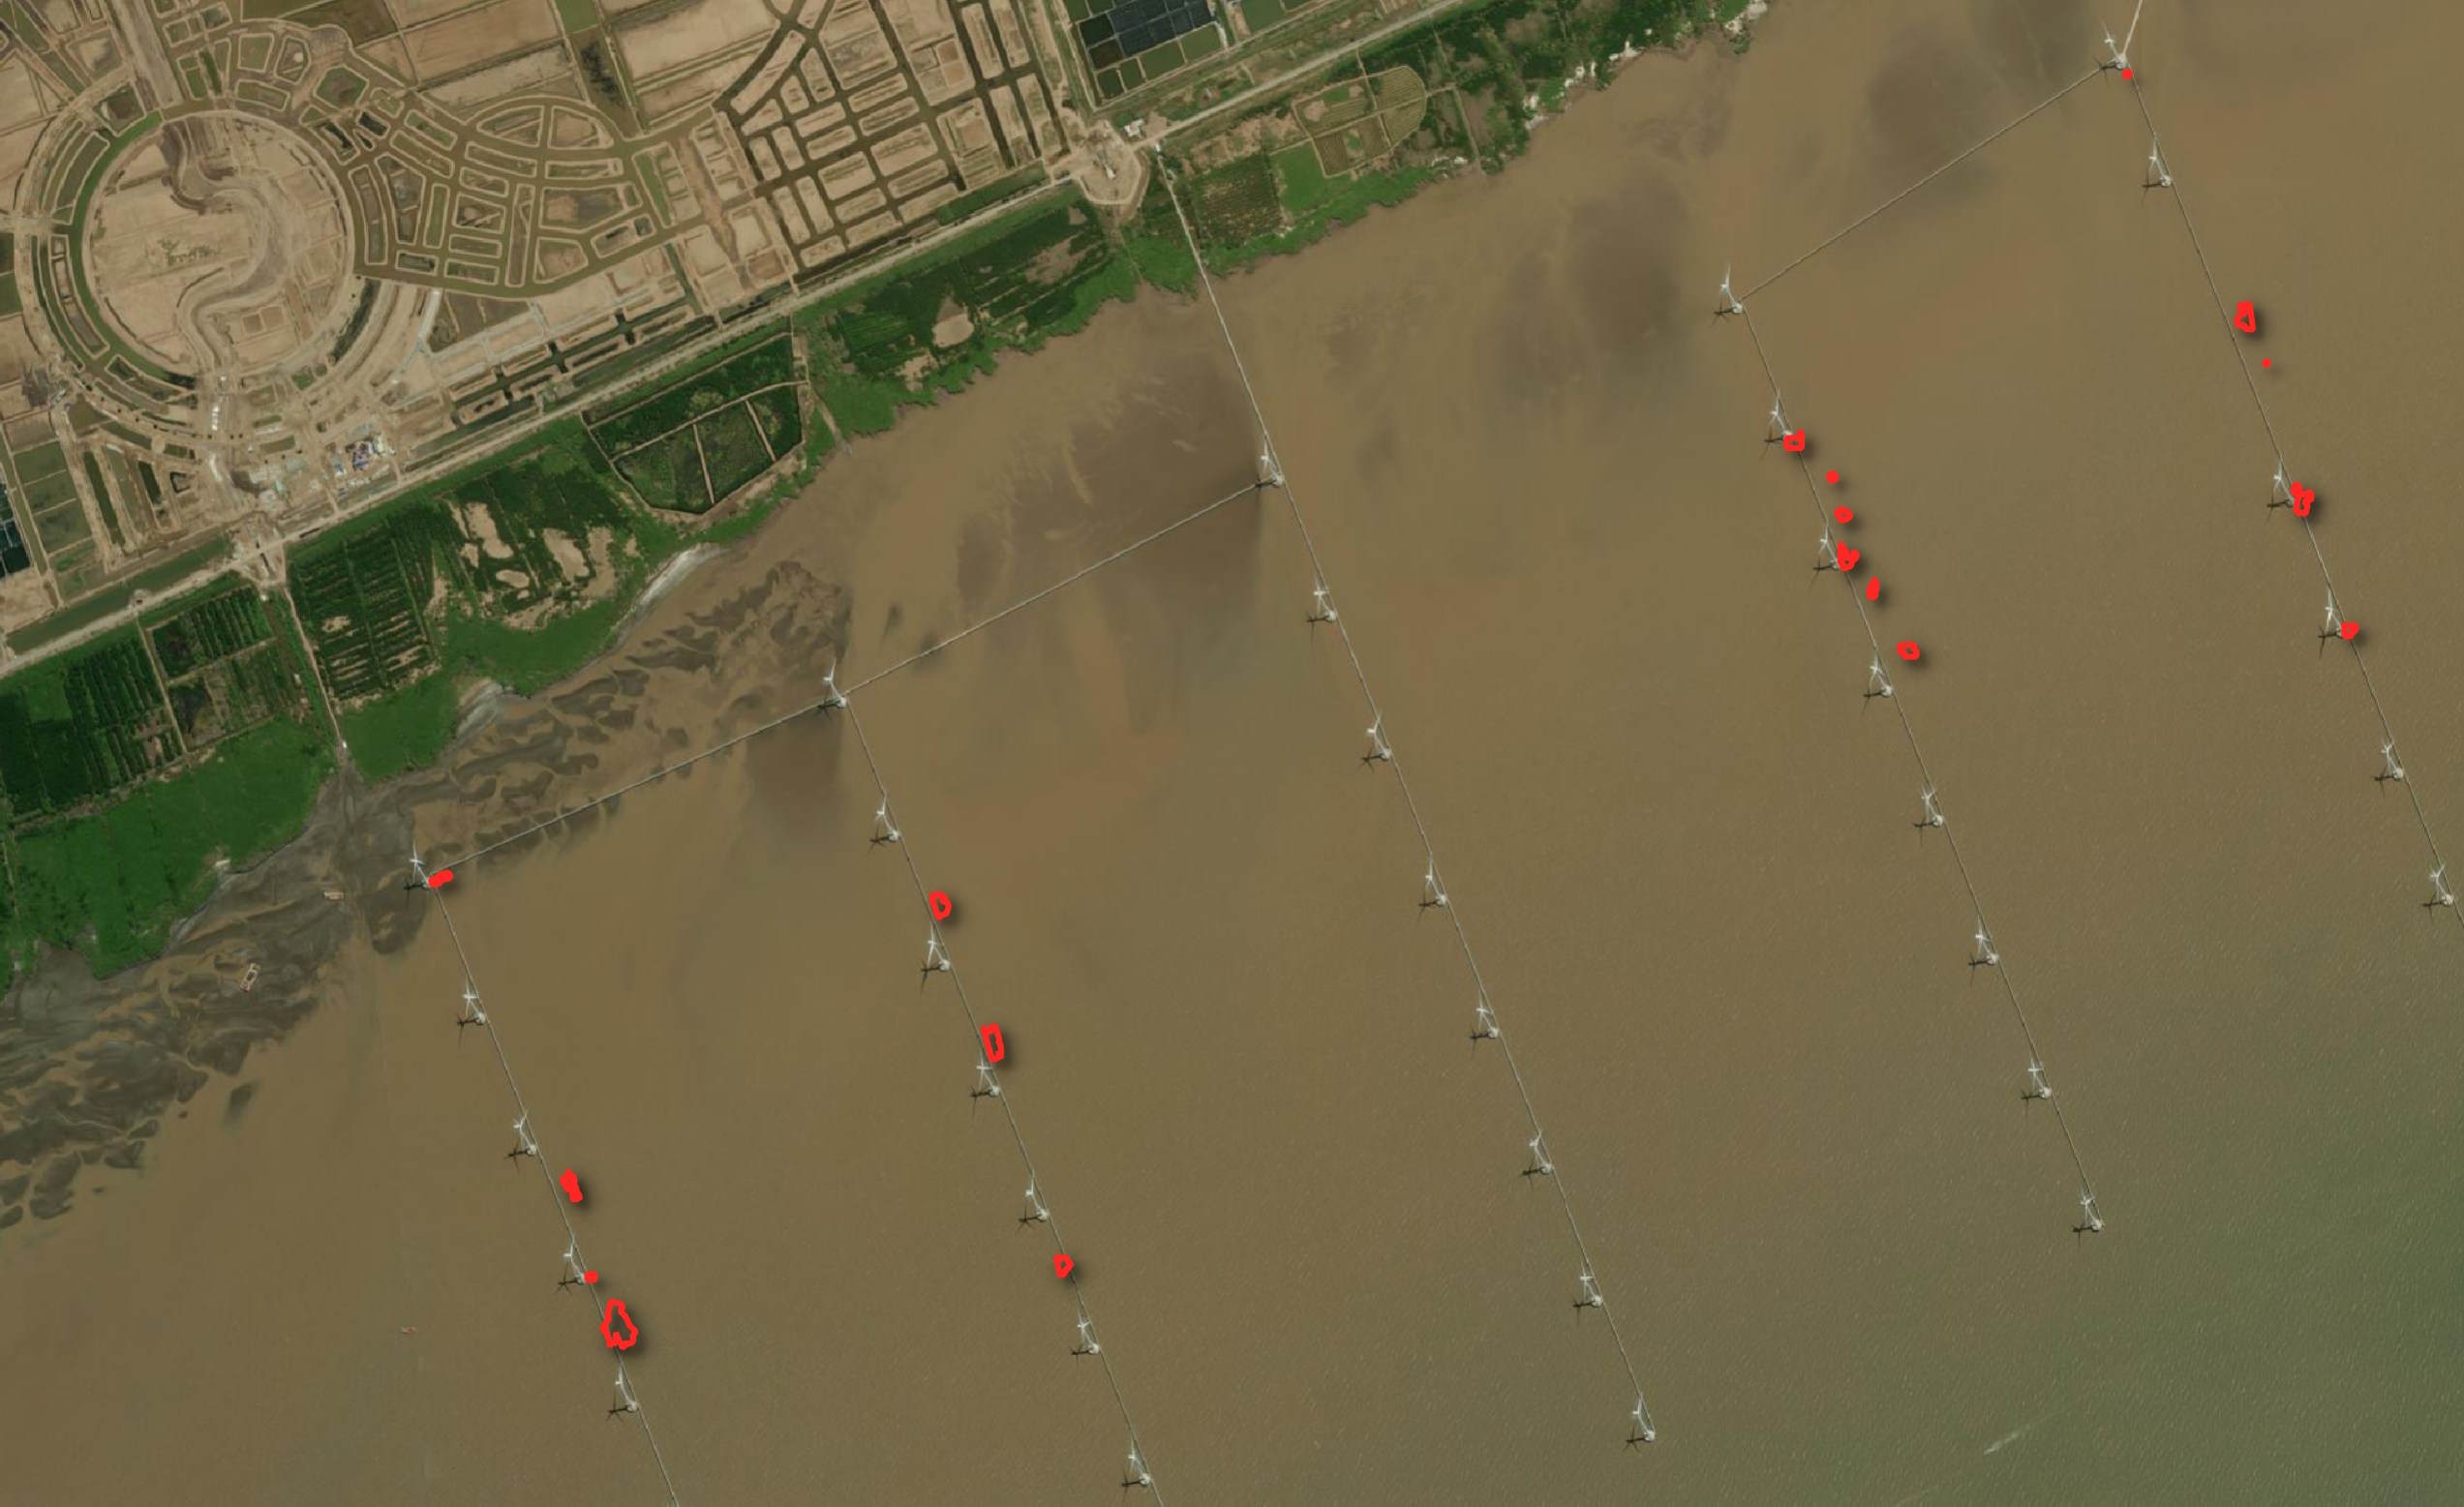
Some of the wind turbines in this off-shore Wind Farm in Vietnam were mistaken for buildings.
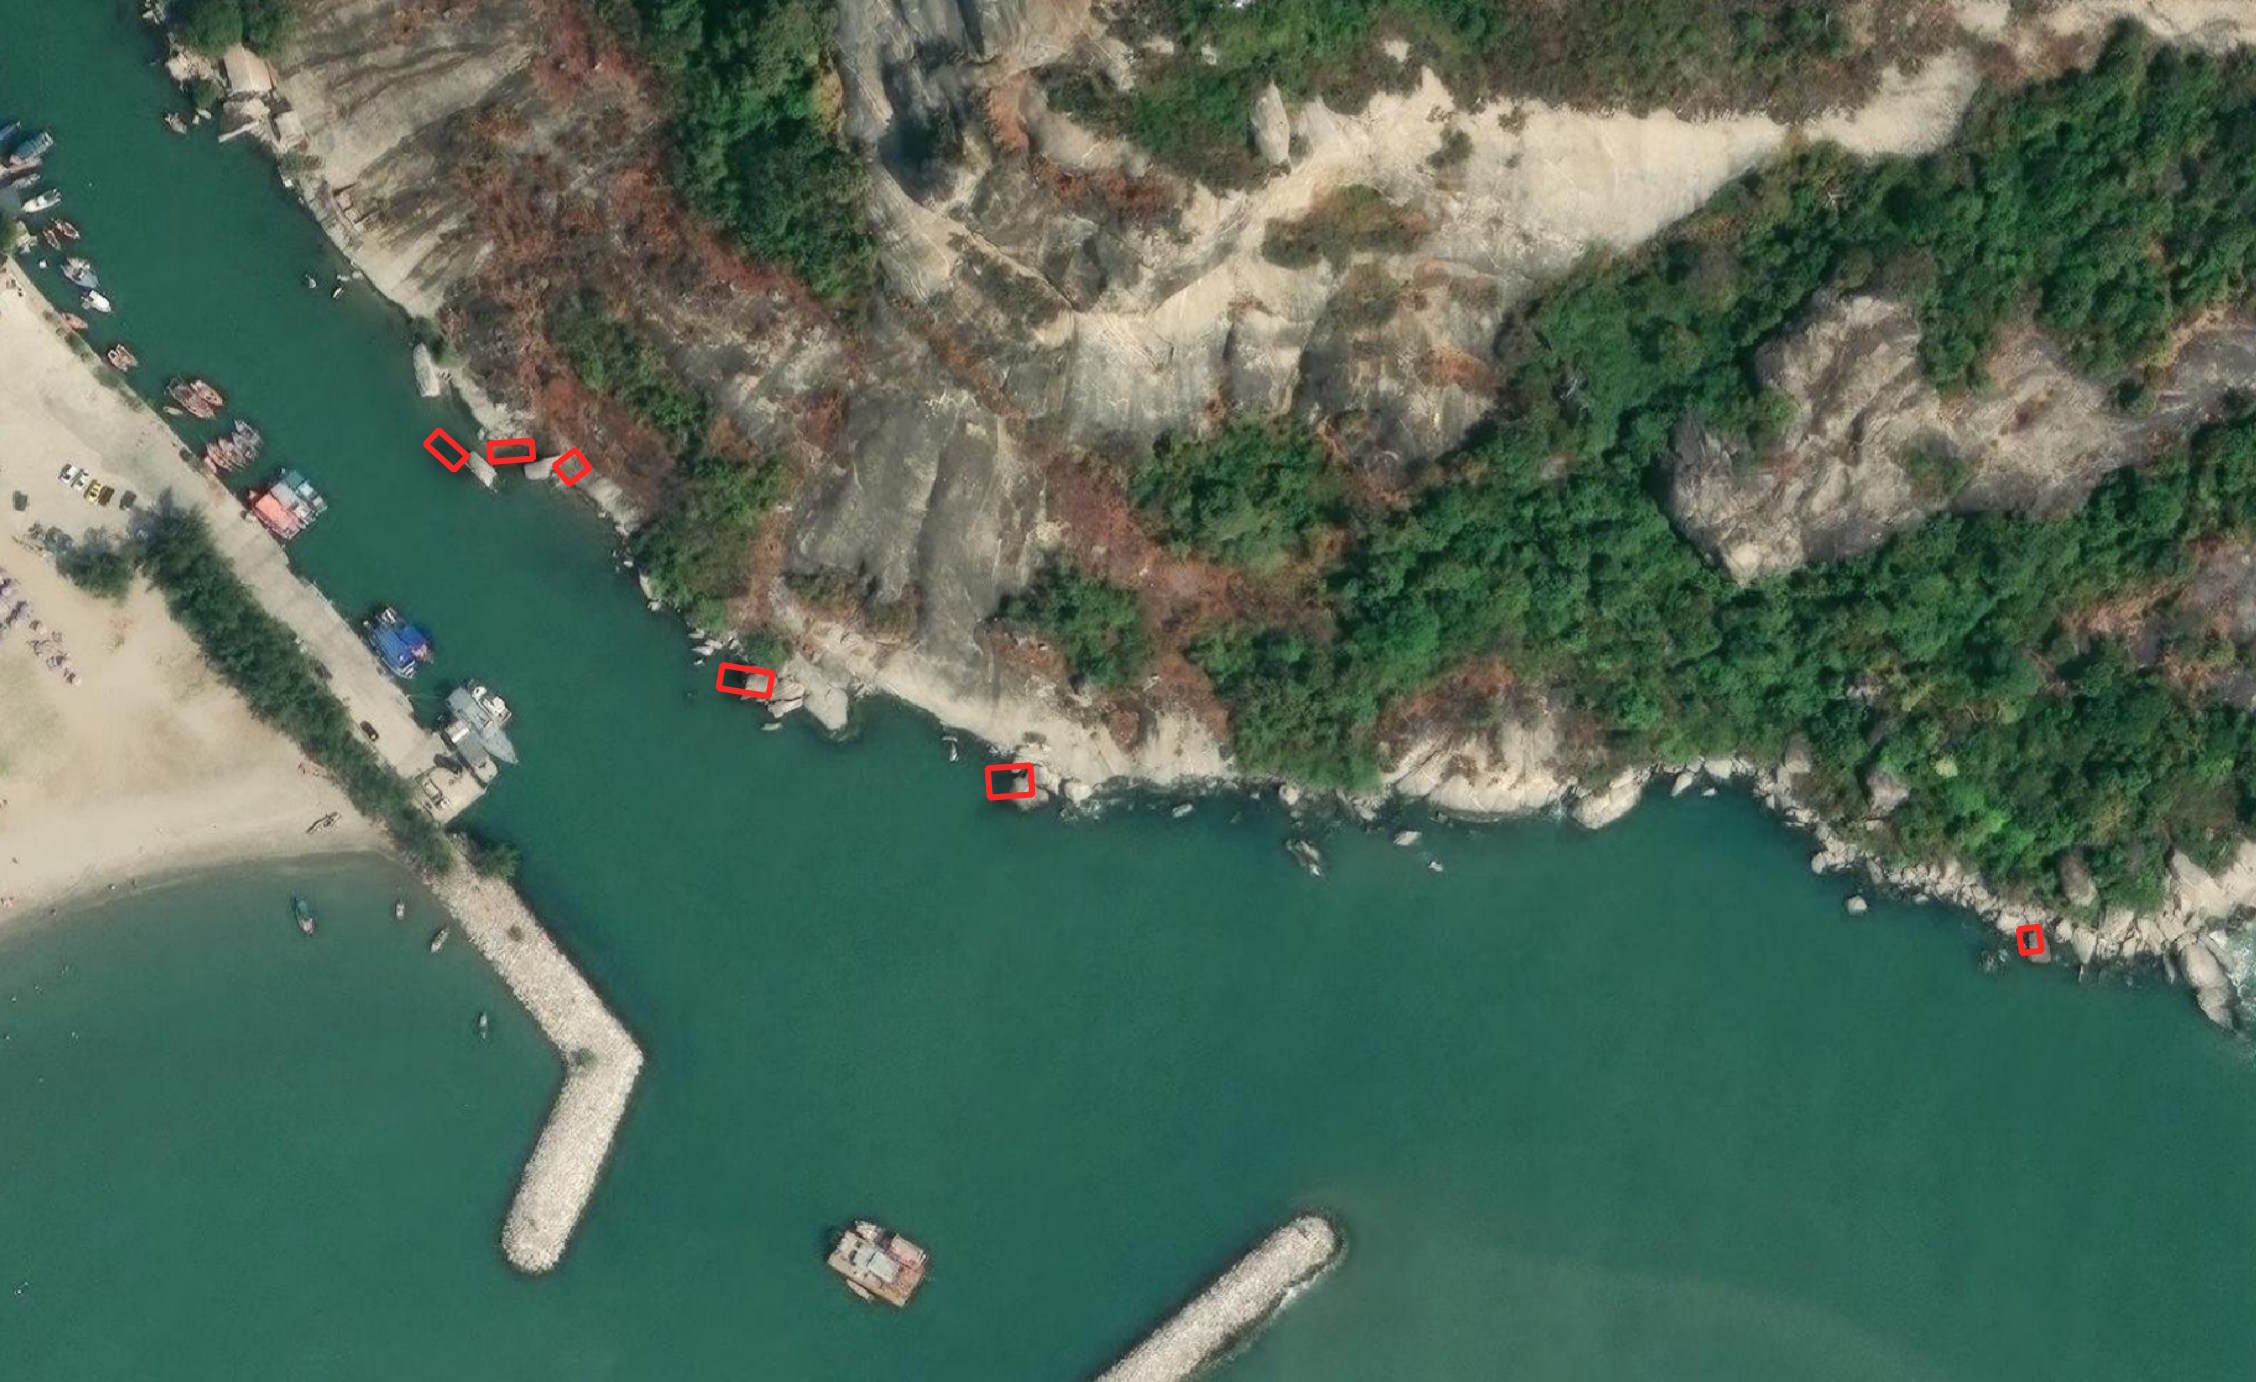
Some of the rocks along this shoreline in Thailand were mistaken for buildings.
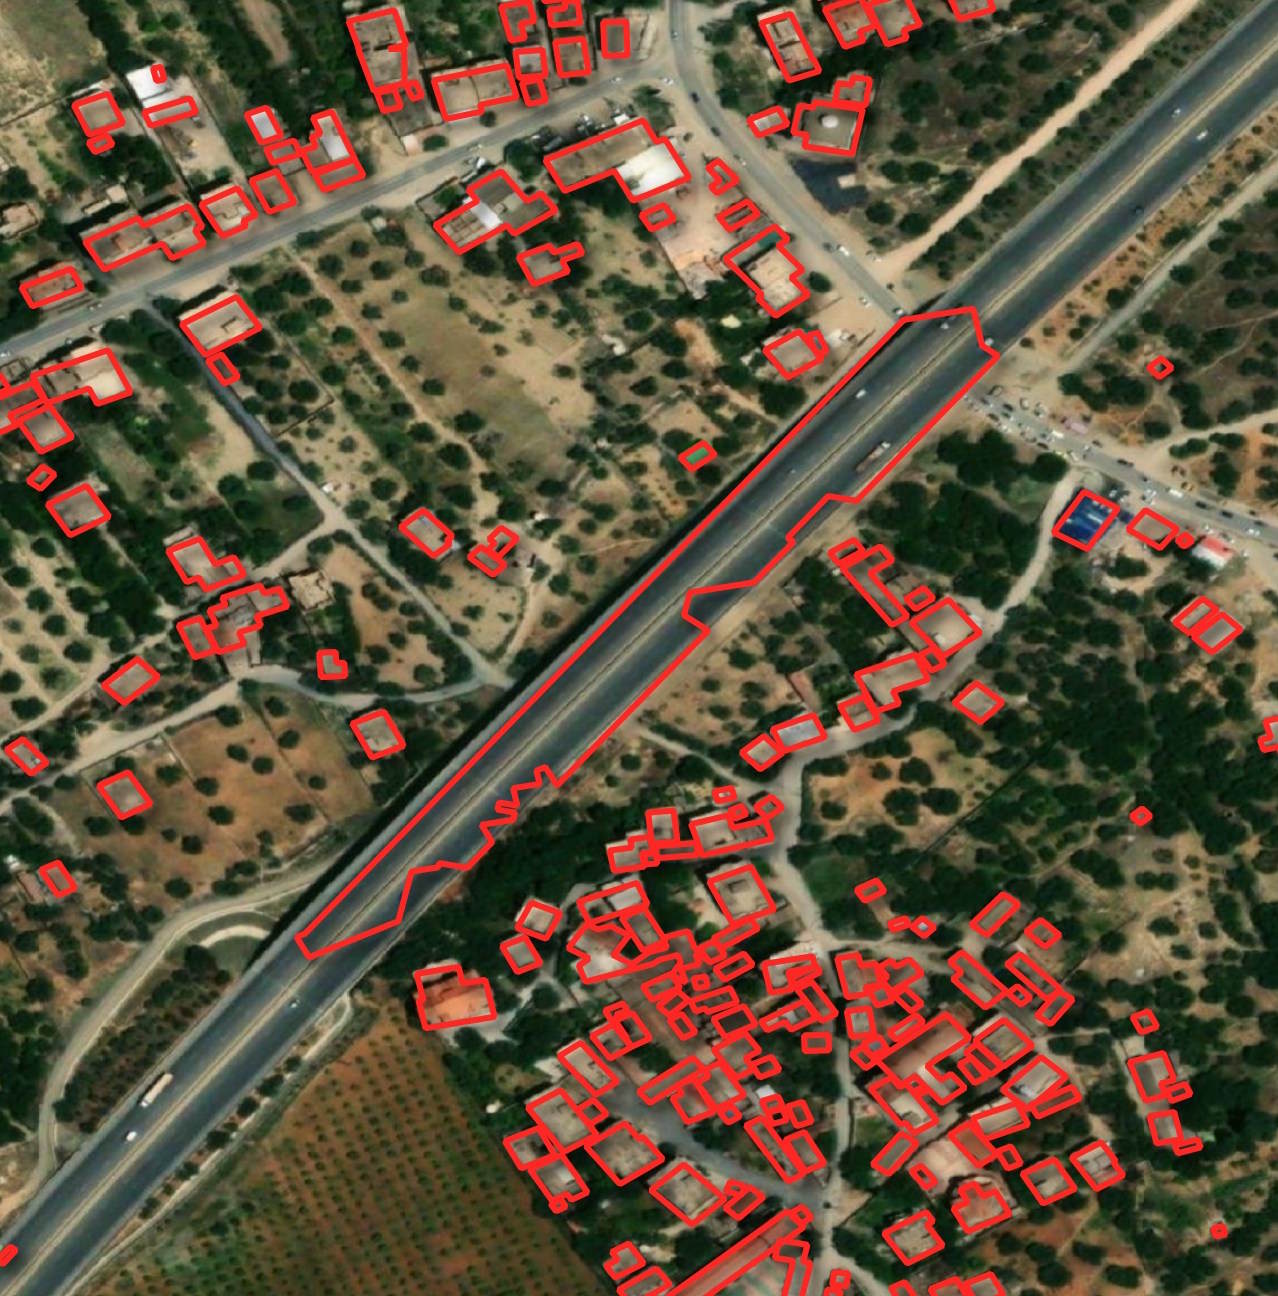
This highway in Algeria was mistaken for a building.
I suspect Microsoft have a shape regularisation algorithm they run their detections through in order to create more plausible building shapes. It appears to not support curved buildings, like this one in France, very well.