I recently came across a paper titled "Mapping 280 Million Buildings in East Asia Based on VHR Images". It was published in May and details an AI model that has extracted 281,093,433 building footprints from 2,897 cities across Eastern Asia.
The paper was written by eight authors affiliated with the University of Wisconsin, Guangdong Provincial Key Laboratory, Sun Yat-sen University and Wuhan University. 100 TB of 50cm, zoom-level 18 source imagery from Google Earth taken between 2020 and 2022 was used for this exercise. The paper states the average overall accuracy is 89.63% and has an F1 score of 82.55%. Eight pieces of prior art focused on deep learning approaches were studied prior to this model's development.
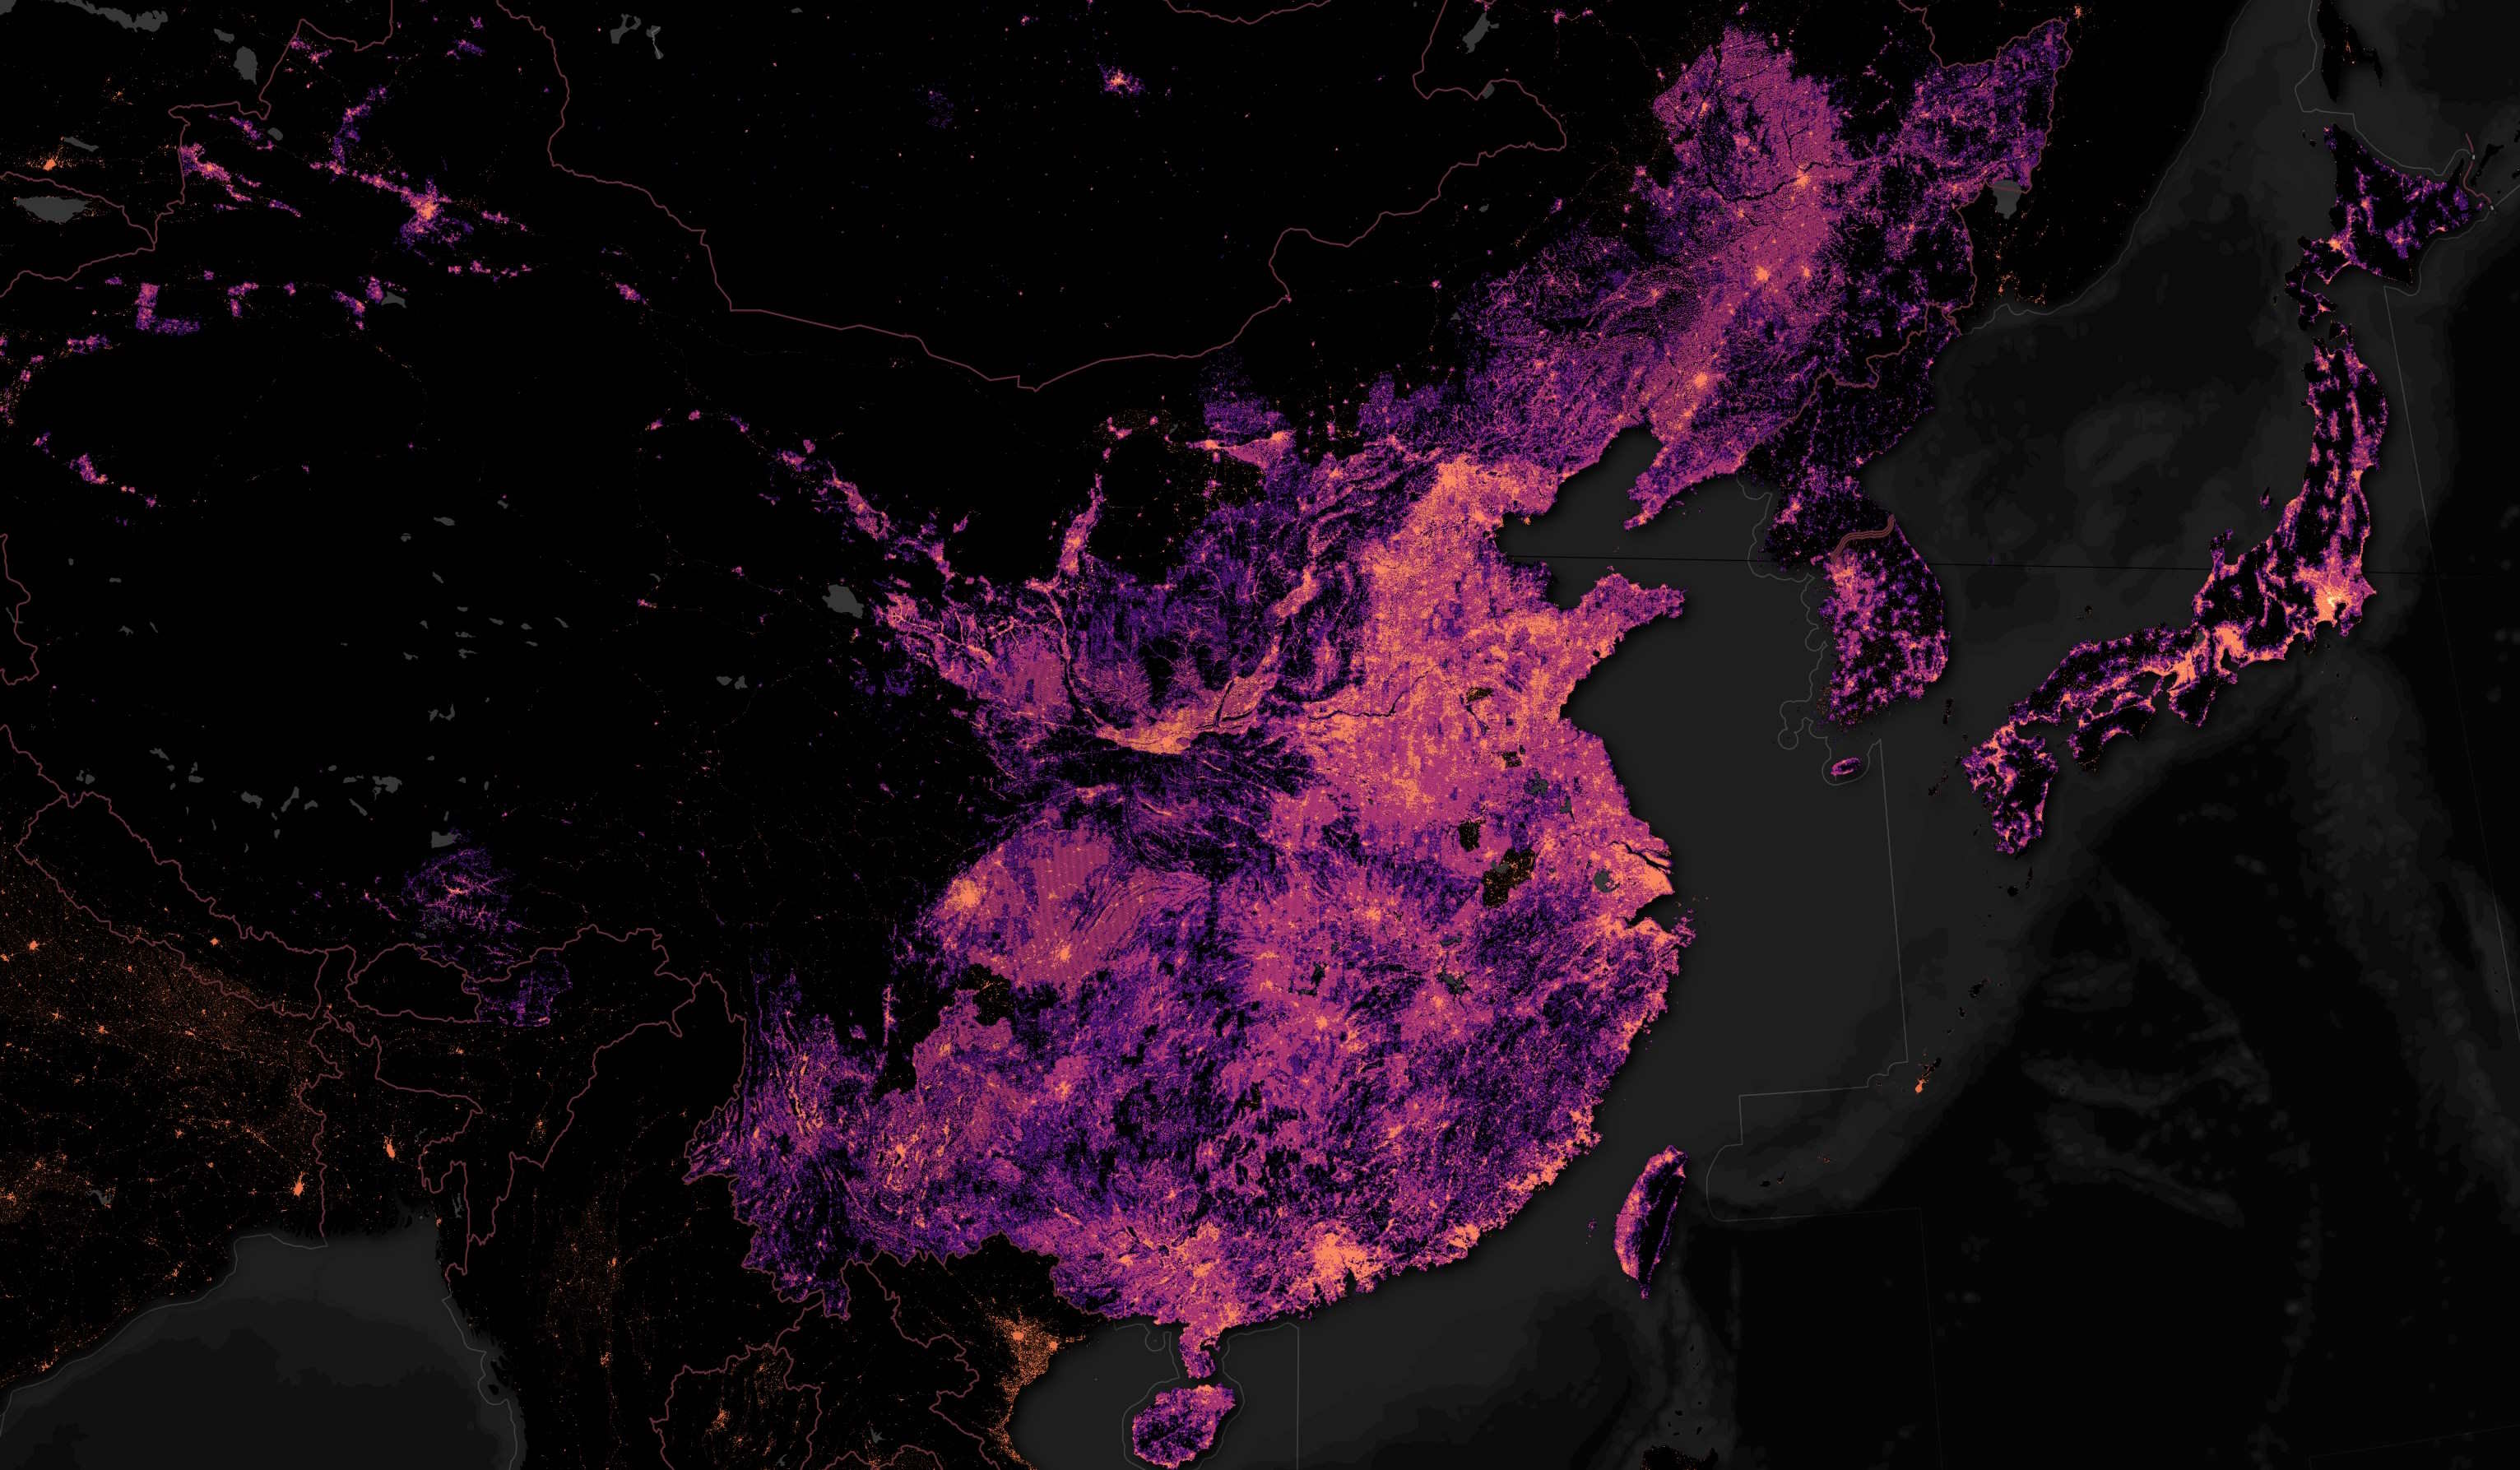
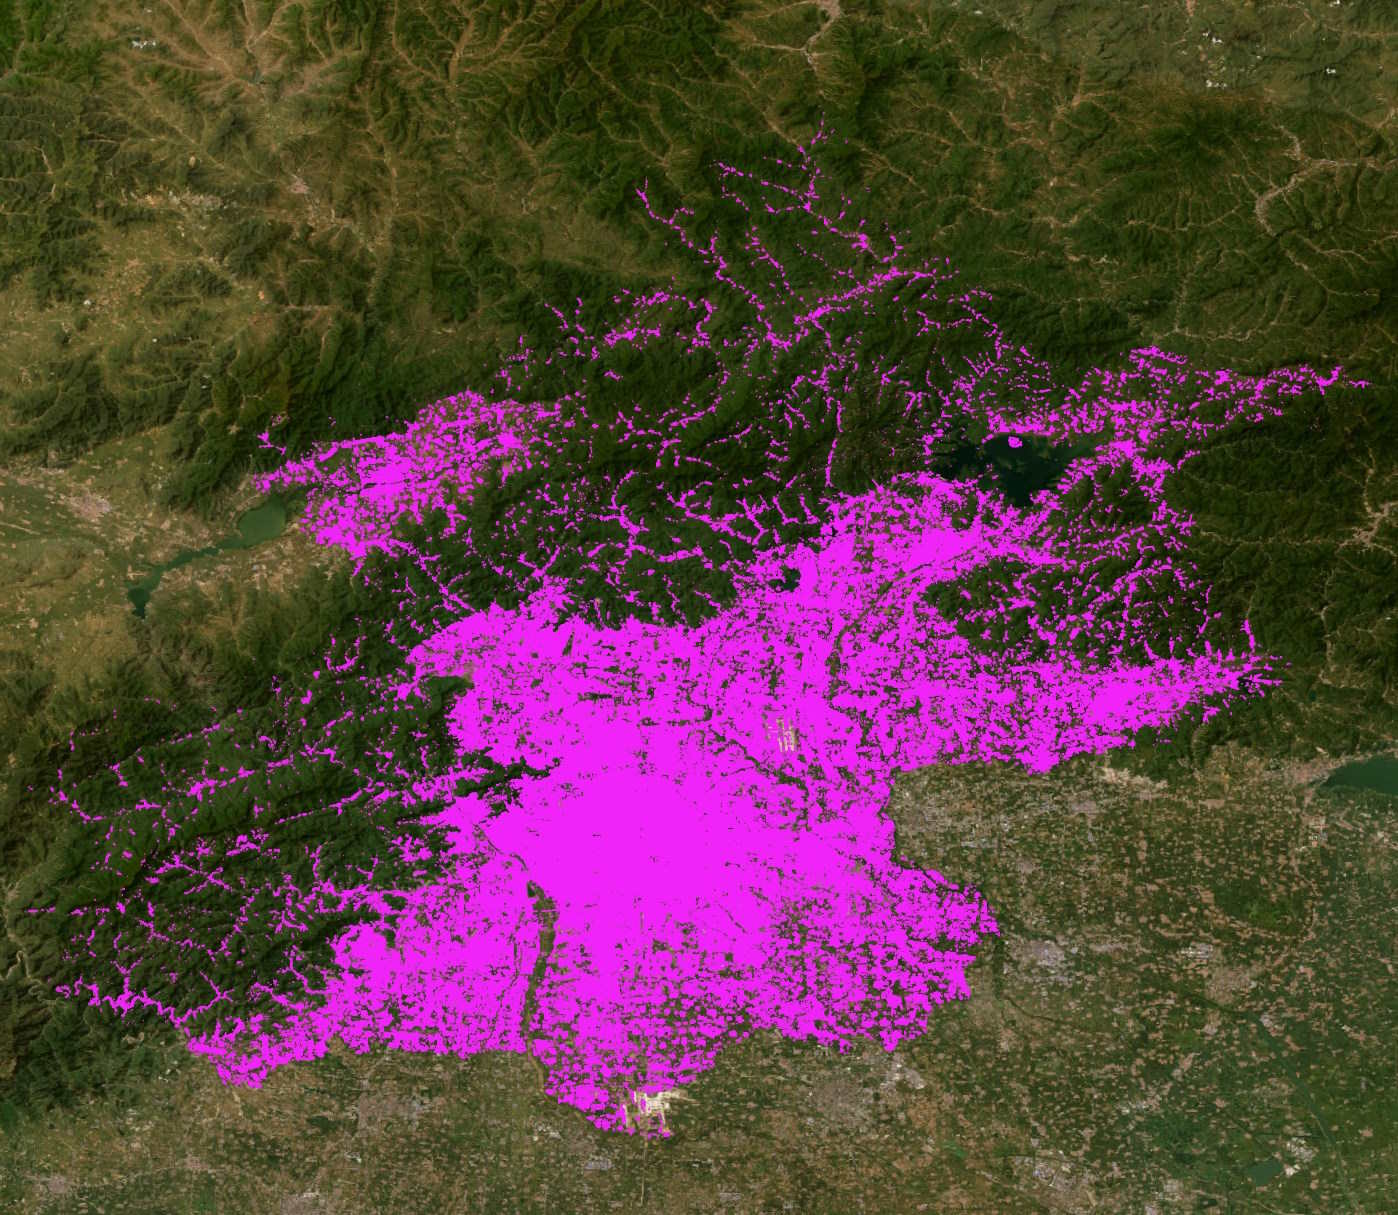
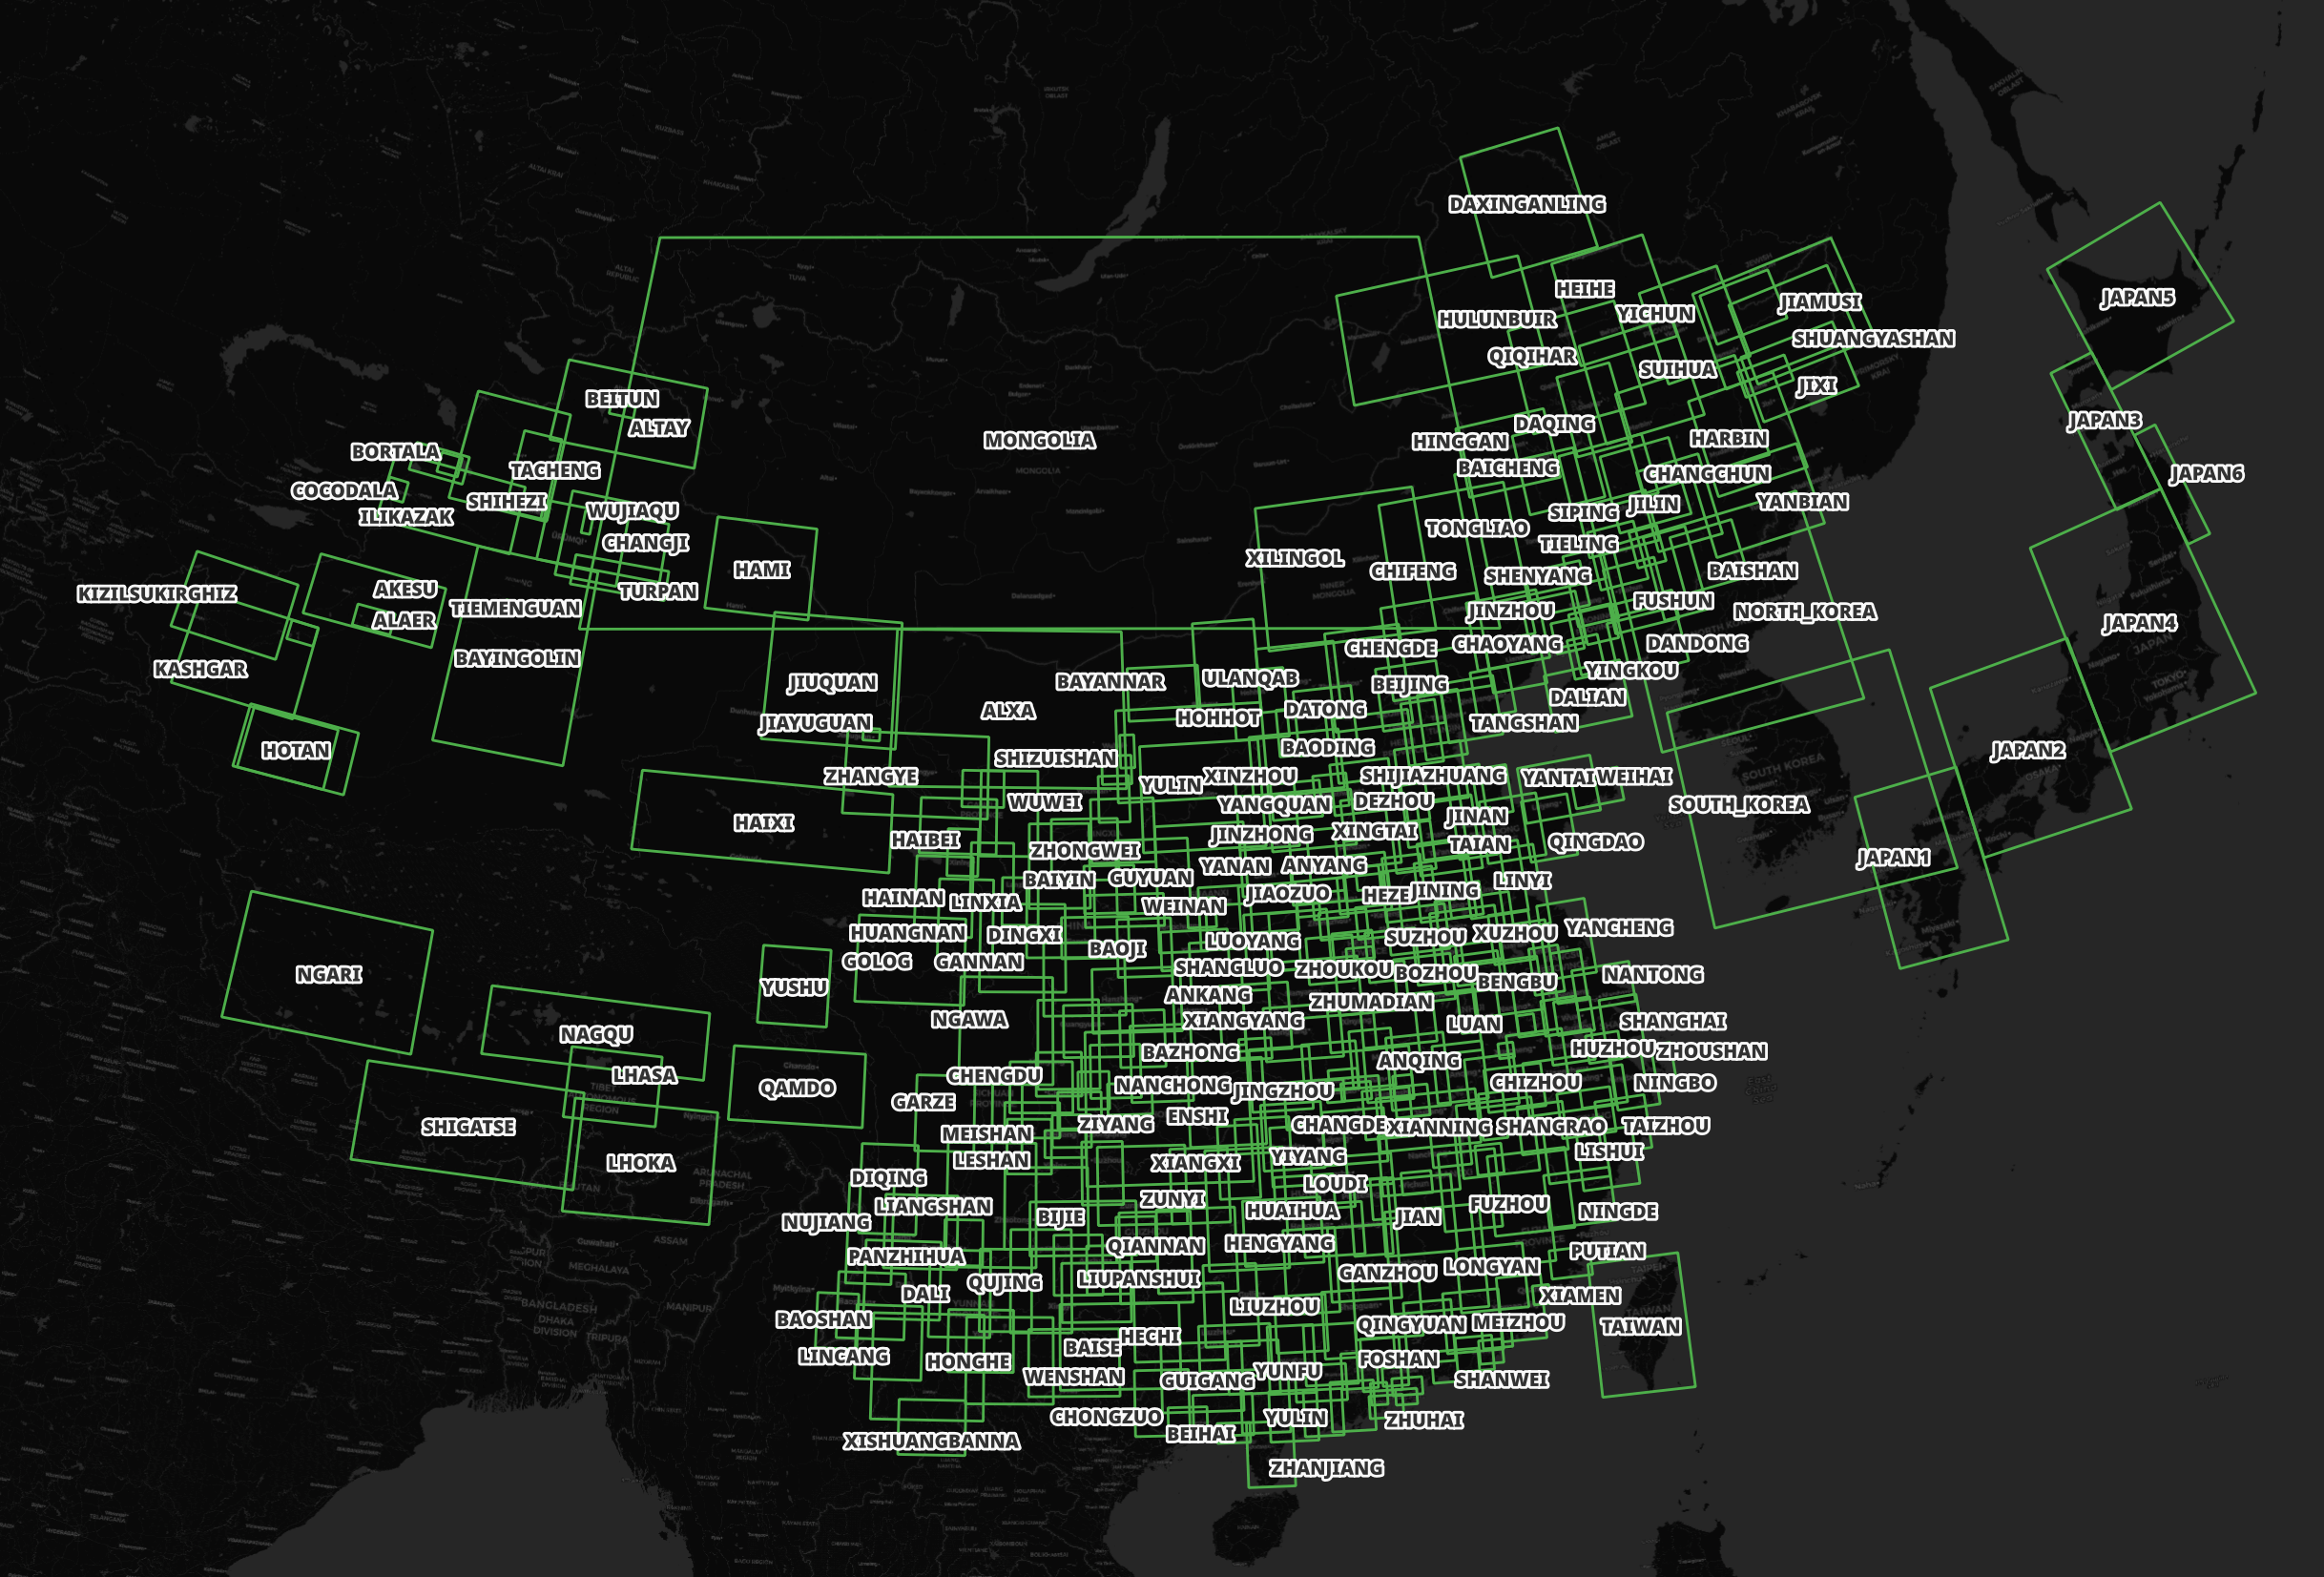
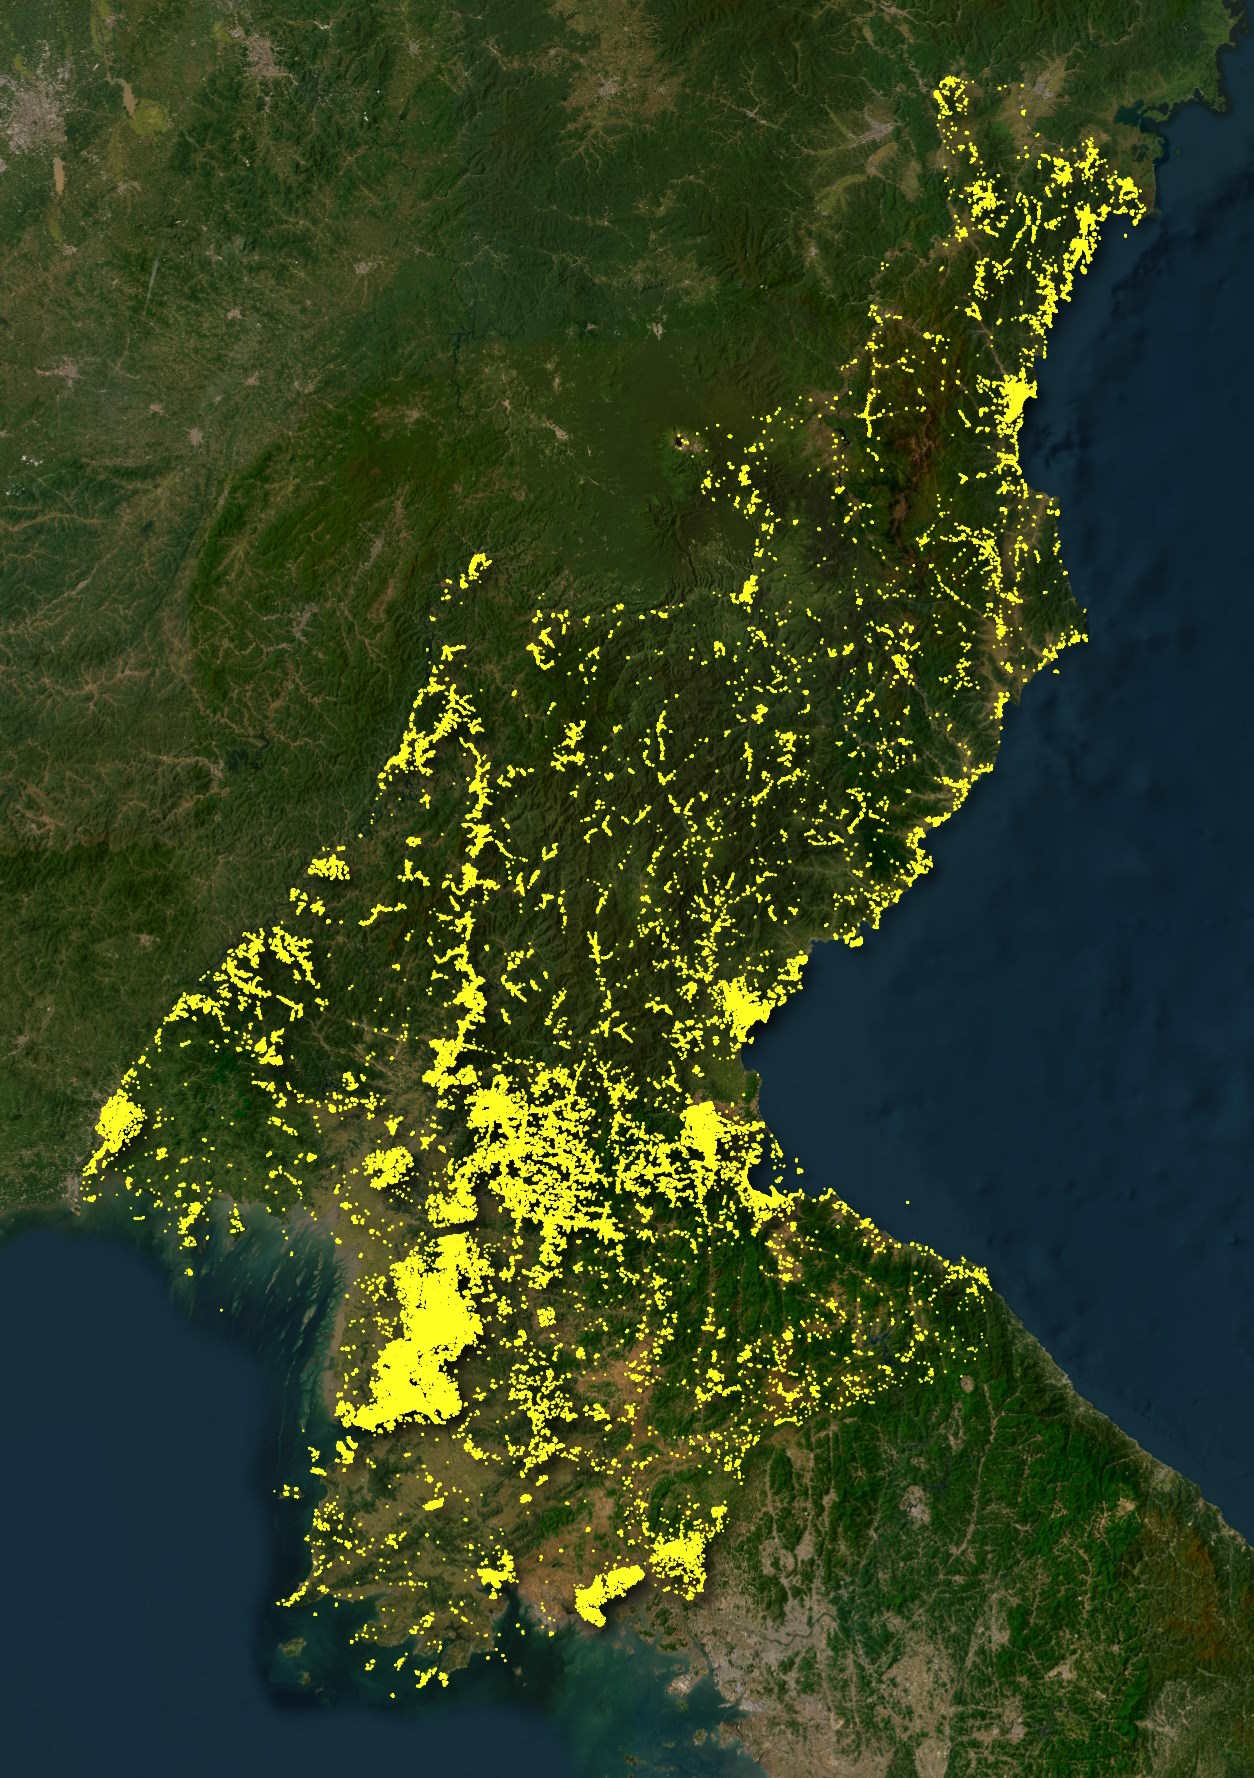
Below is a heatmap of the building footprints.
In this post, I'll examine the resulting comprehensive large-scale mapping framework's "CLSM" building footprint dataset.
The ETL scripts for this post will be available on GitHub and under an MIT License.
My Workstation
I'm using a 6 GHz Intel Core i9-14900K CPU. It has 8 performance cores and 16 efficiency cores with a total of 32 threads and 32 MB of L2 cache. It has a liquid cooler attached and is housed in a spacious, full-sized, Cooler Master HAF 700 computer case. I've come across videos on YouTube where people have managed to overclock the i9-14900KF to 9.1 GHz.
The system has 96 GB of DDR5 RAM clocked at 6,000 MT/s and a 5th-generation, Crucial T700 4 TB NVMe M.2 SSD which can read at speeds up to 12,400 MB/s. There is a heatsink on the SSD to help keep its temperature down. This is my system's C drive.
The system is powered by a 1,200-watt, fully modular, Corsair Power Supply and is sat on an ASRock Z790 Pro RS Motherboard.
I'm running Ubuntu 22 LTS via Microsoft's Ubuntu for Windows on Windows 11 Pro. In case you're wondering why I don't run a Linux-based desktop as my primary work environment, I'm still using an Nvidia GTX 1080 GPU which has better driver support on Windows and I use ArcGIS Pro from time to time which only supports Windows natively.
Installing Prerequisites
I'll be using Python and a few other tools to help analyse the imagery in this post.
$ sudo apt update
$ sudo apt install \
    python3-pip \
    python3-virtualenv
I'll set up a Python Virtual Environment and install a few packages.
$ virtualenv ~/.clsm
$ source ~/.clsm/bin/activate
$ python3 -m pip install \
    duckdb \
    pyproj \
    shapely
I'll also use DuckDB, along with its H3, JSON, Parquet and Spatial extensions, in this post.
$ cd ~
$ wget -c https://github.com/duckdb/duckdb/releases/download/v1.0.0/duckdb_cli-linux-amd64.zip
$ unzip -j duckdb_cli-linux-amd64.zip
$ chmod +x duckdb
$ ~/duckdb
INSTALL h3 FROM community;
INSTALL json;
INSTALL parquet;
INSTALL spatial;
I'll set up DuckDB to load all these extensions each time it launches.
$ vi ~/.duckdbrc
.timer on
.width 180
LOAD h3;
LOAD json;
LOAD parquet;
LOAD spatial;
The maps in this post were rendered with QGIS version 3.38. QGIS is a desktop application that runs on Windows, macOS and Linux.
I used QGIS' Tile+ plugin to add CARTO's and Esri's basemaps for context in the screenshots in this post.
Downloading the CLSM Dataset
The dataset is made available as a 21 GB ZIP file which totals 81 GB and 2,878 files when decompressed.
$ unzip -l East_Asian_buildings.zip | head -n20
Archive:  East_Asian_buildings.zip
  Length      Date    Time    Name
---------  ---------- -----   ----
        0  2023-07-23 00:53   China/
        0  2023-07-22 20:45   China/Anhui/
        5  2023-05-10 00:49   China/Anhui/Anqing.cpg
 25507164  2023-05-10 00:49   China/Anhui/Anqing.dbf
      402  2023-05-10 00:46   China/Anhui/Anqing.prj
  5353740  2023-05-10 00:50   China/Anhui/Anqing.sbn
   122116  2023-05-10 00:50   China/Anhui/Anqing.sbx
 93194592  2023-05-10 00:49   China/Anhui/Anqing.shp
     7952  2023-05-10 00:50   China/Anhui/Anqing.shp.xml
  4977076  2023-05-10 00:49   China/Anhui/Anqing.shx
        5  2023-05-10 00:52   China/Anhui/Bengbu.cpg
 24003812  2023-05-10 00:52   China/Anhui/Bengbu.dbf
      402  2023-05-10 00:50   China/Anhui/Bengbu.prj
  4443644  2023-05-10 00:53   China/Anhui/Bengbu.sbn
    99516  2023-05-10 00:53   China/Anhui/Bengbu.sbx
 73688600  2023-05-10 00:52   China/Anhui/Bengbu.shp
     7622  2023-05-10 00:53   China/Anhui/Bengbu.shp.xml
Within the ZIP file, there are one to three levels of folder nesting for one or more areas covered in this study. The folder sizes range from a few MB for Macau to 5.6 GB for Shandong and are made up of Shapefiles.
Japan has been broken up into six regions numbered 1 to 6.
South Korea, North Korea and Mongolia each have their own top-level folder and a few hundred MB each. Below are the Shapefiles for South Korea.
$ ls -lhS South\ Korea/
556M .. South_Korea_build_final.shp
 40M .. South_Korea_build_final.dbf
 30M .. South_Korea_build_final.sbn
 29M .. South_Korea_build_final.shx
325K .. South_Korea_build_final.sbx
7.0K .. South_Korea_build_final.shp.xml
 145 .. South_Korea_build_final.prj
   5 .. South_Korea_build_final.cpg
The State of Open Data
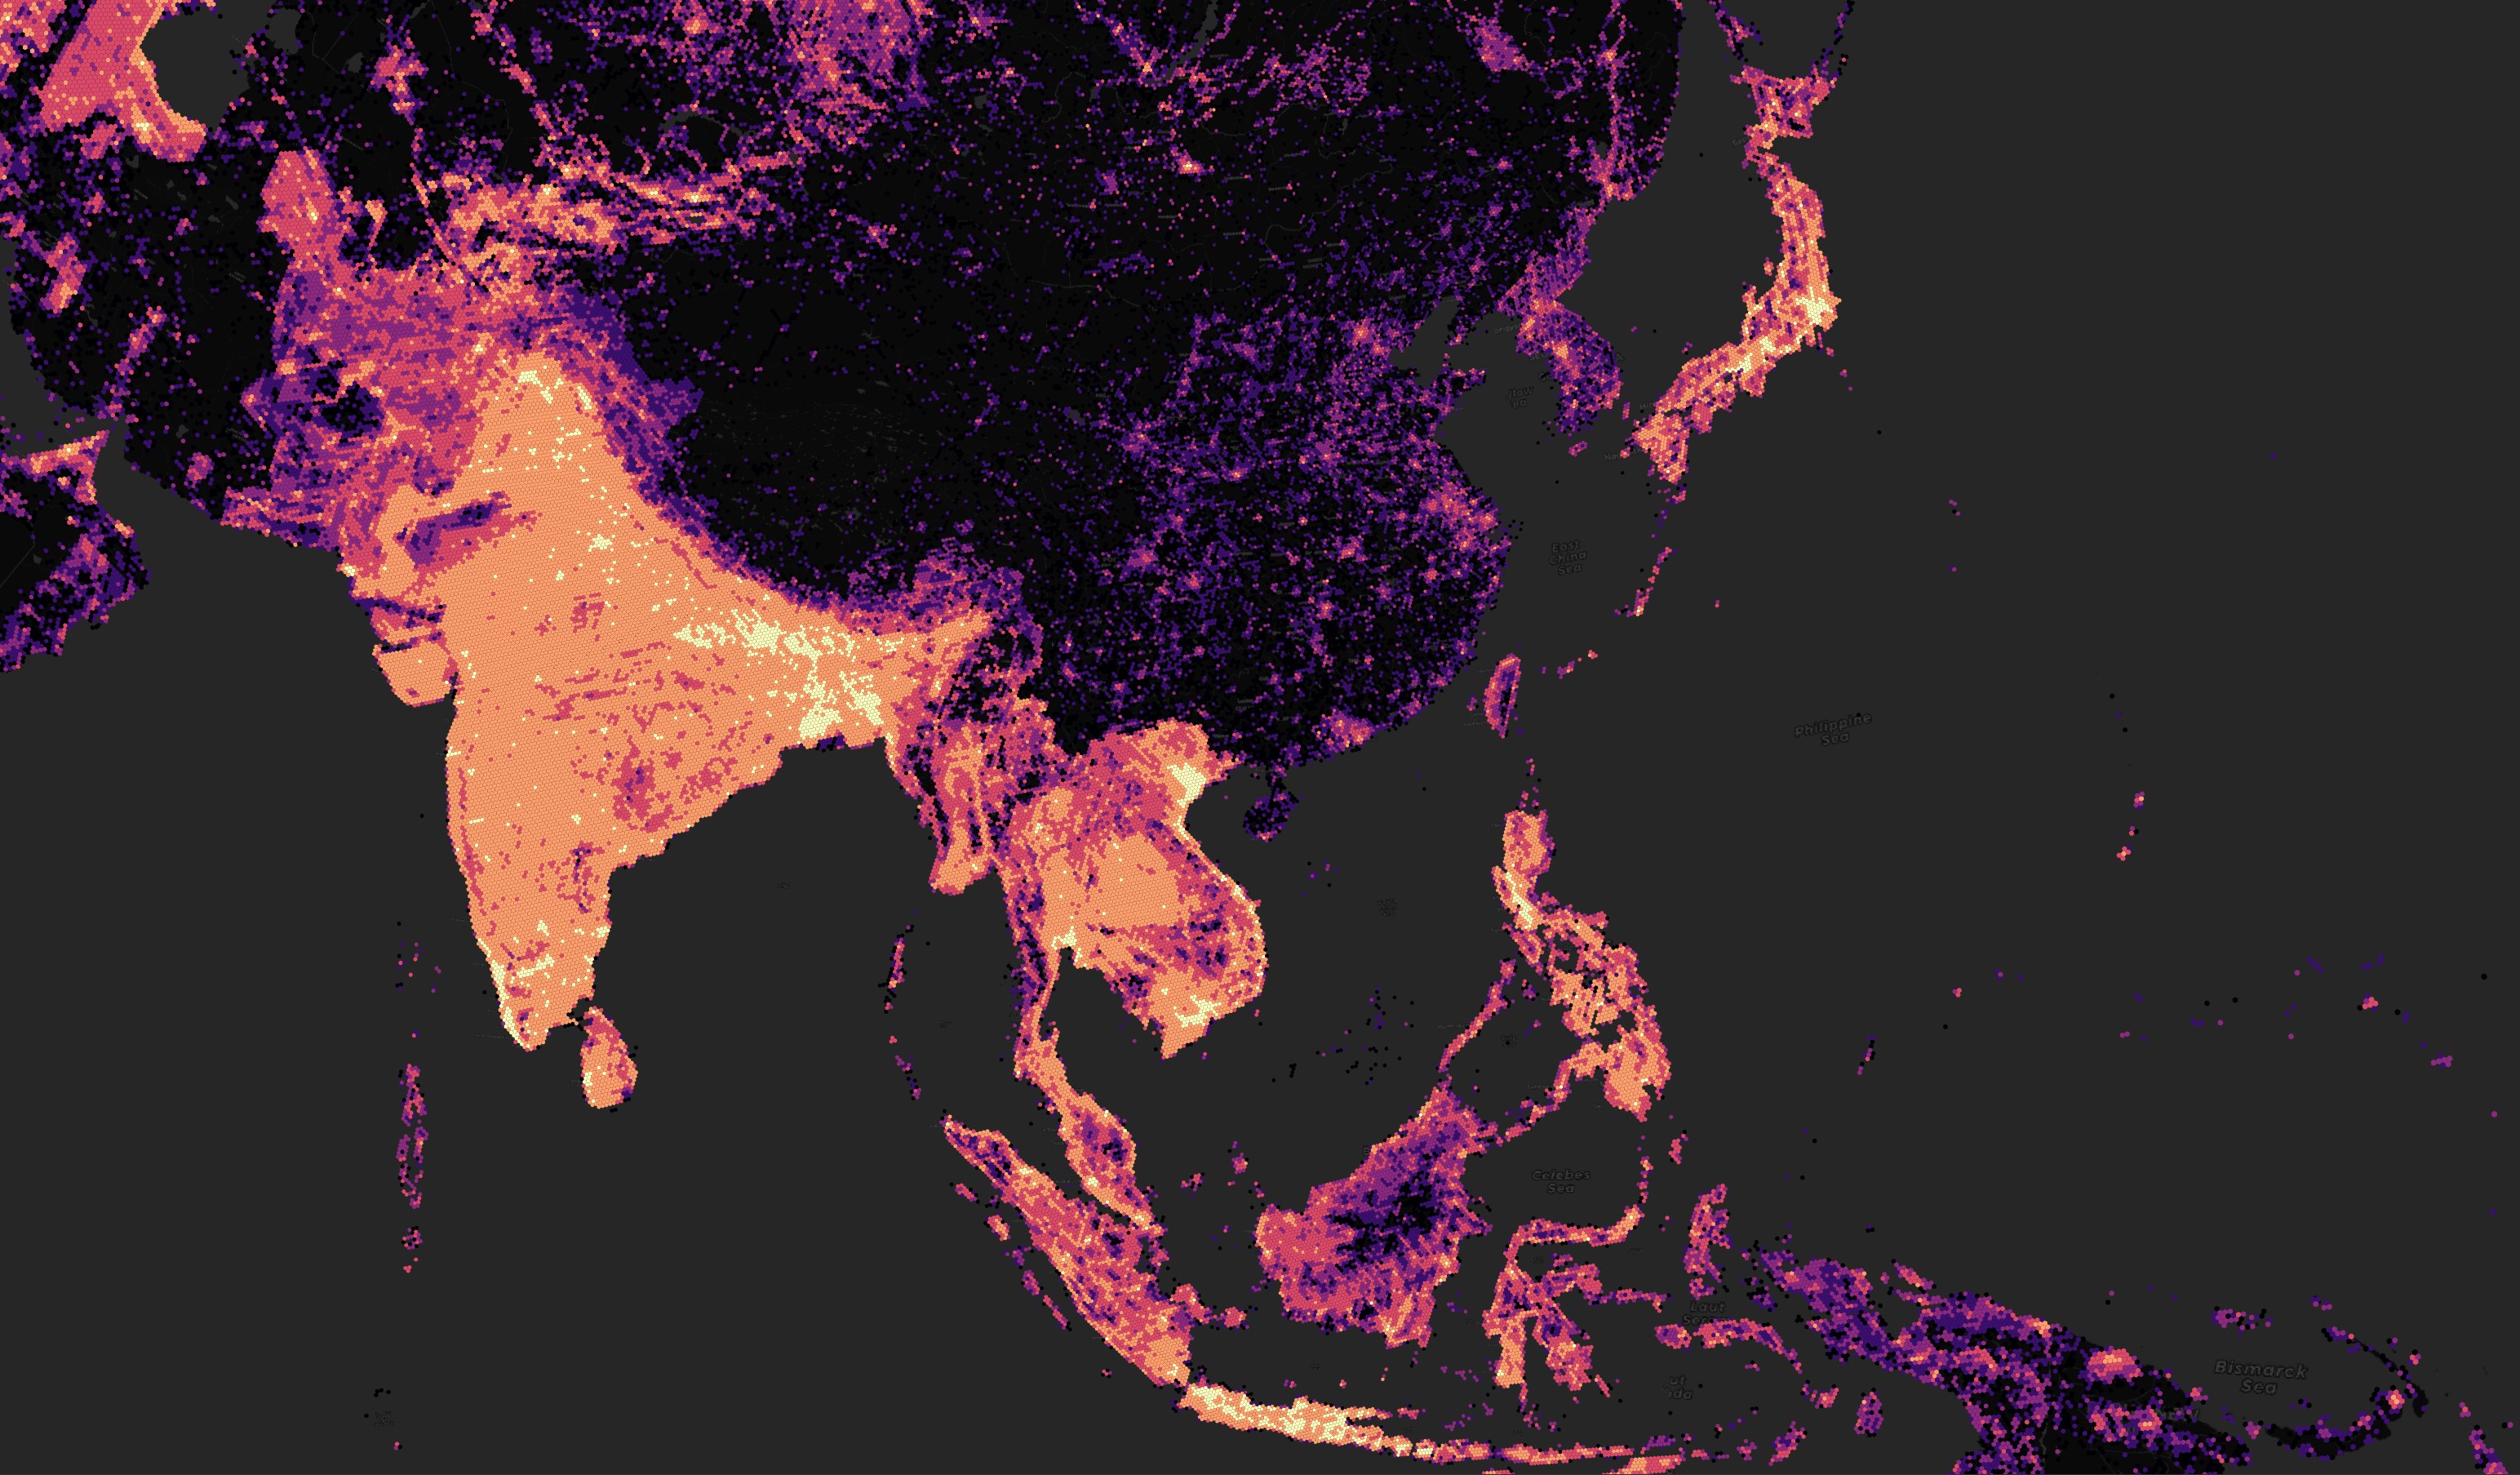
Overture's Global Geospatial Dataset is a 400 GB, Parquet-formatted, spatially-sorted, S3-hosted dataset that is refreshed monthly. For many parts of the world, it has incredible building footprint coverage. Unfortunately, between Vietnam and Japan, this coverage isn't nearly as comprehensive.
Below is a heatmap for the number of buildings in any given area across Asia. China and India have similar population counts so it should be assumed building counts would be within range of one another.
$ ~/duckdb
COPY (
    WITH a AS (
        SELECT h3_cell_to_parent(h3_string_to_h3(SUBSTR(id, 0, 17)), 5) h3_val,
               COUNT(*) num_recs
        FROM read_parquet('s3://overturemaps-us-west-2/release/2024-06-13-beta.0/theme=buildings/type=building/*.parquet',
                          hive_partitioning=1)
        GROUP BY 1
    )
    SELECT h3_cell_to_boundary_wkt(h3_val)::geometry geom,
           num_recs
    FROM a
    WHERE h3_cell_to_lng(h3_val) > -175
    AND   h3_cell_to_lng(h3_val) < 175
) TO 'buildings_h6.2024-06-13.gpkg'
    WITH (FORMAT GDAL,
          DRIVER 'GPKG',
          LAYER_CREATION_OPTIONS 'WRITE_BBOX=YES');
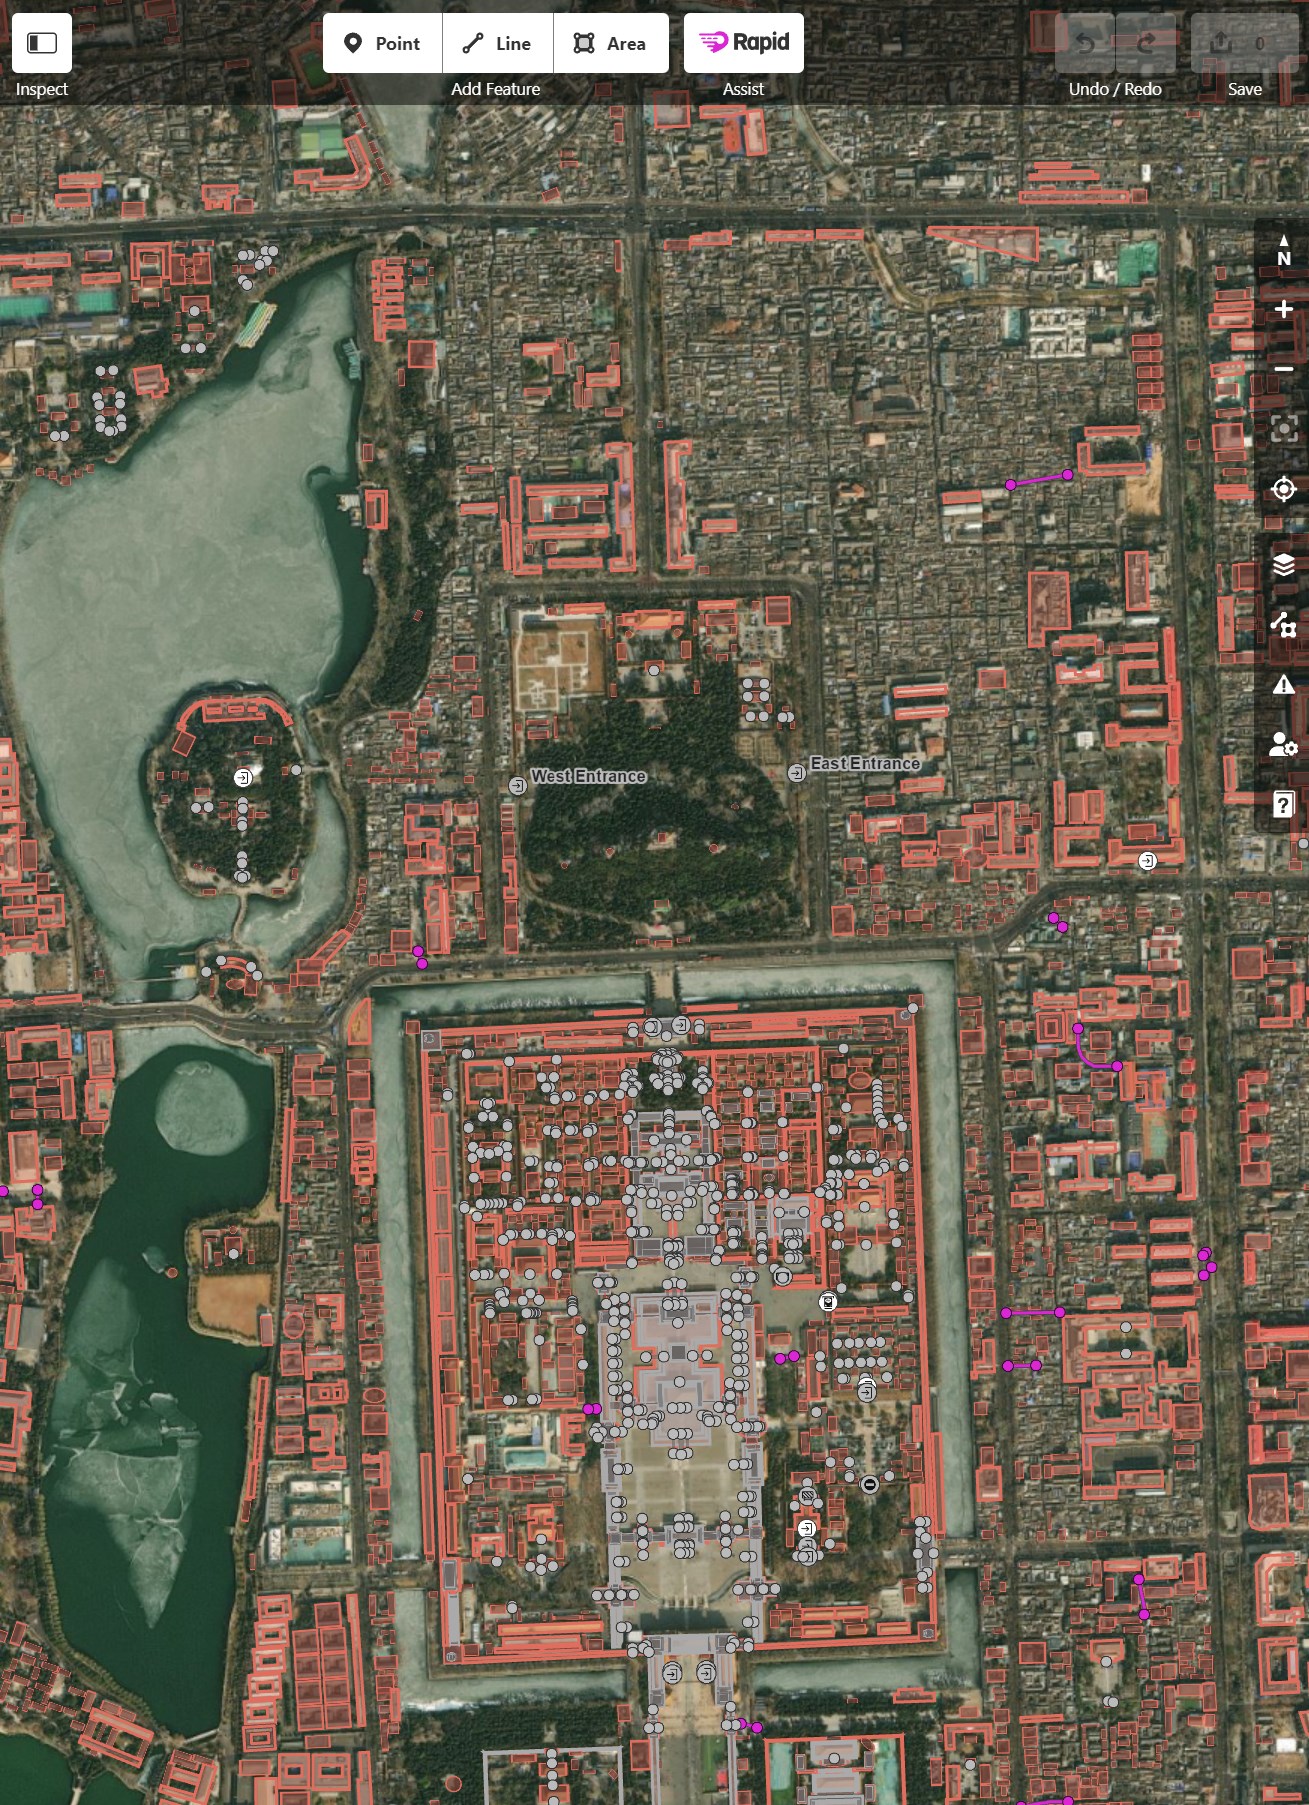
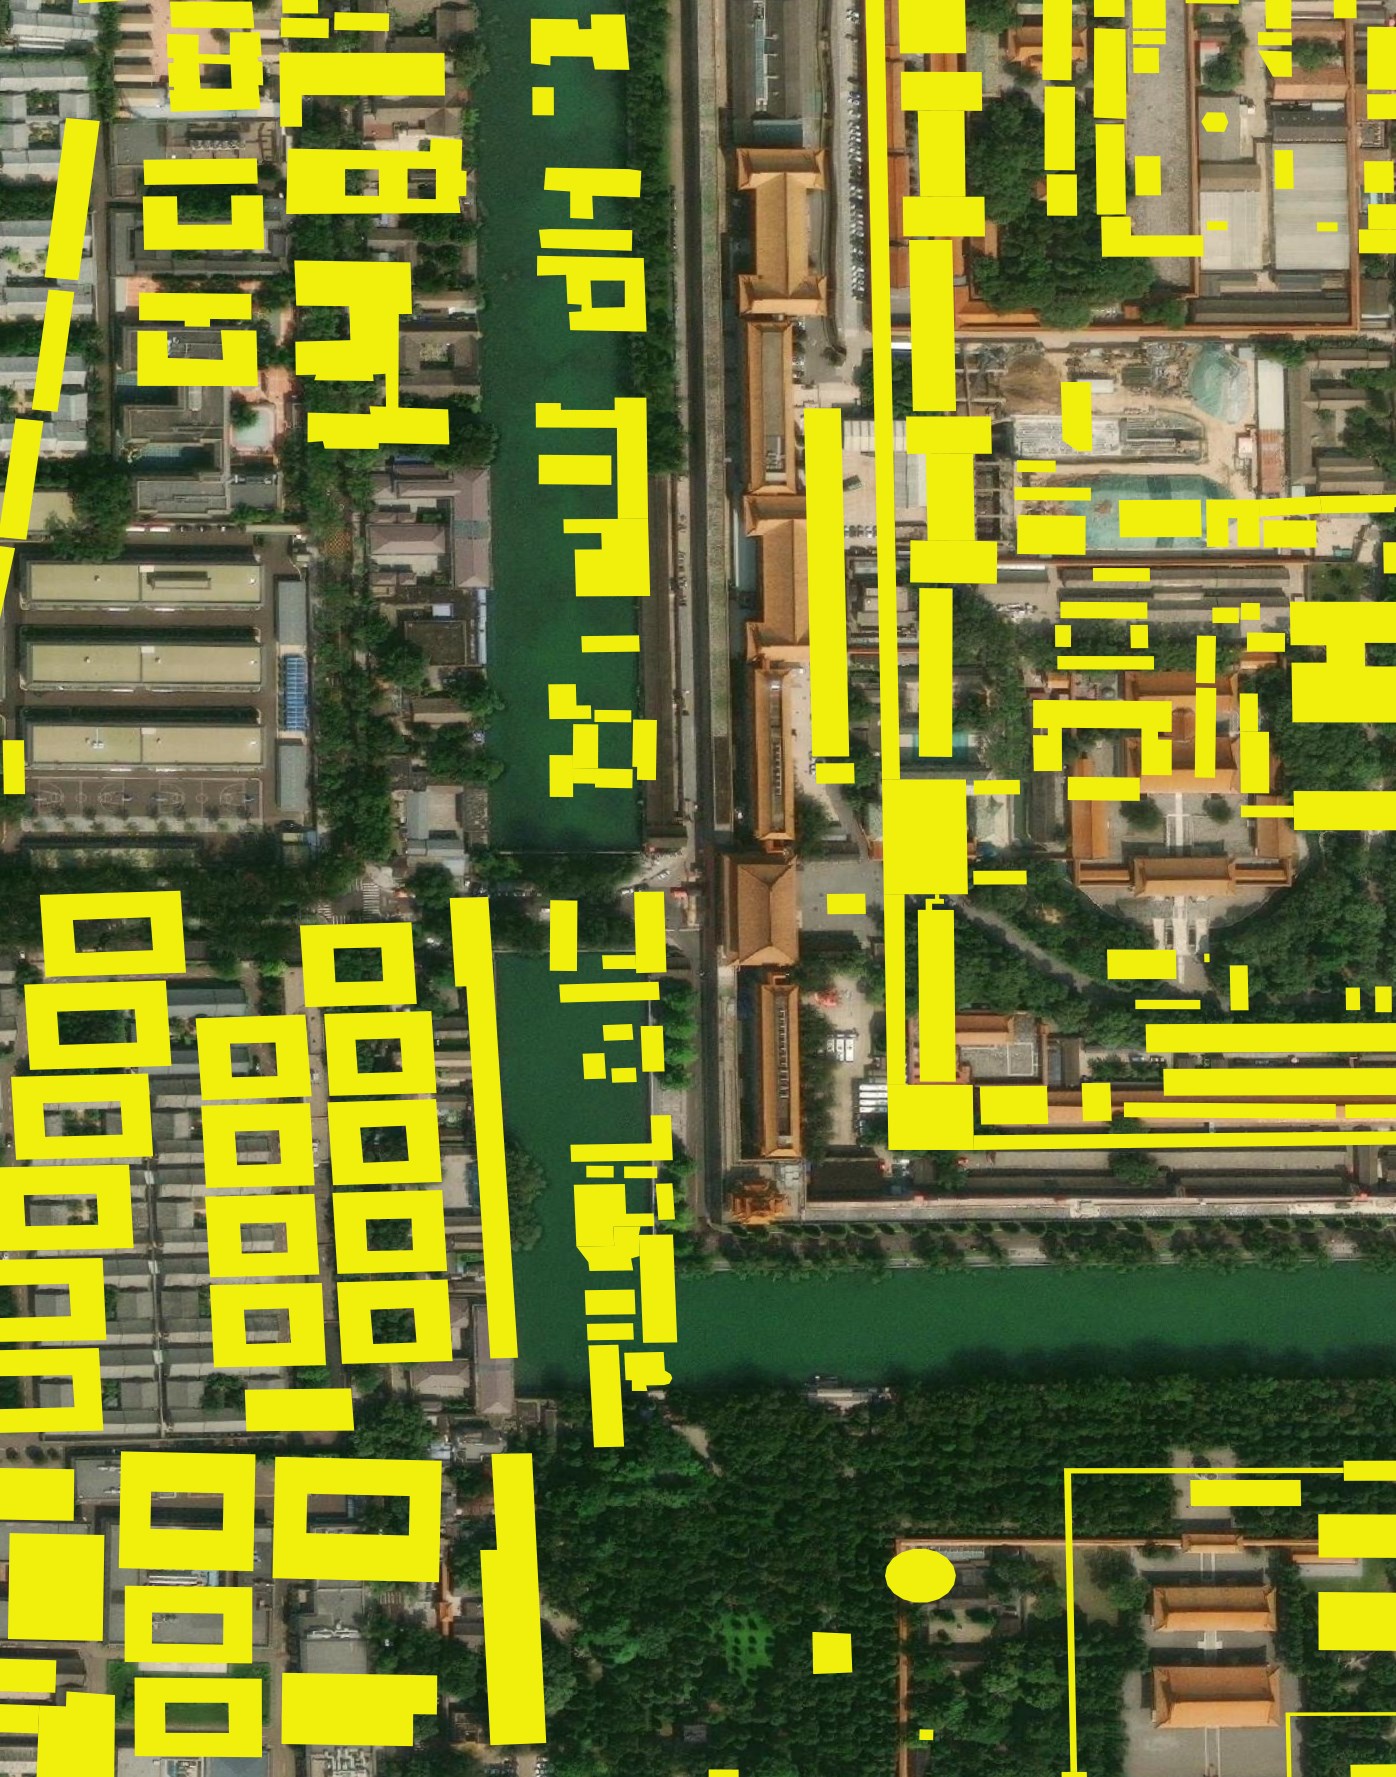
OpenStreetMap (OSM) doesn't have comprehensive building footprints for many areas in China, including just north of the Forbidden City in Beijing. The buildings are indicated by reddish-pink polygons. Large, built-up areas haven't had any of their buildings digitised in OSM's database.
Overture uses OSM building data exclusively in Beijing. I'll find the Parquet file with Beijing's data for June. This will help me avoid scanning 100s of Parquet files and speed up the building extraction query below.
$ ~/duckdb
SELECT filename,
       COUNT(*)
FROM read_parquet('s3://overturemaps-us-west-2/release/2024-06-13-beta.0/theme=buildings/type=building/*',
                   filename=true,
                   hive_partitioning=1)
WHERE bbox.xmin BETWEEN 116.28749 AND 116.52790
AND   bbox.ymin BETWEEN  39.83297 AND  40.01533
GROUP BY 1
ORDER BY 1;
The above reported file 00208 is the only one that contains data for this bounding box in Beijing.
COPY (
    SELECT * EXCLUDE (geometry,
                      bbox,
                      names,
                      sources),
           ST_GEOMFROMWKB(geometry) geom,
           JSON(bbox)    AS bbox,
           JSON(names)   AS names,
           JSON(sources) AS sources
    FROM read_parquet('s3://overturemaps-us-west-2/release/2024-06-13-beta.0/theme=buildings/type=building/*00208*',
                      filename=true,
                      hive_partitioning=1)
    WHERE bbox.xmin BETWEEN 116.28749 AND 116.52790
    AND   bbox.ymin BETWEEN  39.83297 AND  40.01533
)
TO 'beijing.overture.gpkg'
    WITH (FORMAT GDAL,
          DRIVER 'GPKG',
          LAYER_CREATION_OPTIONS 'WRITE_BBOX=YES');
The following shows OSM as being the sole source of data for Overture's Building Footprint dataset for Beijing.
WITH a AS (
    SELECT UNNEST(LIST(JSON(sources)), recursive := true) as rec
    FROM   ST_READ('beijing.overture.gpkg')
)
SELECT   rec[0].dataset AS source,
         COUNT(*) cnt
FROM     a
GROUP BY 1
ORDER by 2 DESC;
┌─────────────────┬───────┐
│     source      │  cnt  │
│      json       │ int64 │
├─────────────────┼───────┤
│ "OpenStreetMap" │ 44204 │
└─────────────────┴───────┘
At first glance, the footprints look much like they did in Meta's OSM Rapids Editor.
However, the buildings are misaligned from what the live OSM database was showing in Rapids. They appear to be offset by 10s of meters.
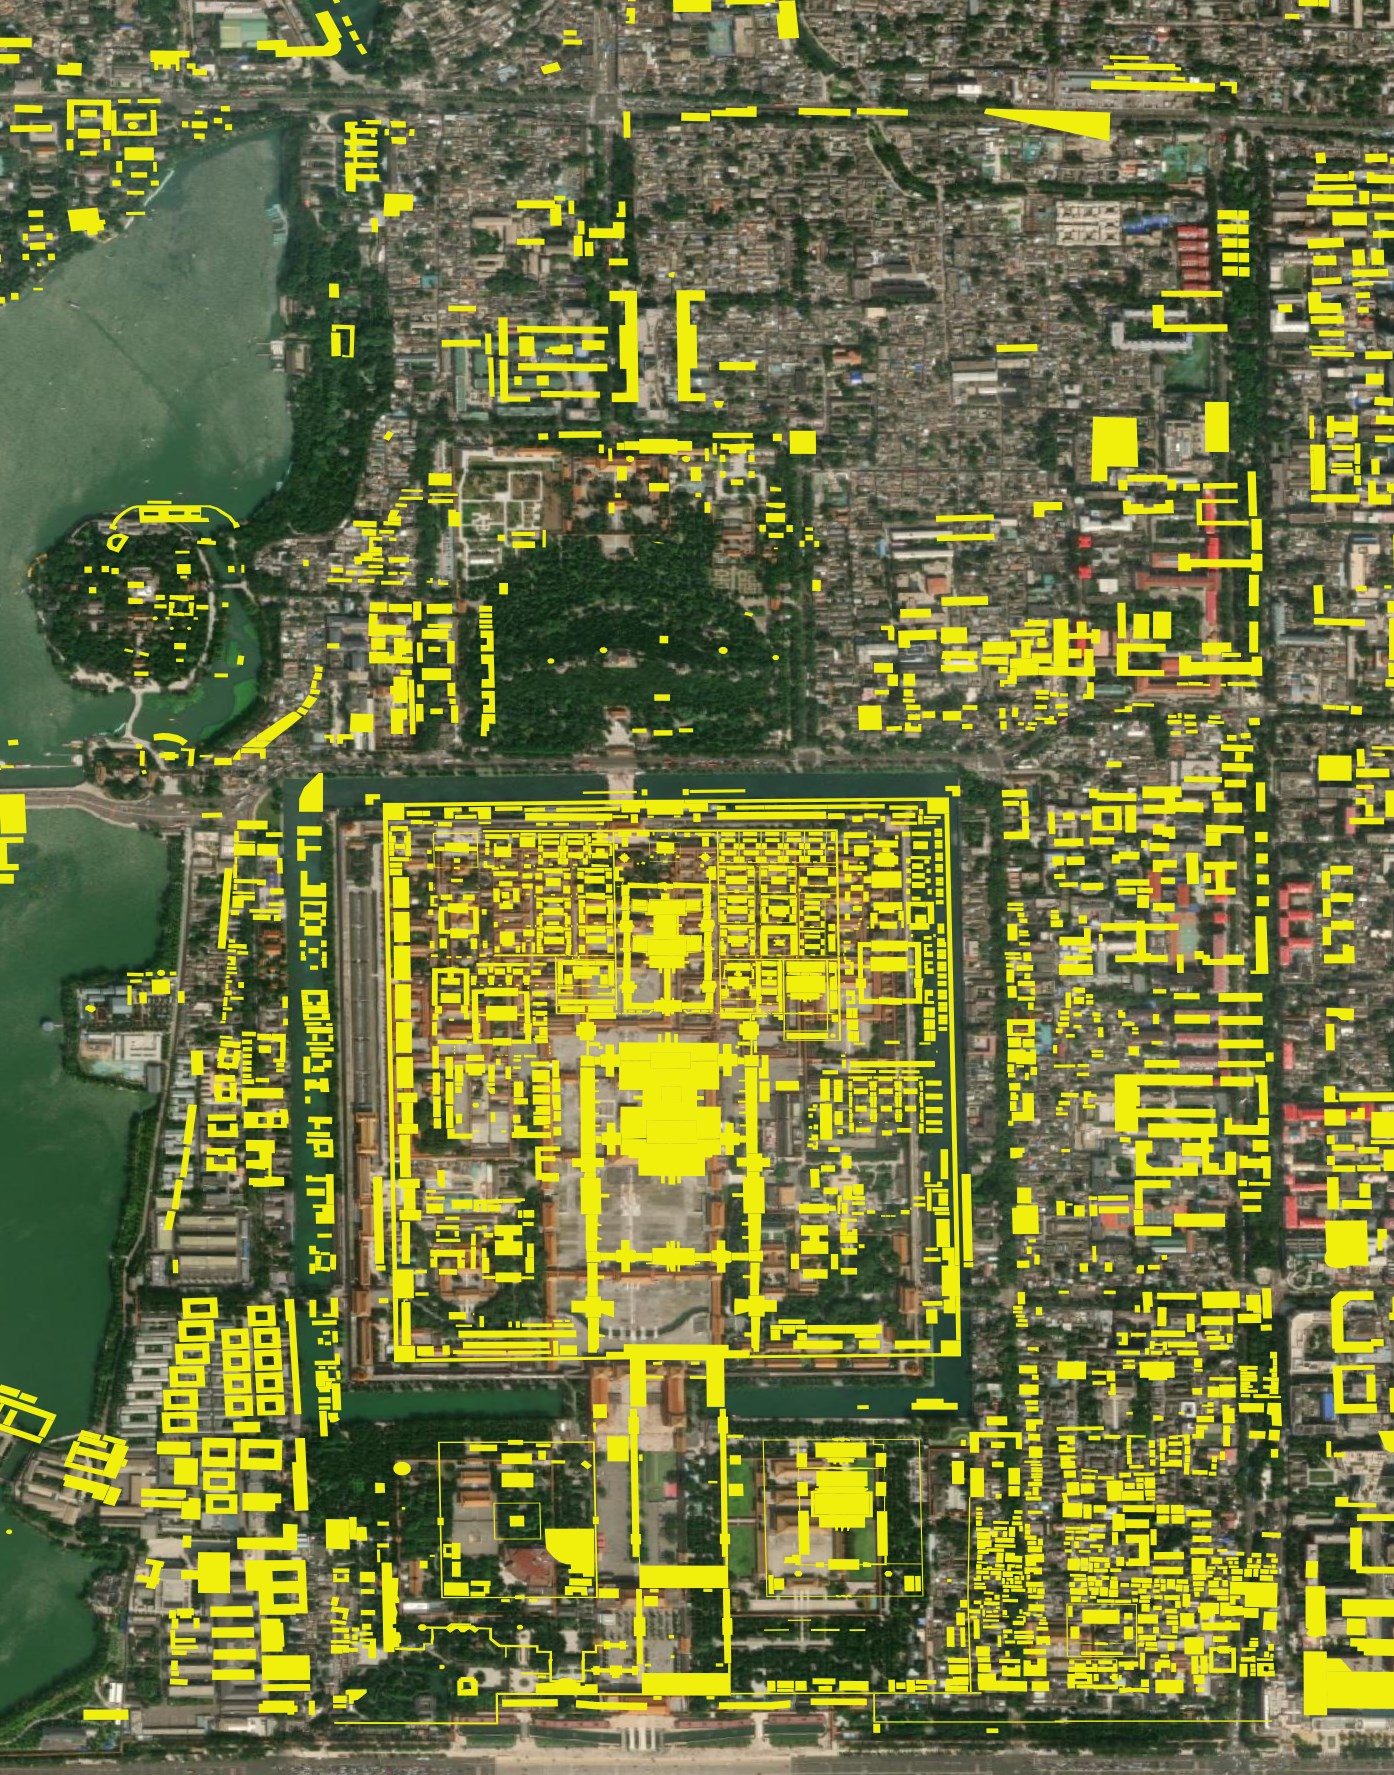
CLSM's Beijing Building Footprints
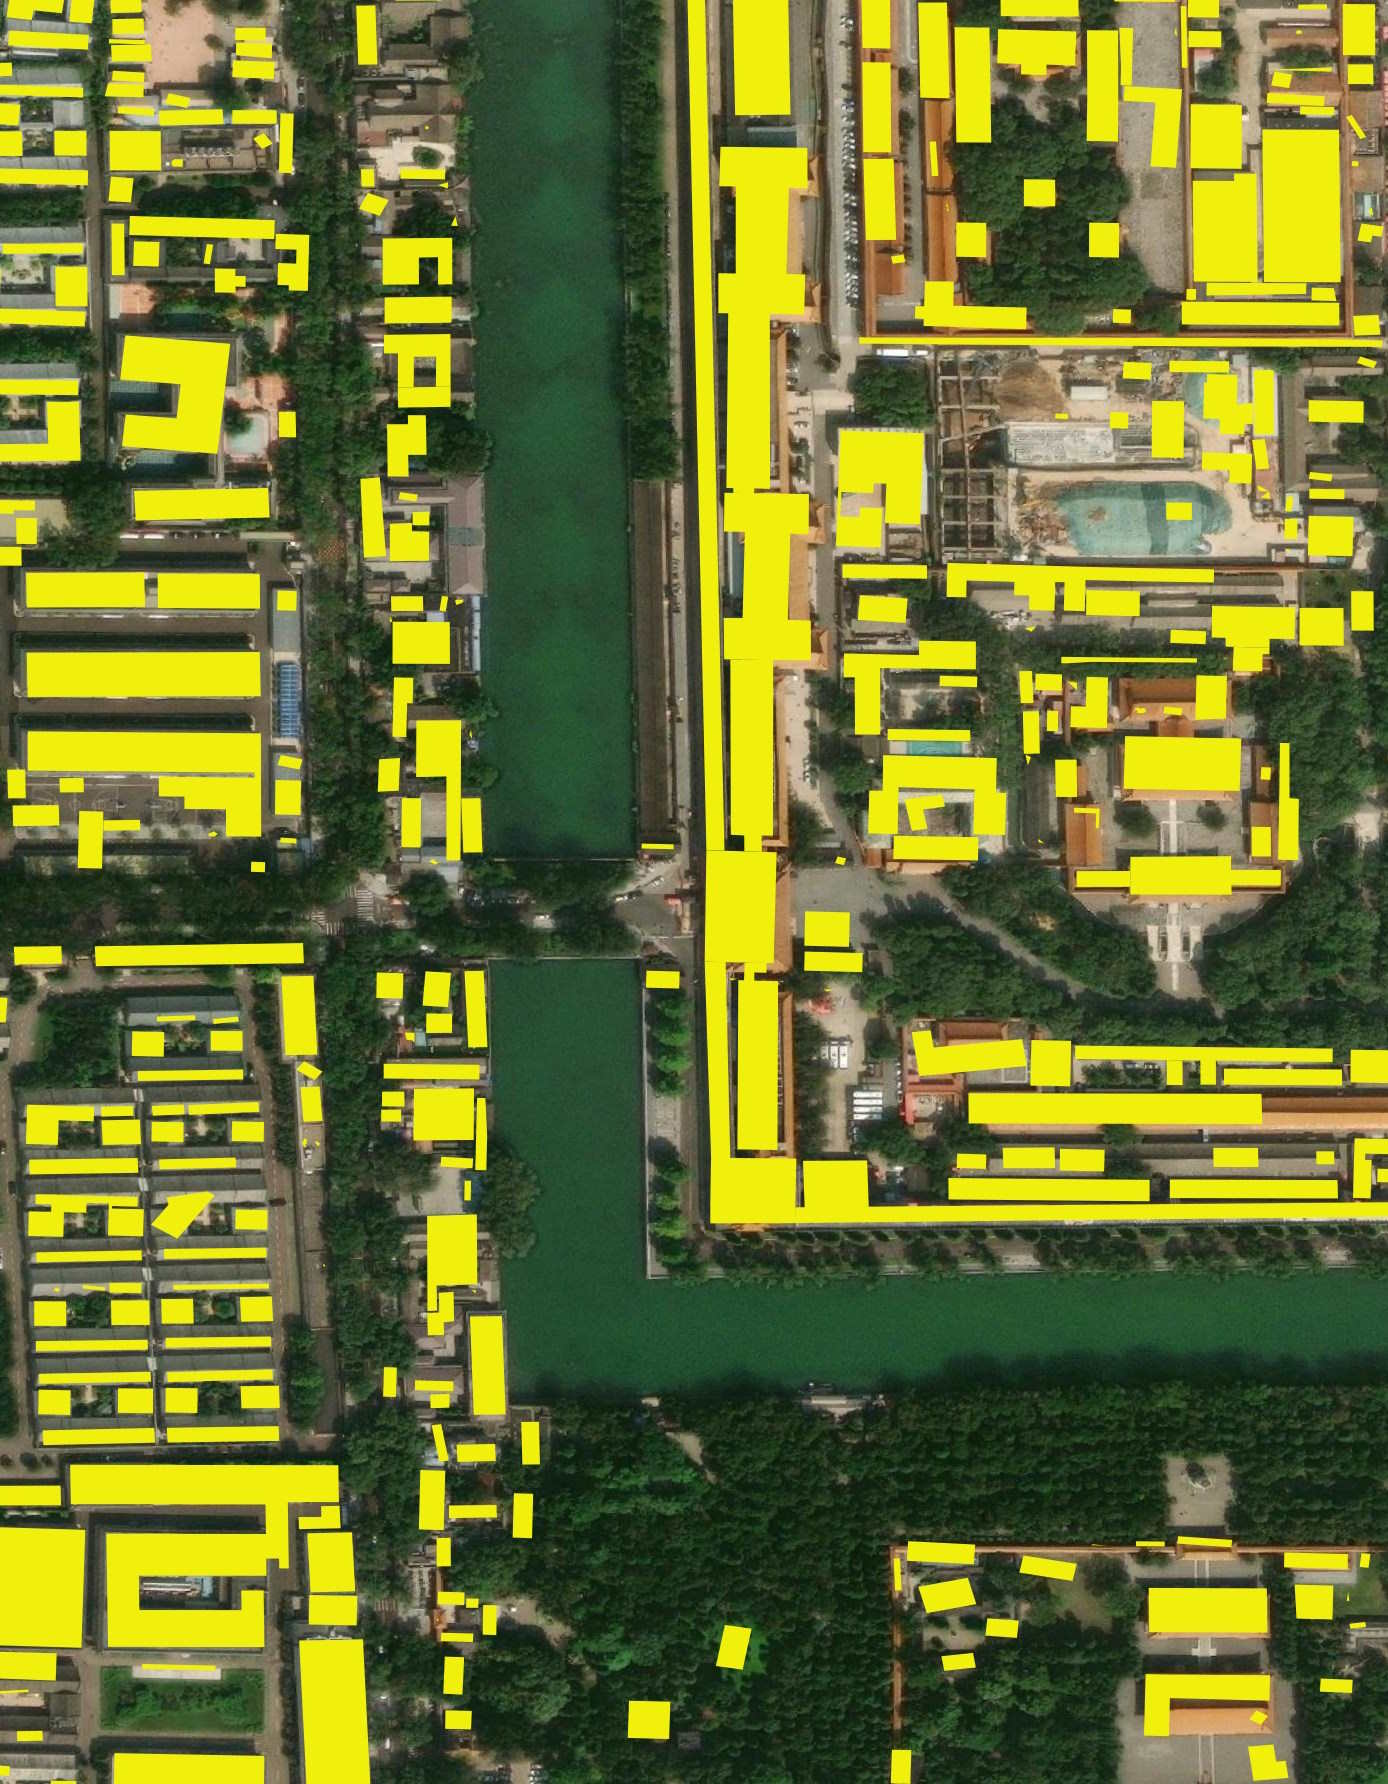
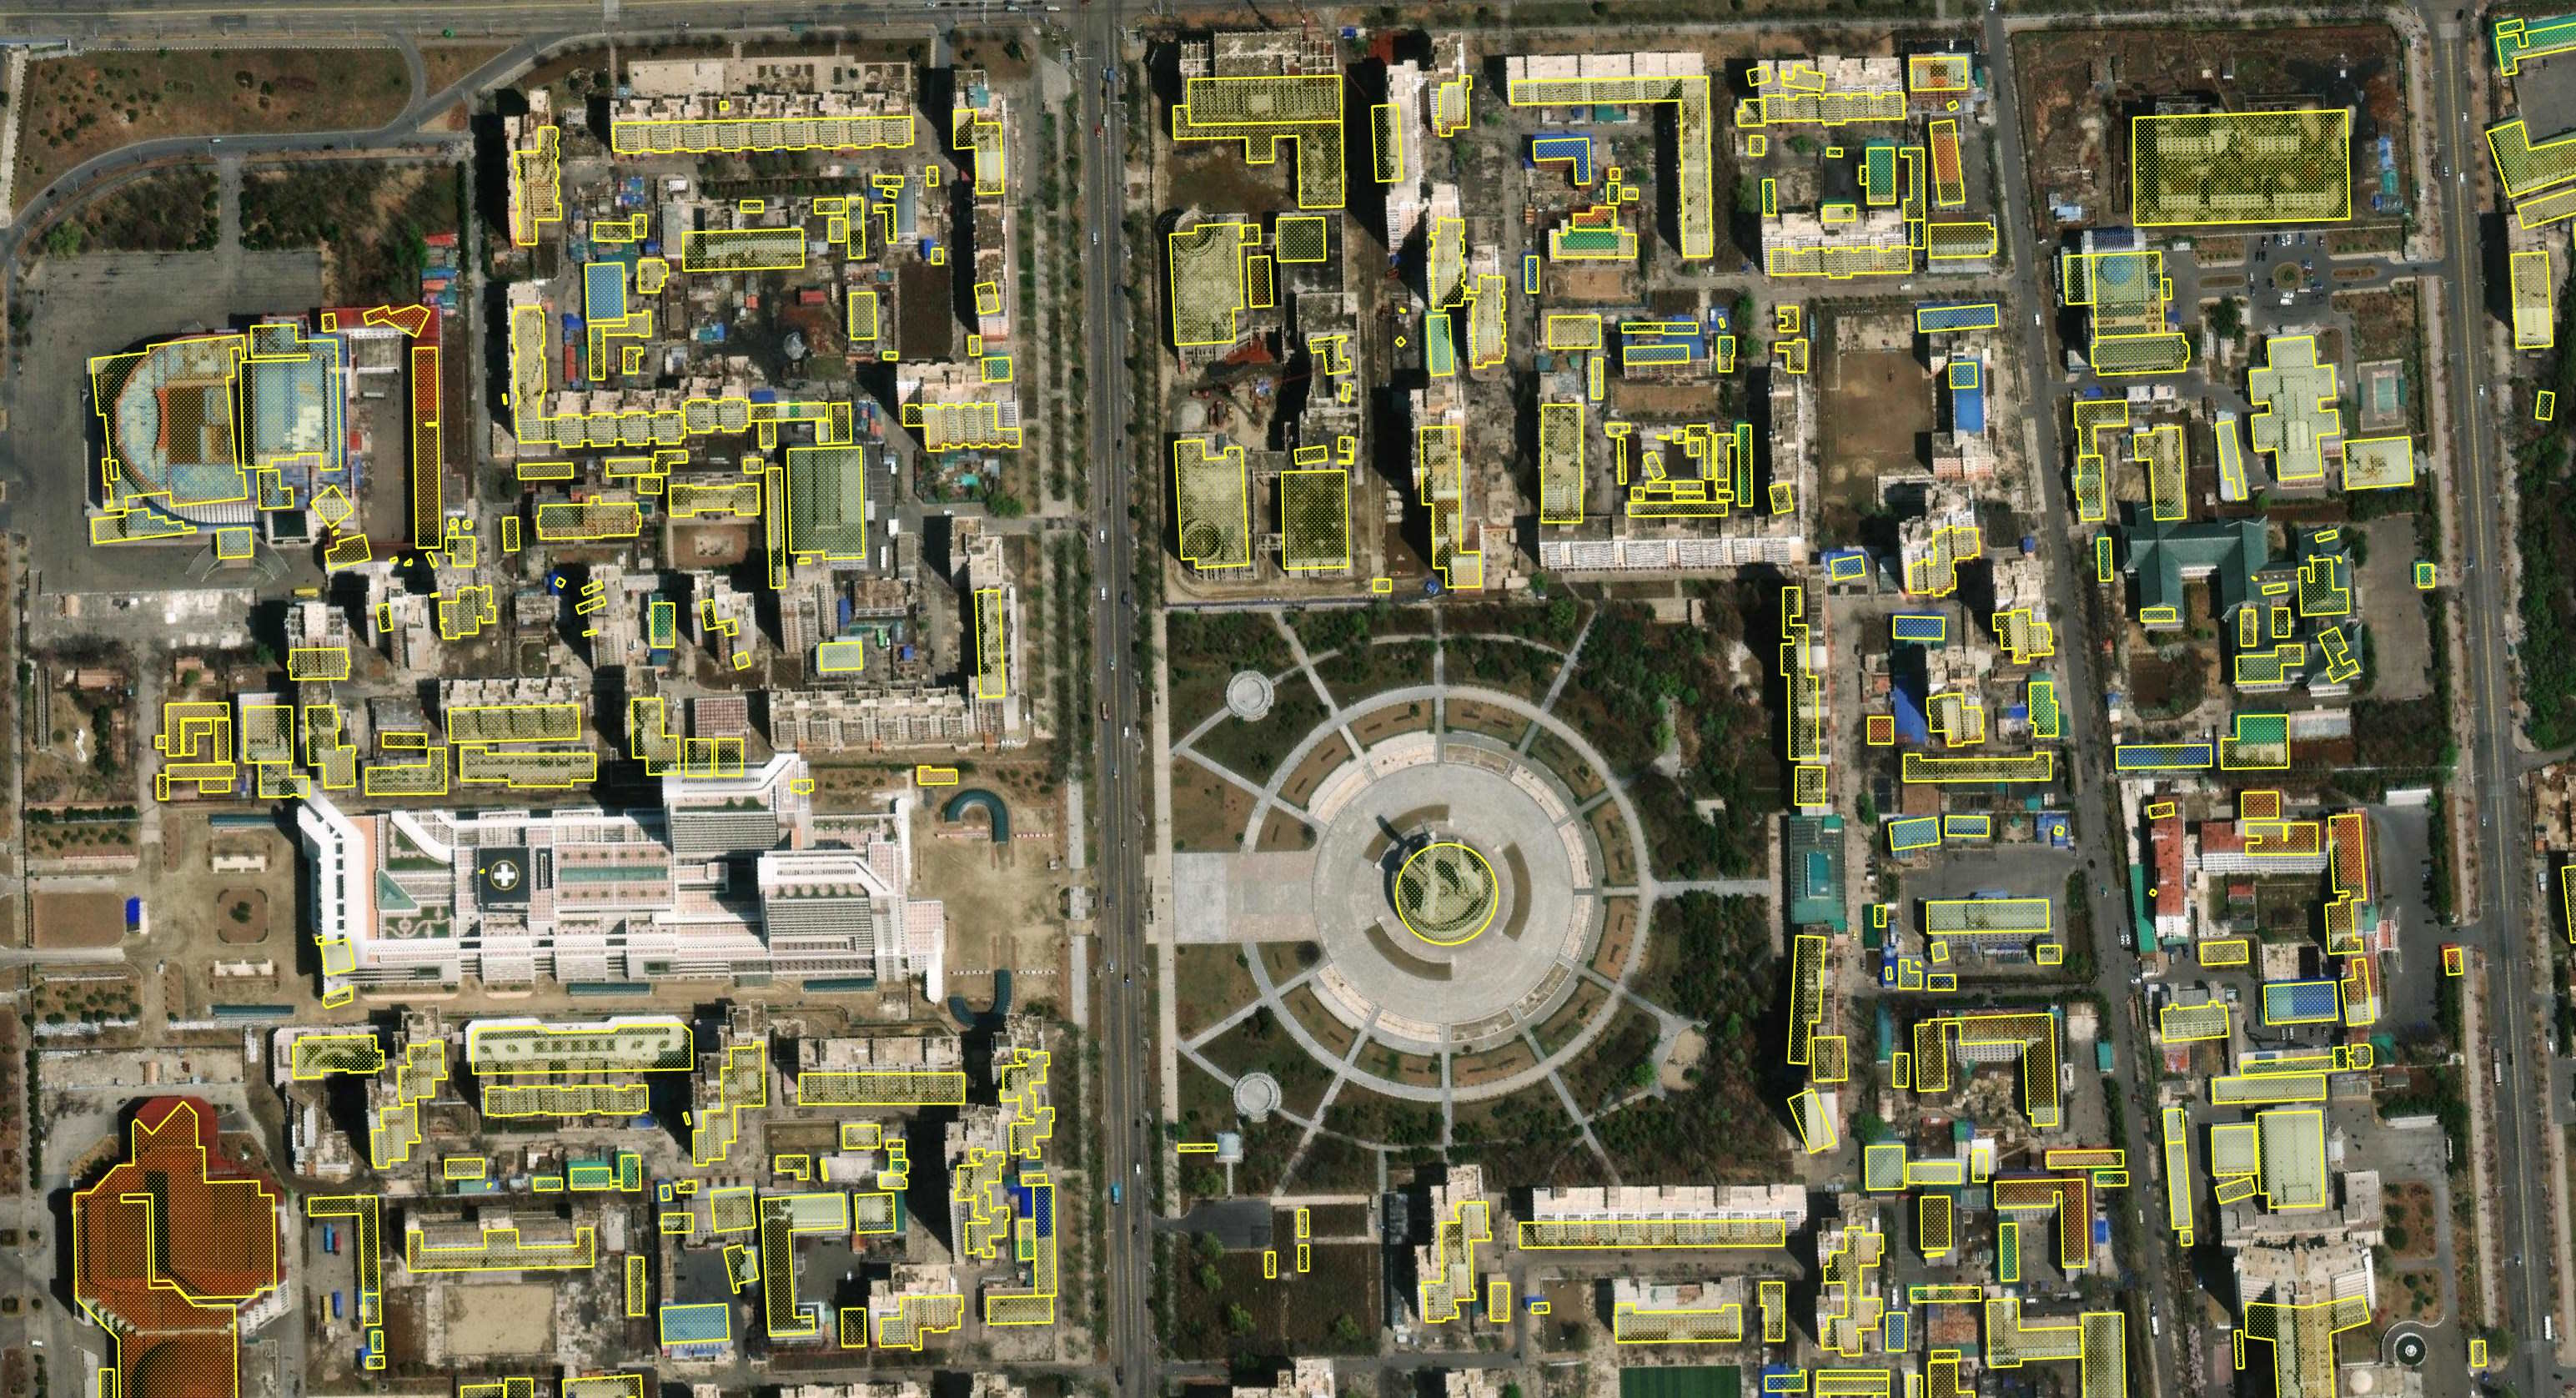
CLSM's building coverage for the area around the Forbidden City looks more comprehensive. Nearly every single building has a polygon on top of it.
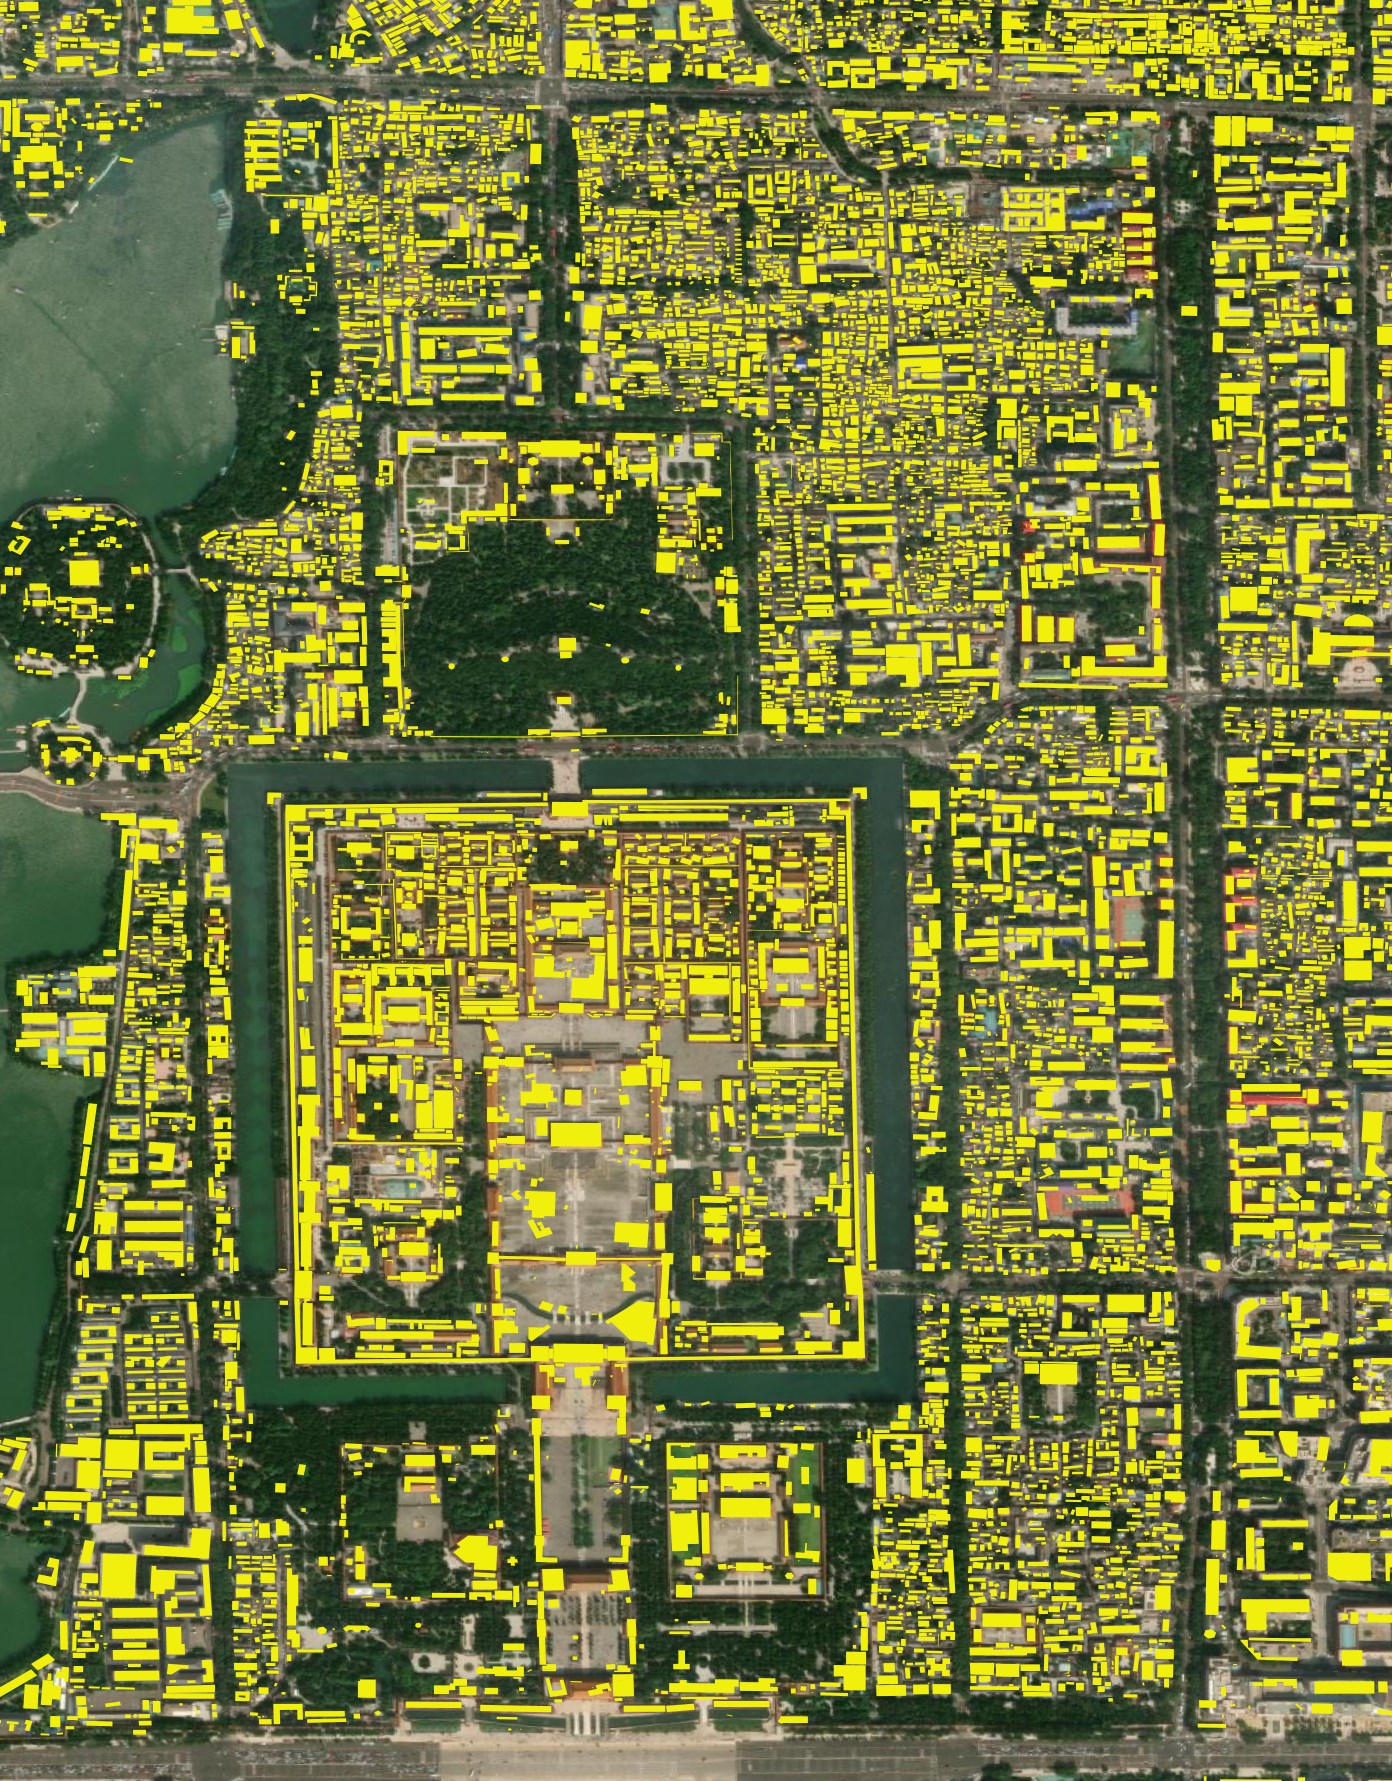
And many building placements aren't perfect but look much more plausible.
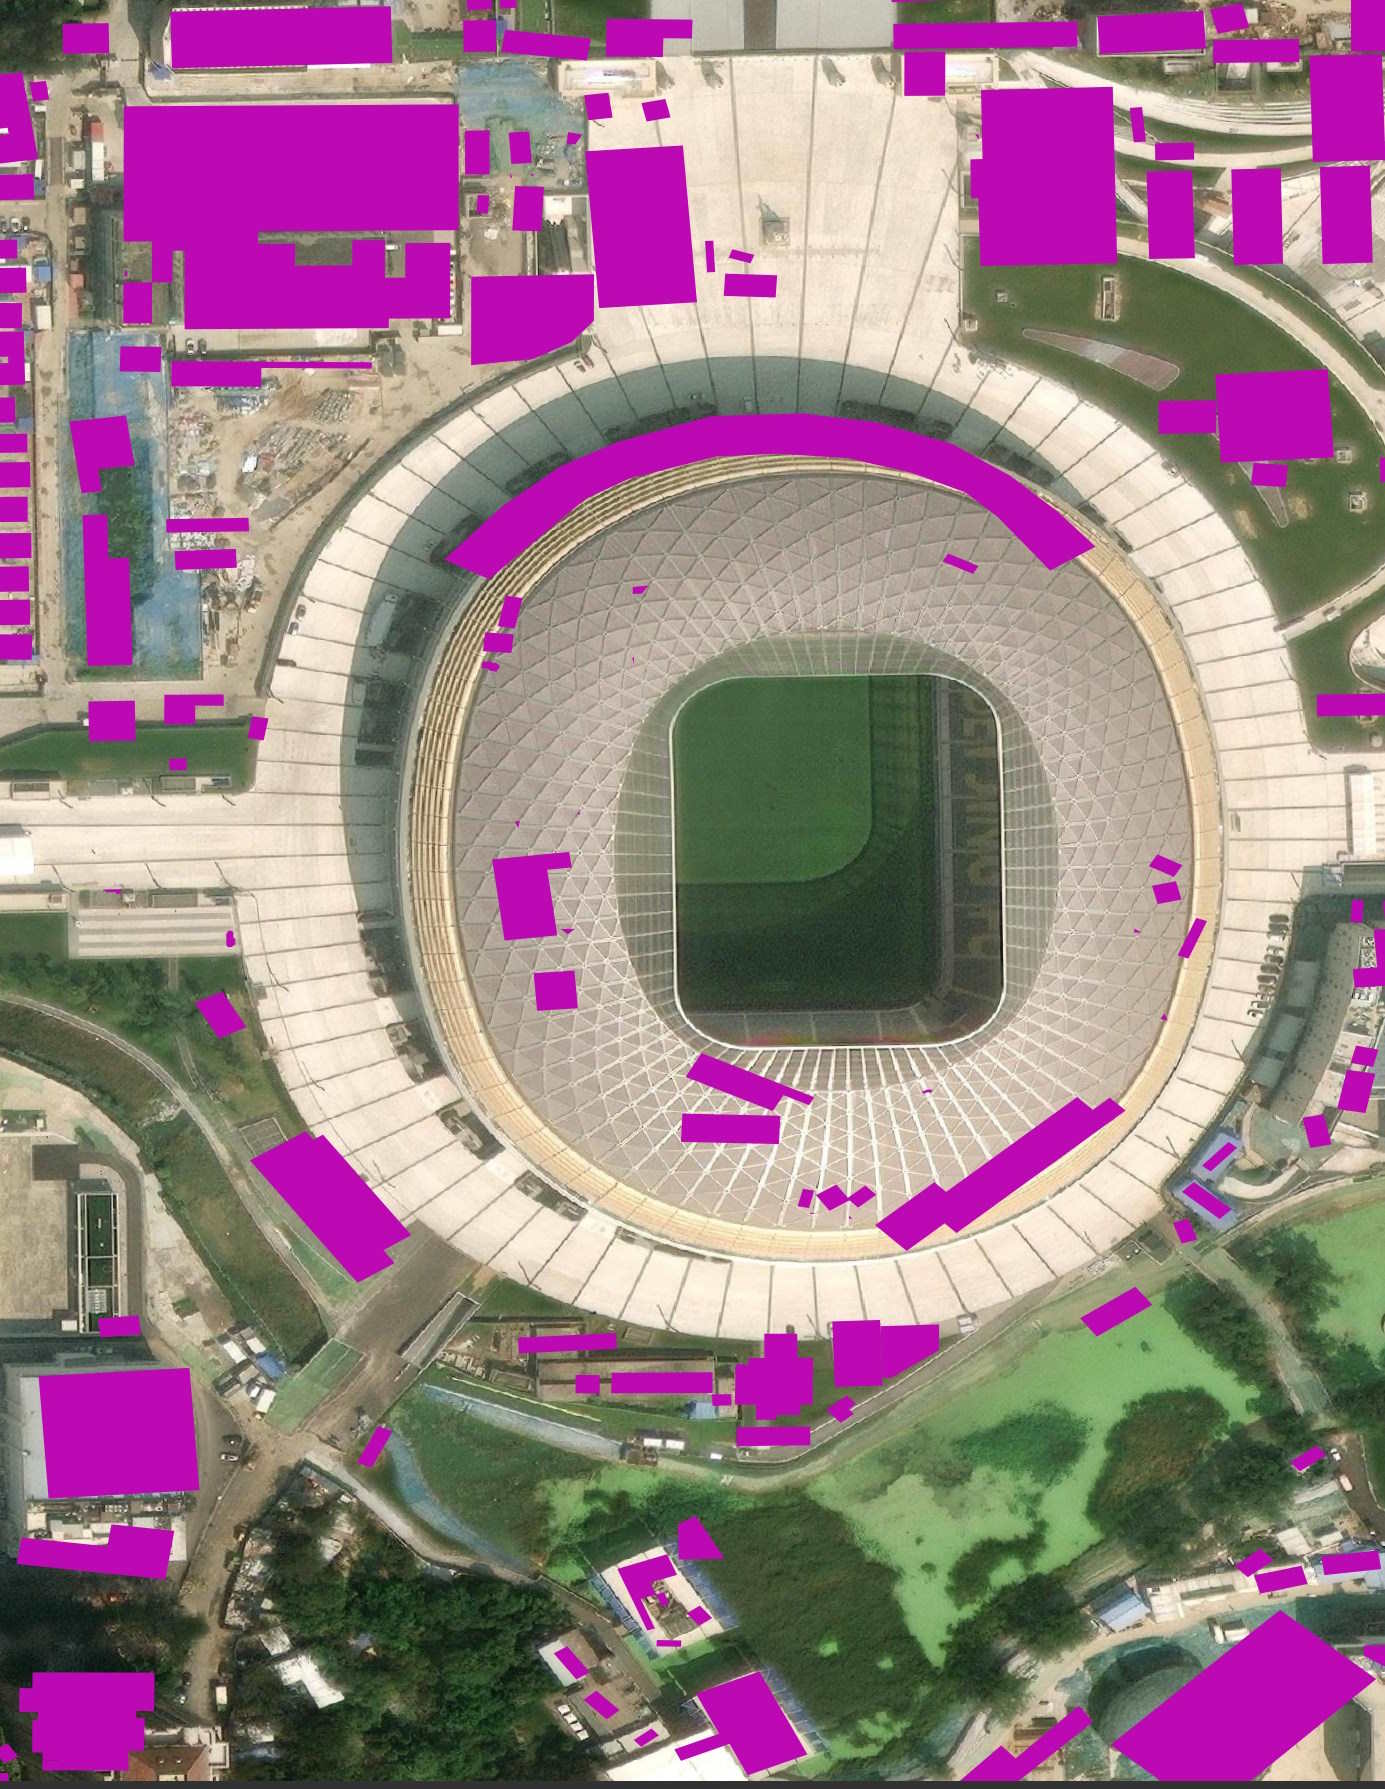
This stadium near the Forbidden City was demolished and rebuilt between 2020 and 2023. It's hard to say what state it might have been in when the source imagery was captured. It could well be these polygons were inferred from a building site rather than a finished stadium.
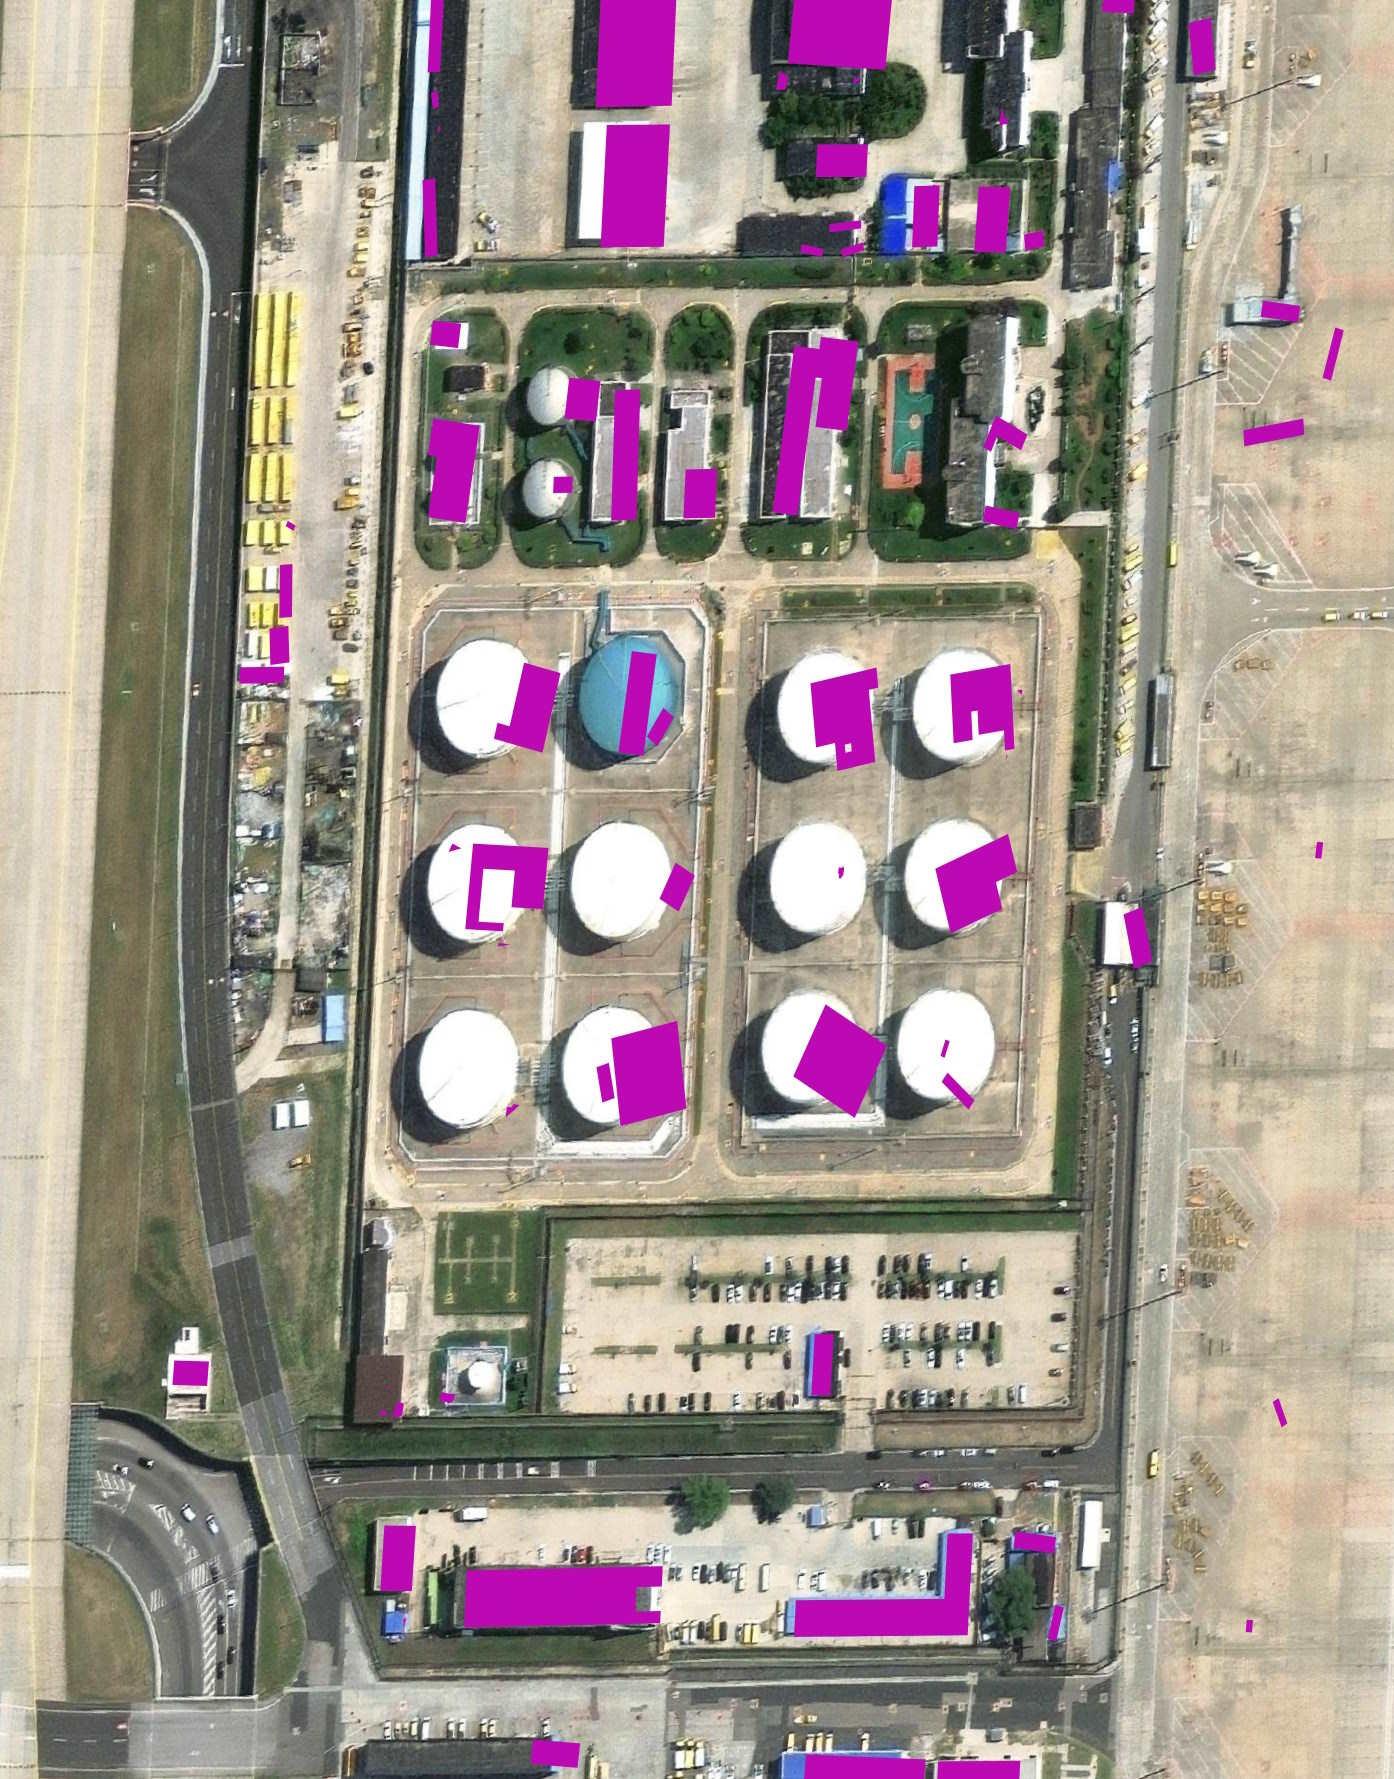
The polygons around Beijing Airport are more of a mixed bag.
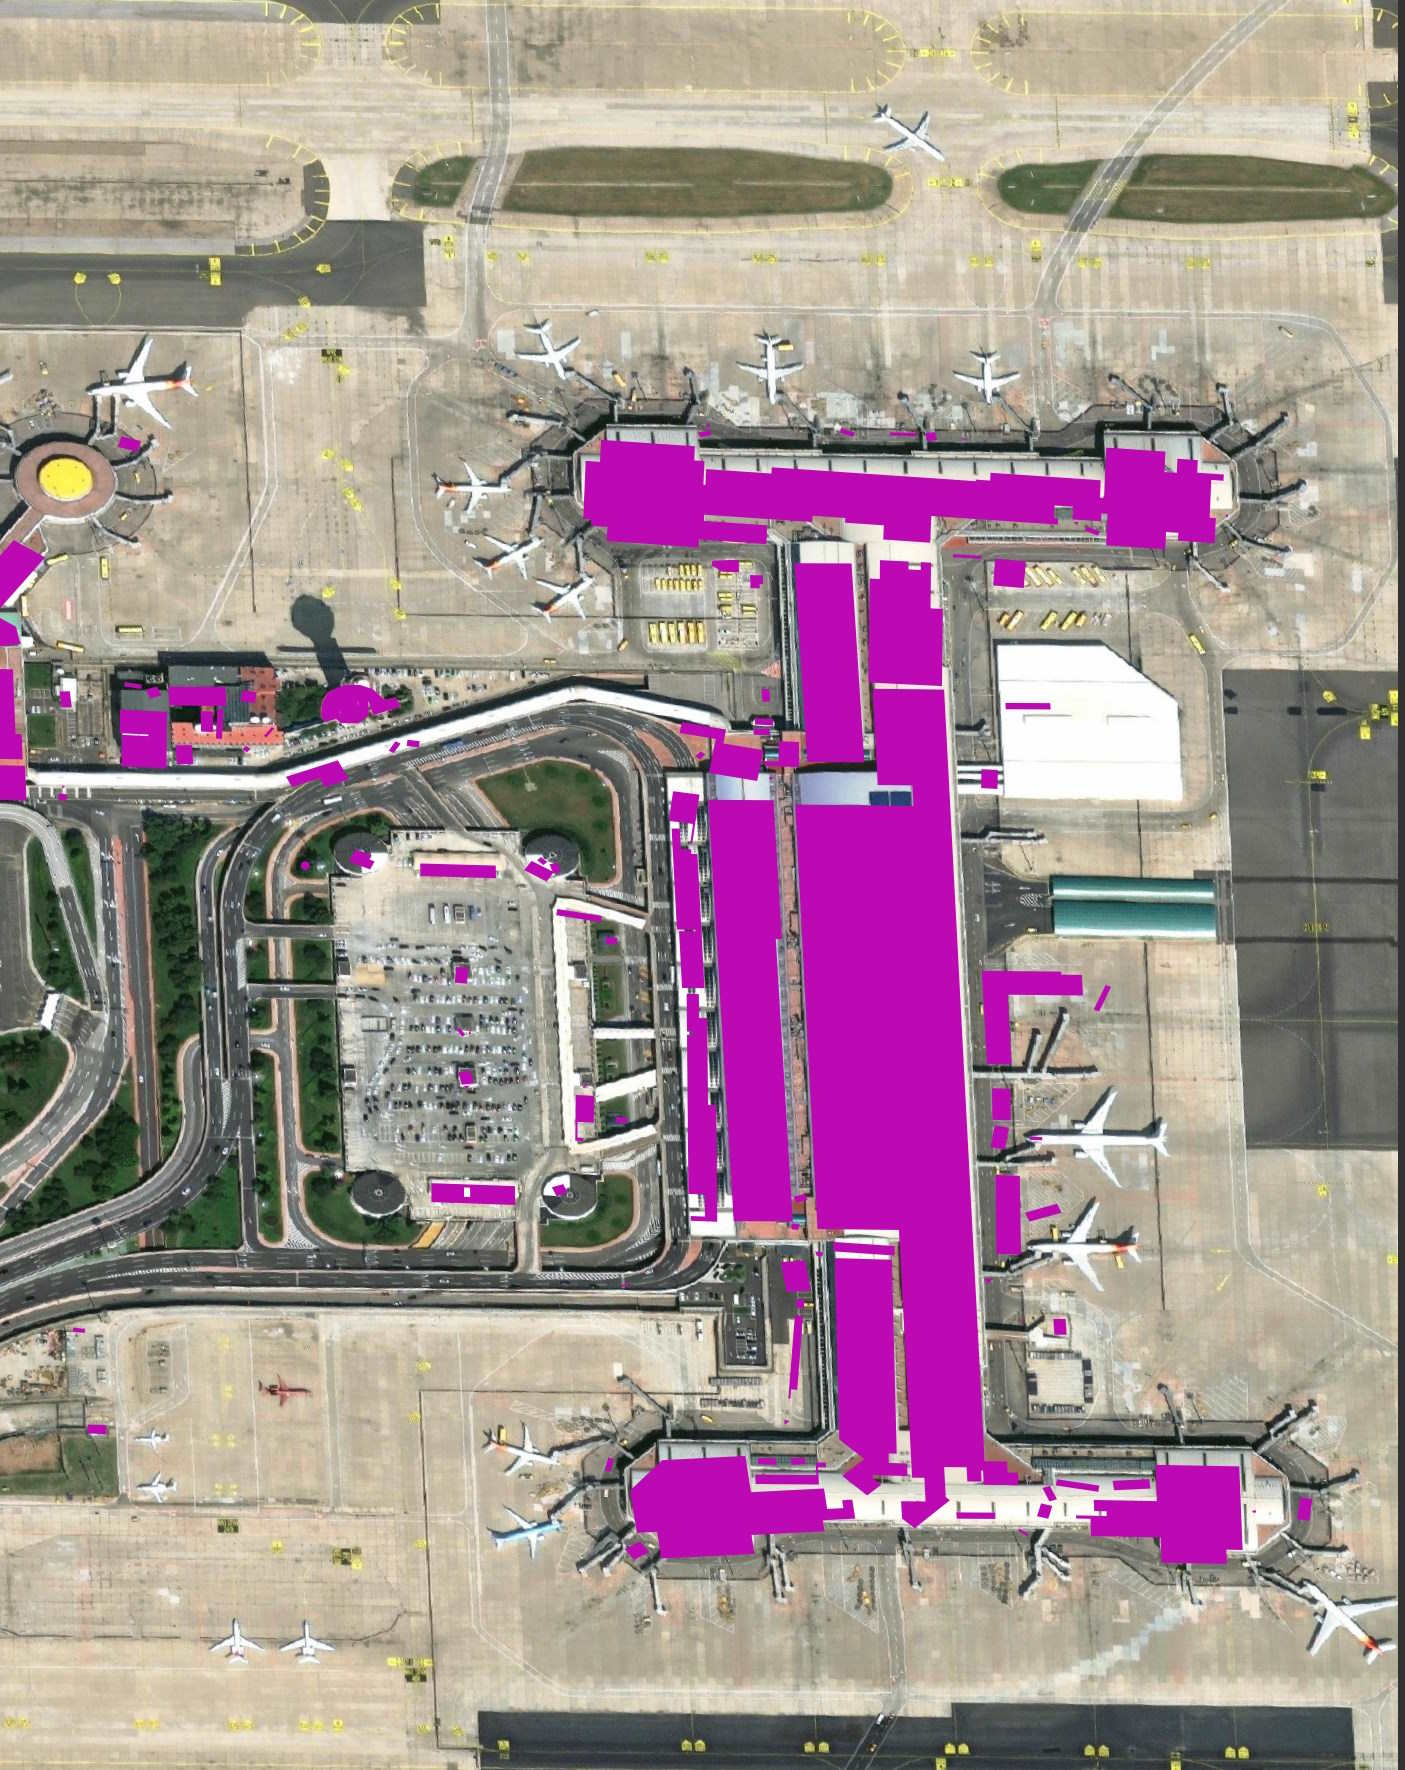
The fuel containers seem to have thrown the model off.
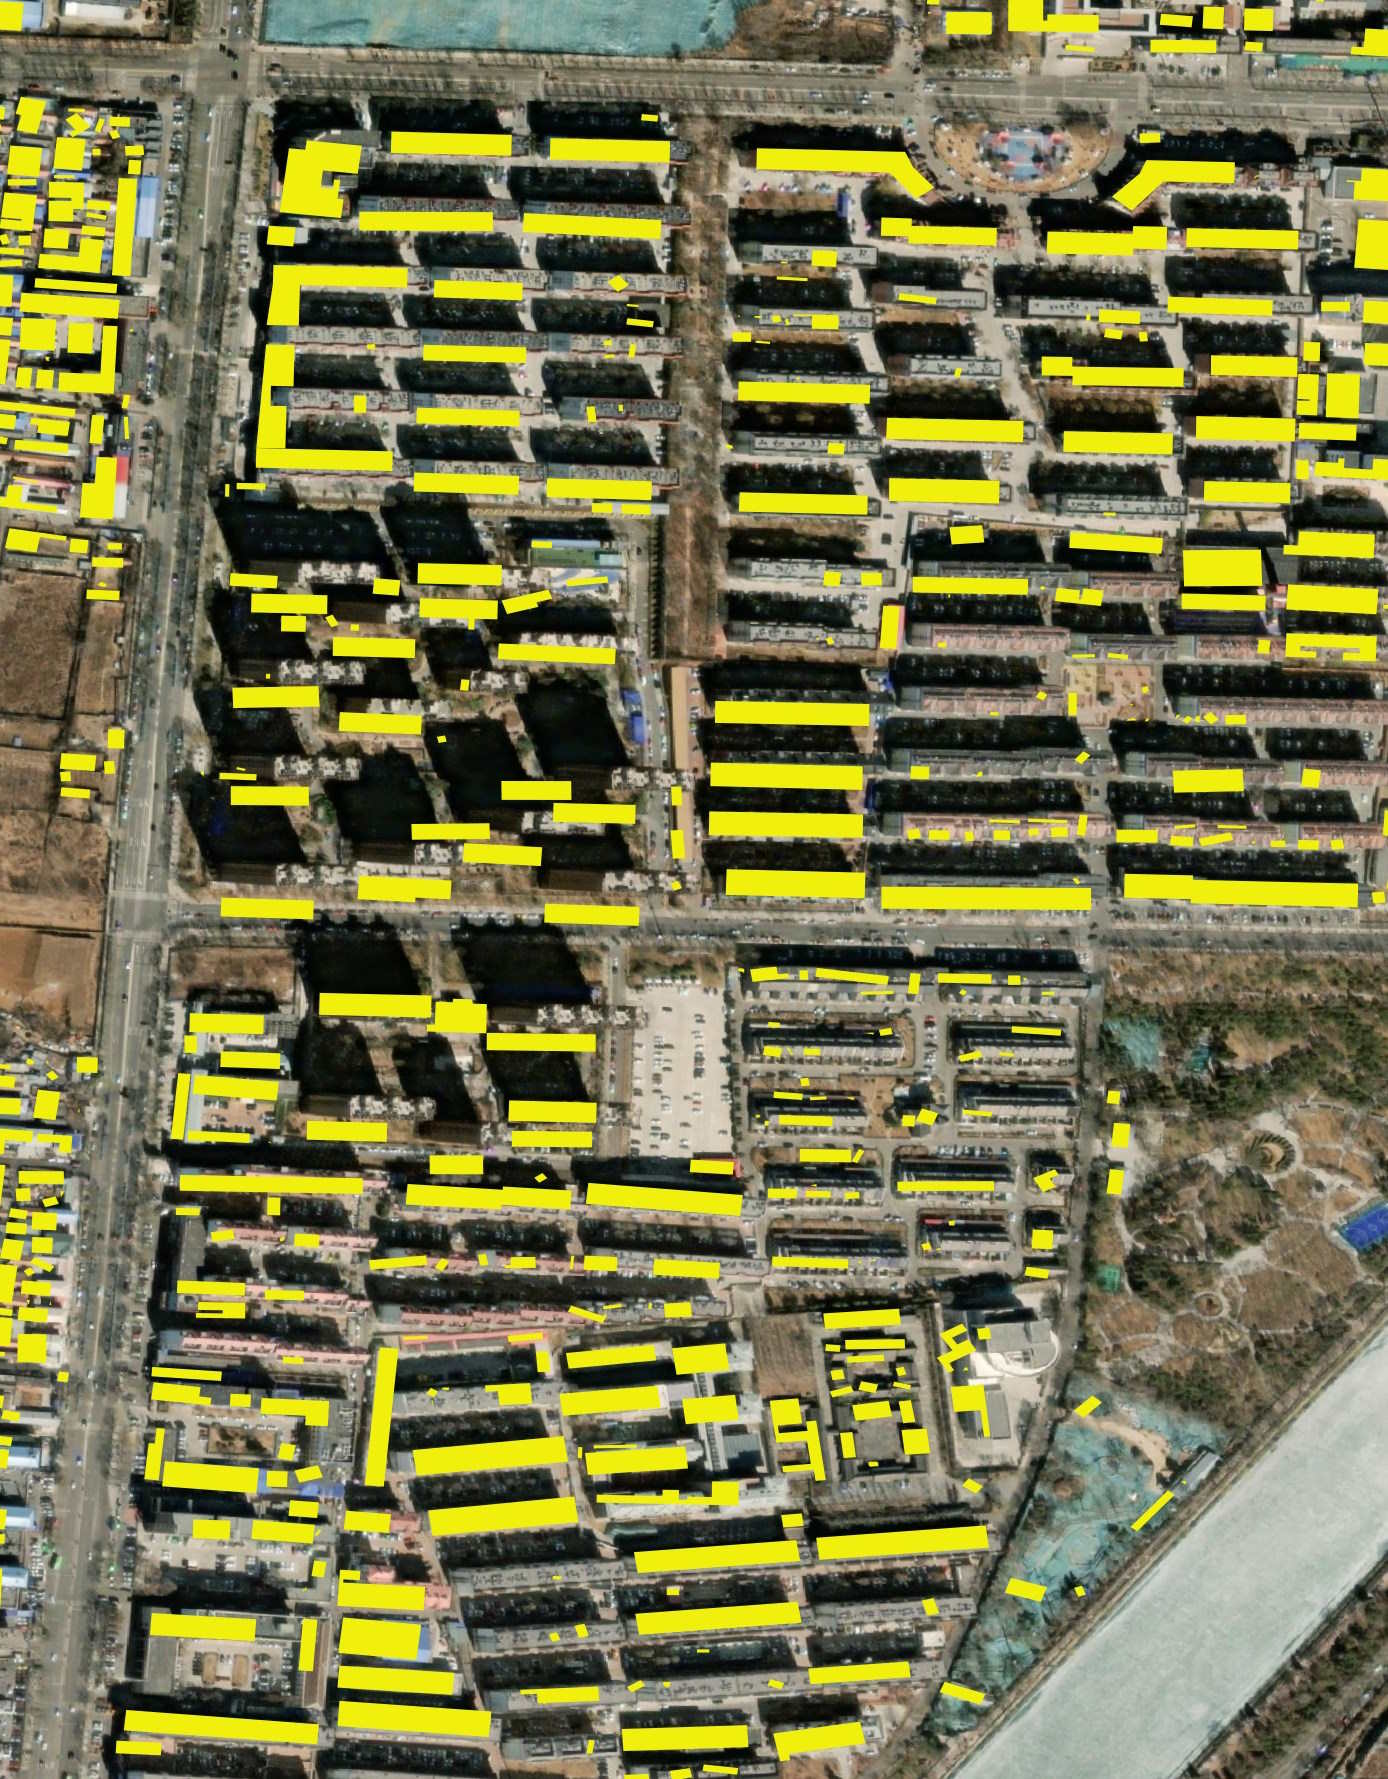
Some tower blocks in Northern Beijing look to be covered properly while nearby ones, which look very similar, aren't well-covered.
Overall, the study area for Beijing is expansive and extensive.
Which Cities Were Studied?
Different cities in the dataset can have different projections. Below I'll get a count for each projection seen in this dataset.
$ python3
from   collections     import Counter
import json
from   multiprocessing import Pool
from   pathlib         import Path

import duckdb
import pyproj


def get_epsg(filename):
    return pyproj.Proj(open(str(filename).split('.')[0] + '.prj').read())\
                    .crs\
                    .to_epsg()


workload = [(filename, get_epsg(filename))
            for filename in Path('.').glob('**/*.shx')]

print(Counter([num for _, num in workload]).most_common())
EPSG:32649 is by far the most common. My script was unable to find the projection for four of the cities so I'll exclude them from the analysis below.
[(32649, 329),
 (3857, 18),
 (4326, 7),
 (None, 4)]
I'll find the bounding box of each city's geometry and export that list as a CSV file.
def extract(manifest):
    filename, epsg_id = manifest

    con = duckdb.connect(database=':memory:')
    con.sql('INSTALL spatial; LOAD spatial')

    # Find the name of the geom column
    sql = 'DESCRIBE FROM ST_READ(?, keep_wkb=TRUE) LIMIT 1'

    wkb_cols = [x['column_name']
                for x in list(con.sql(sql,
                                      params=(filename.as_posix(),)).to_df().iloc())
                if x['column_type'] == 'WKB_BLOB']

    if not wkb_cols:
        return None

    # Create a bounding box of the geometry.
    # Exclude geometry that GEOS doesn't support.
    sql = """SELECT ST_AsText({min_x: MIN(ST_XMIN(ST_TRANSFORM(%(geom)s::GEOMETRY, 'EPSG:%(epsg)d', 'EPSG:4326'))),
                               min_y: MIN(ST_YMIN(ST_TRANSFORM(%(geom)s::GEOMETRY, 'EPSG:%(epsg)d', 'EPSG:4326'))),
                               max_x: MAX(ST_XMAX(ST_TRANSFORM(%(geom)s::GEOMETRY, 'EPSG:%(epsg)d', 'EPSG:4326'))),
                               max_y: MAX(ST_YMAX(ST_TRANSFORM(%(geom)s::GEOMETRY, 'EPSG:%(epsg)d', 'EPSG:4326')))}::BOX_2D::GEOMETRY) AS bbox
             FROM   ST_READ(?, keep_wkb=TRUE)
             WHERE ('0x' || substr(%(geom)s::BLOB::TEXT, 7, 2))::int < 8""" % {
        'geom': wkb_cols[0],
        'epsg': epsg_id}

    try:
        df = con.sql(sql,
                     params=(filename.as_posix(),)).to_df()
    except Exception as exc:
        print(filename)
        print(exc)
        return None

    if not df.empty:
        return filename.name\
                       .split('.')[0]\
                       .replace('_build_final', '')\
                       .upper(), \
               epsg_id, \
               df.iloc()[0]['bbox']

    return None
I'll use 20 processes to speed up the job. A few cities reported errors so I'll exclude them from the analysis below. The following took ~3 hours to complete.
pool = Pool(20)
resp = pool.map(extract, [(filename, epsg_num)
                          for filename, epsg_num in workload
                          if epsg_num])

resp = [x
        for x in resp
        if x is not None]

with open('bboxes.csv', 'w') as f:
    f.write('filename, epsg, geom\n')

    for filename, epsg, geom in resp:
        f.write('"%s",%d,"%s"\n' % (filename, epsg, geom))
I wasn't able to max out most of the CPU cores but the job still ran a lot faster than it would had it been single-threaded.
The bounding boxes for 348 cities, regions and countries were detected and saved into bboxes.csv. Around ten records ordered their coordinates by longitude and latitude while the remaining did the inverse. I ran the following Python code to normalise them all to longitude then latitude.
$ python3
import csv

from shapely     import wkt
from shapely.ops import transform


with open('bboxes.csv') as csv_file:
    reader = csv.DictReader(csv_file, skipinitialspace=True)

    with open('bboxes2.csv', 'w') as out:
        writer = csv.DictWriter(out, fieldnames=reader.fieldnames)
        writer.writeheader()

        for row in reader:
            if ',' in row['geom']:
                poly = wkt.loads(row['geom'])

                if  poly.exterior.coords.xy[0][0] < \
                    poly.exterior.coords.xy[1][0]:
                    row['geom'] = transform(lambda x, y: (y, x), poly).wkt

                writer.writerow({key: value
                                 for key, value in row.items()})
Buildings of Interest
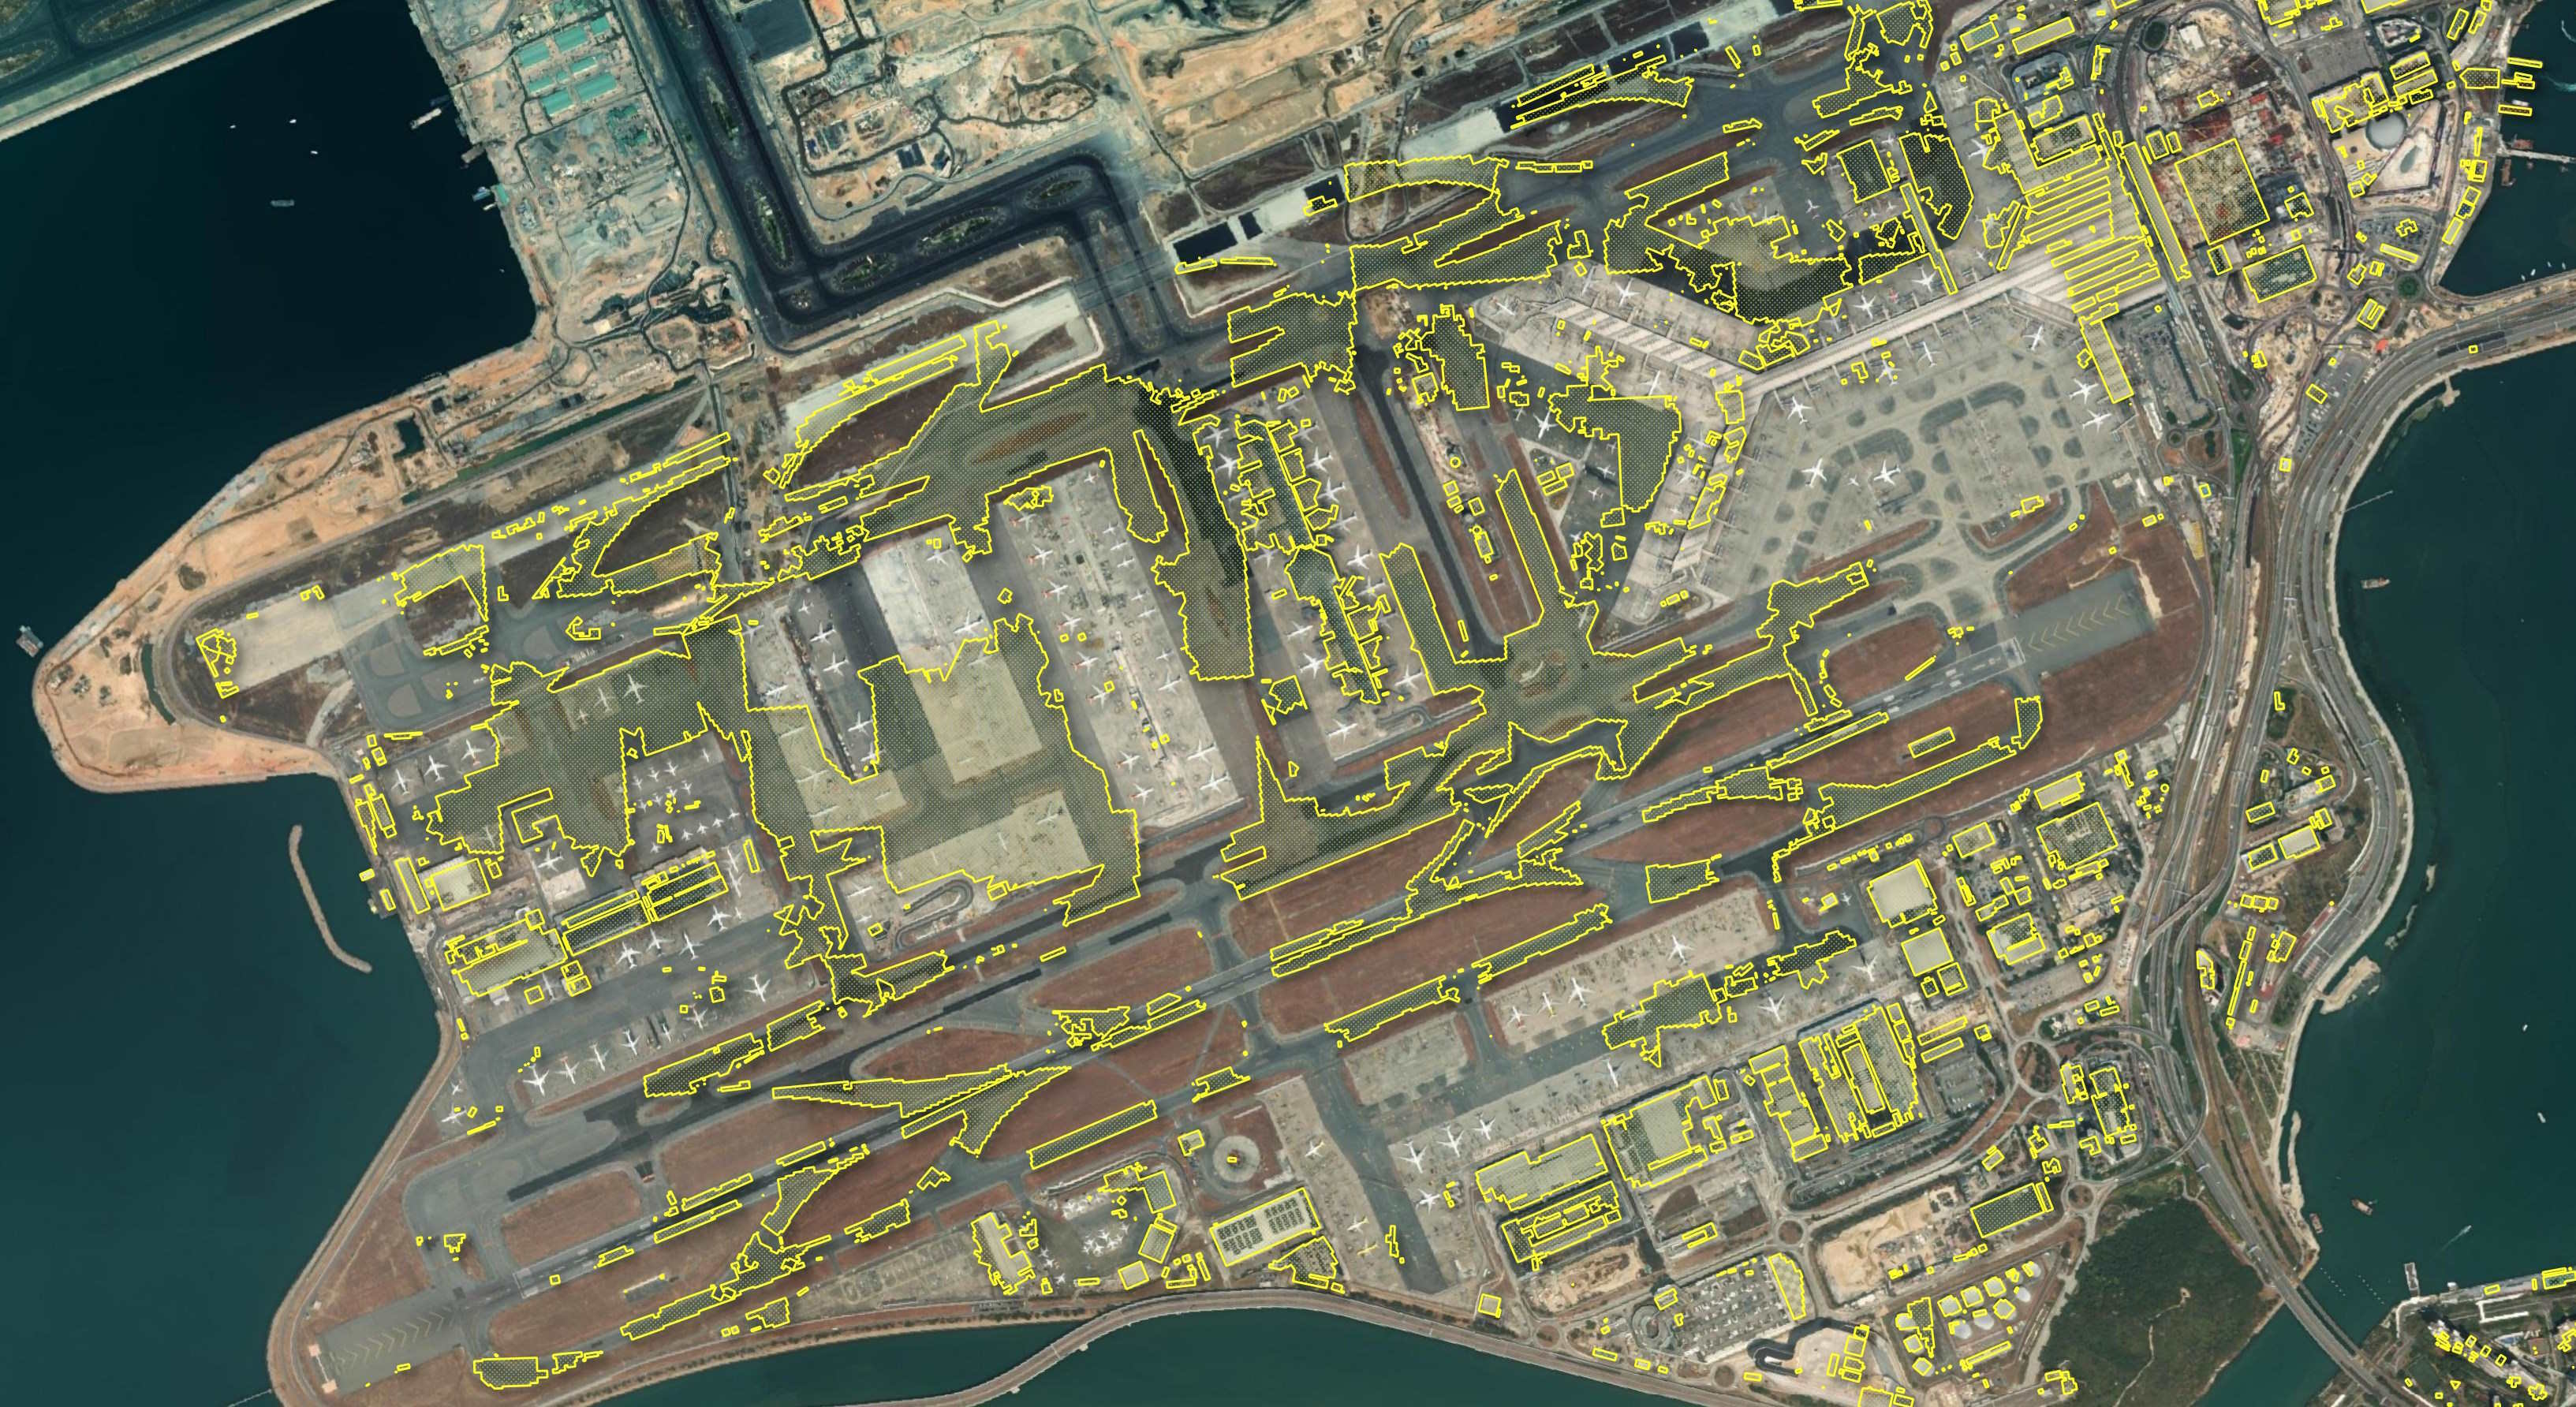
A lot of non-sheltering permanent infrastructure looks to be outlined as building footprints at Hong Kong Airport.
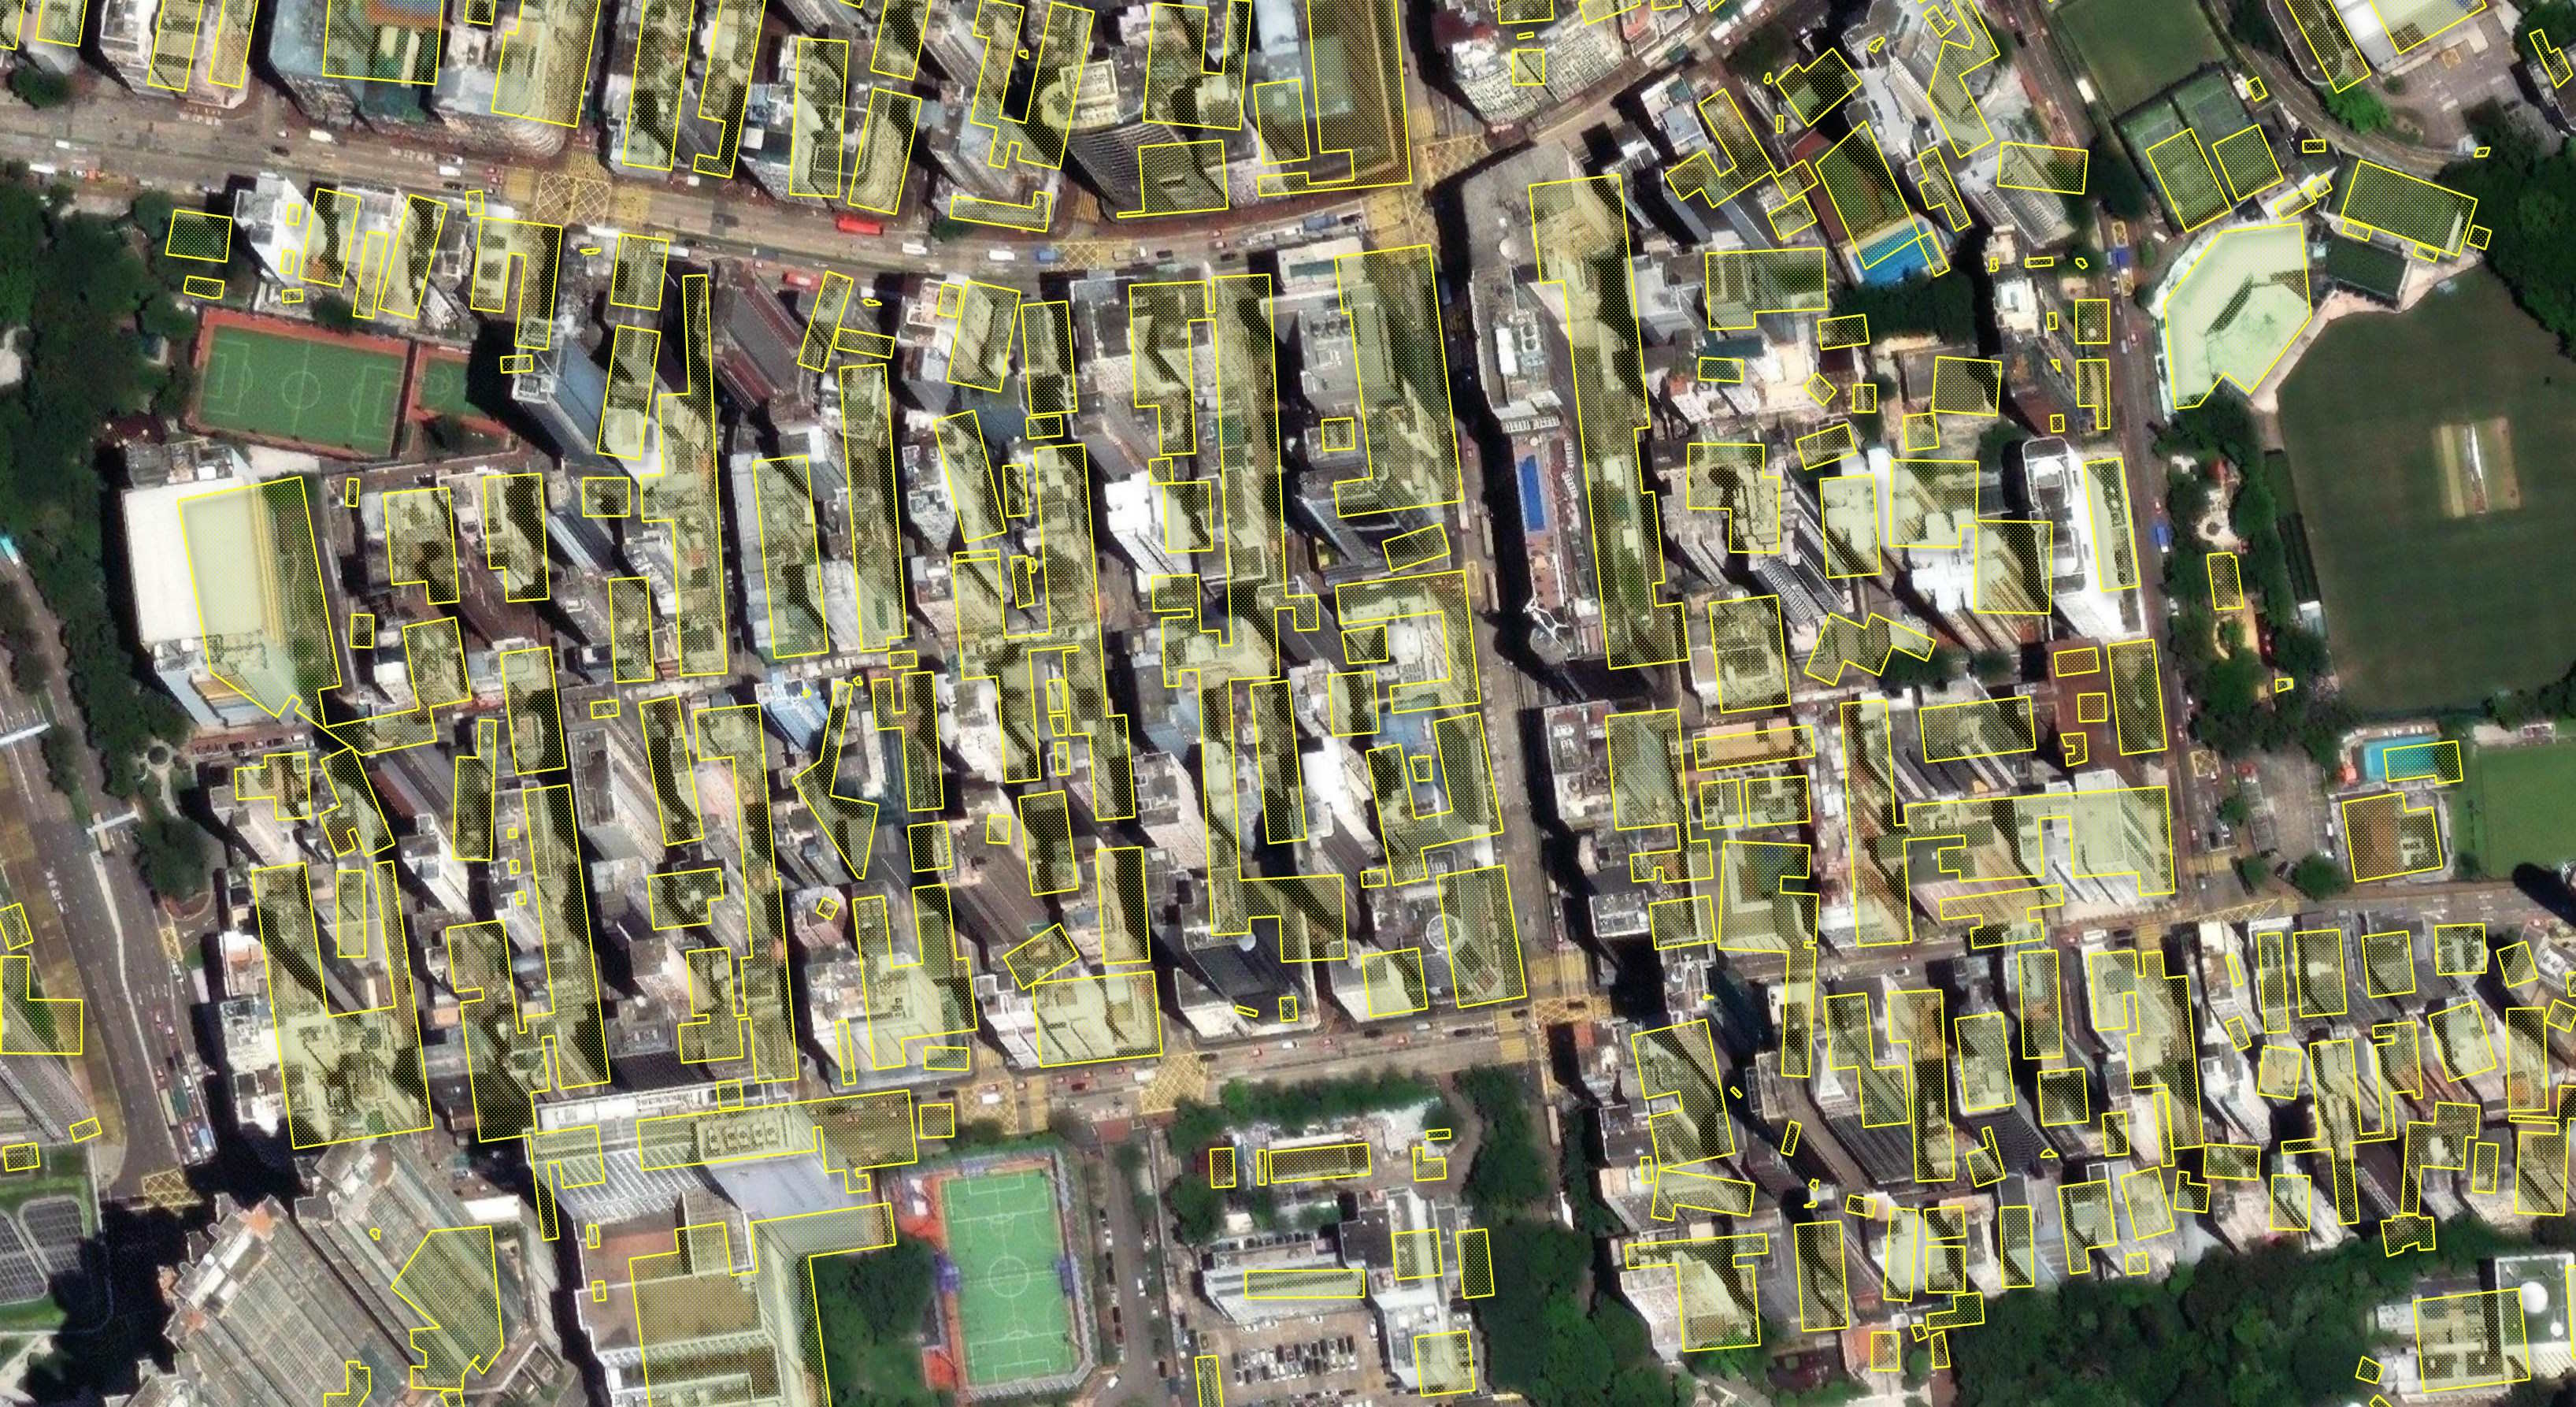
It looks like there was some effort to build orthographic polygons on top of the tall buildings along Nathan Road in Hong Kong.
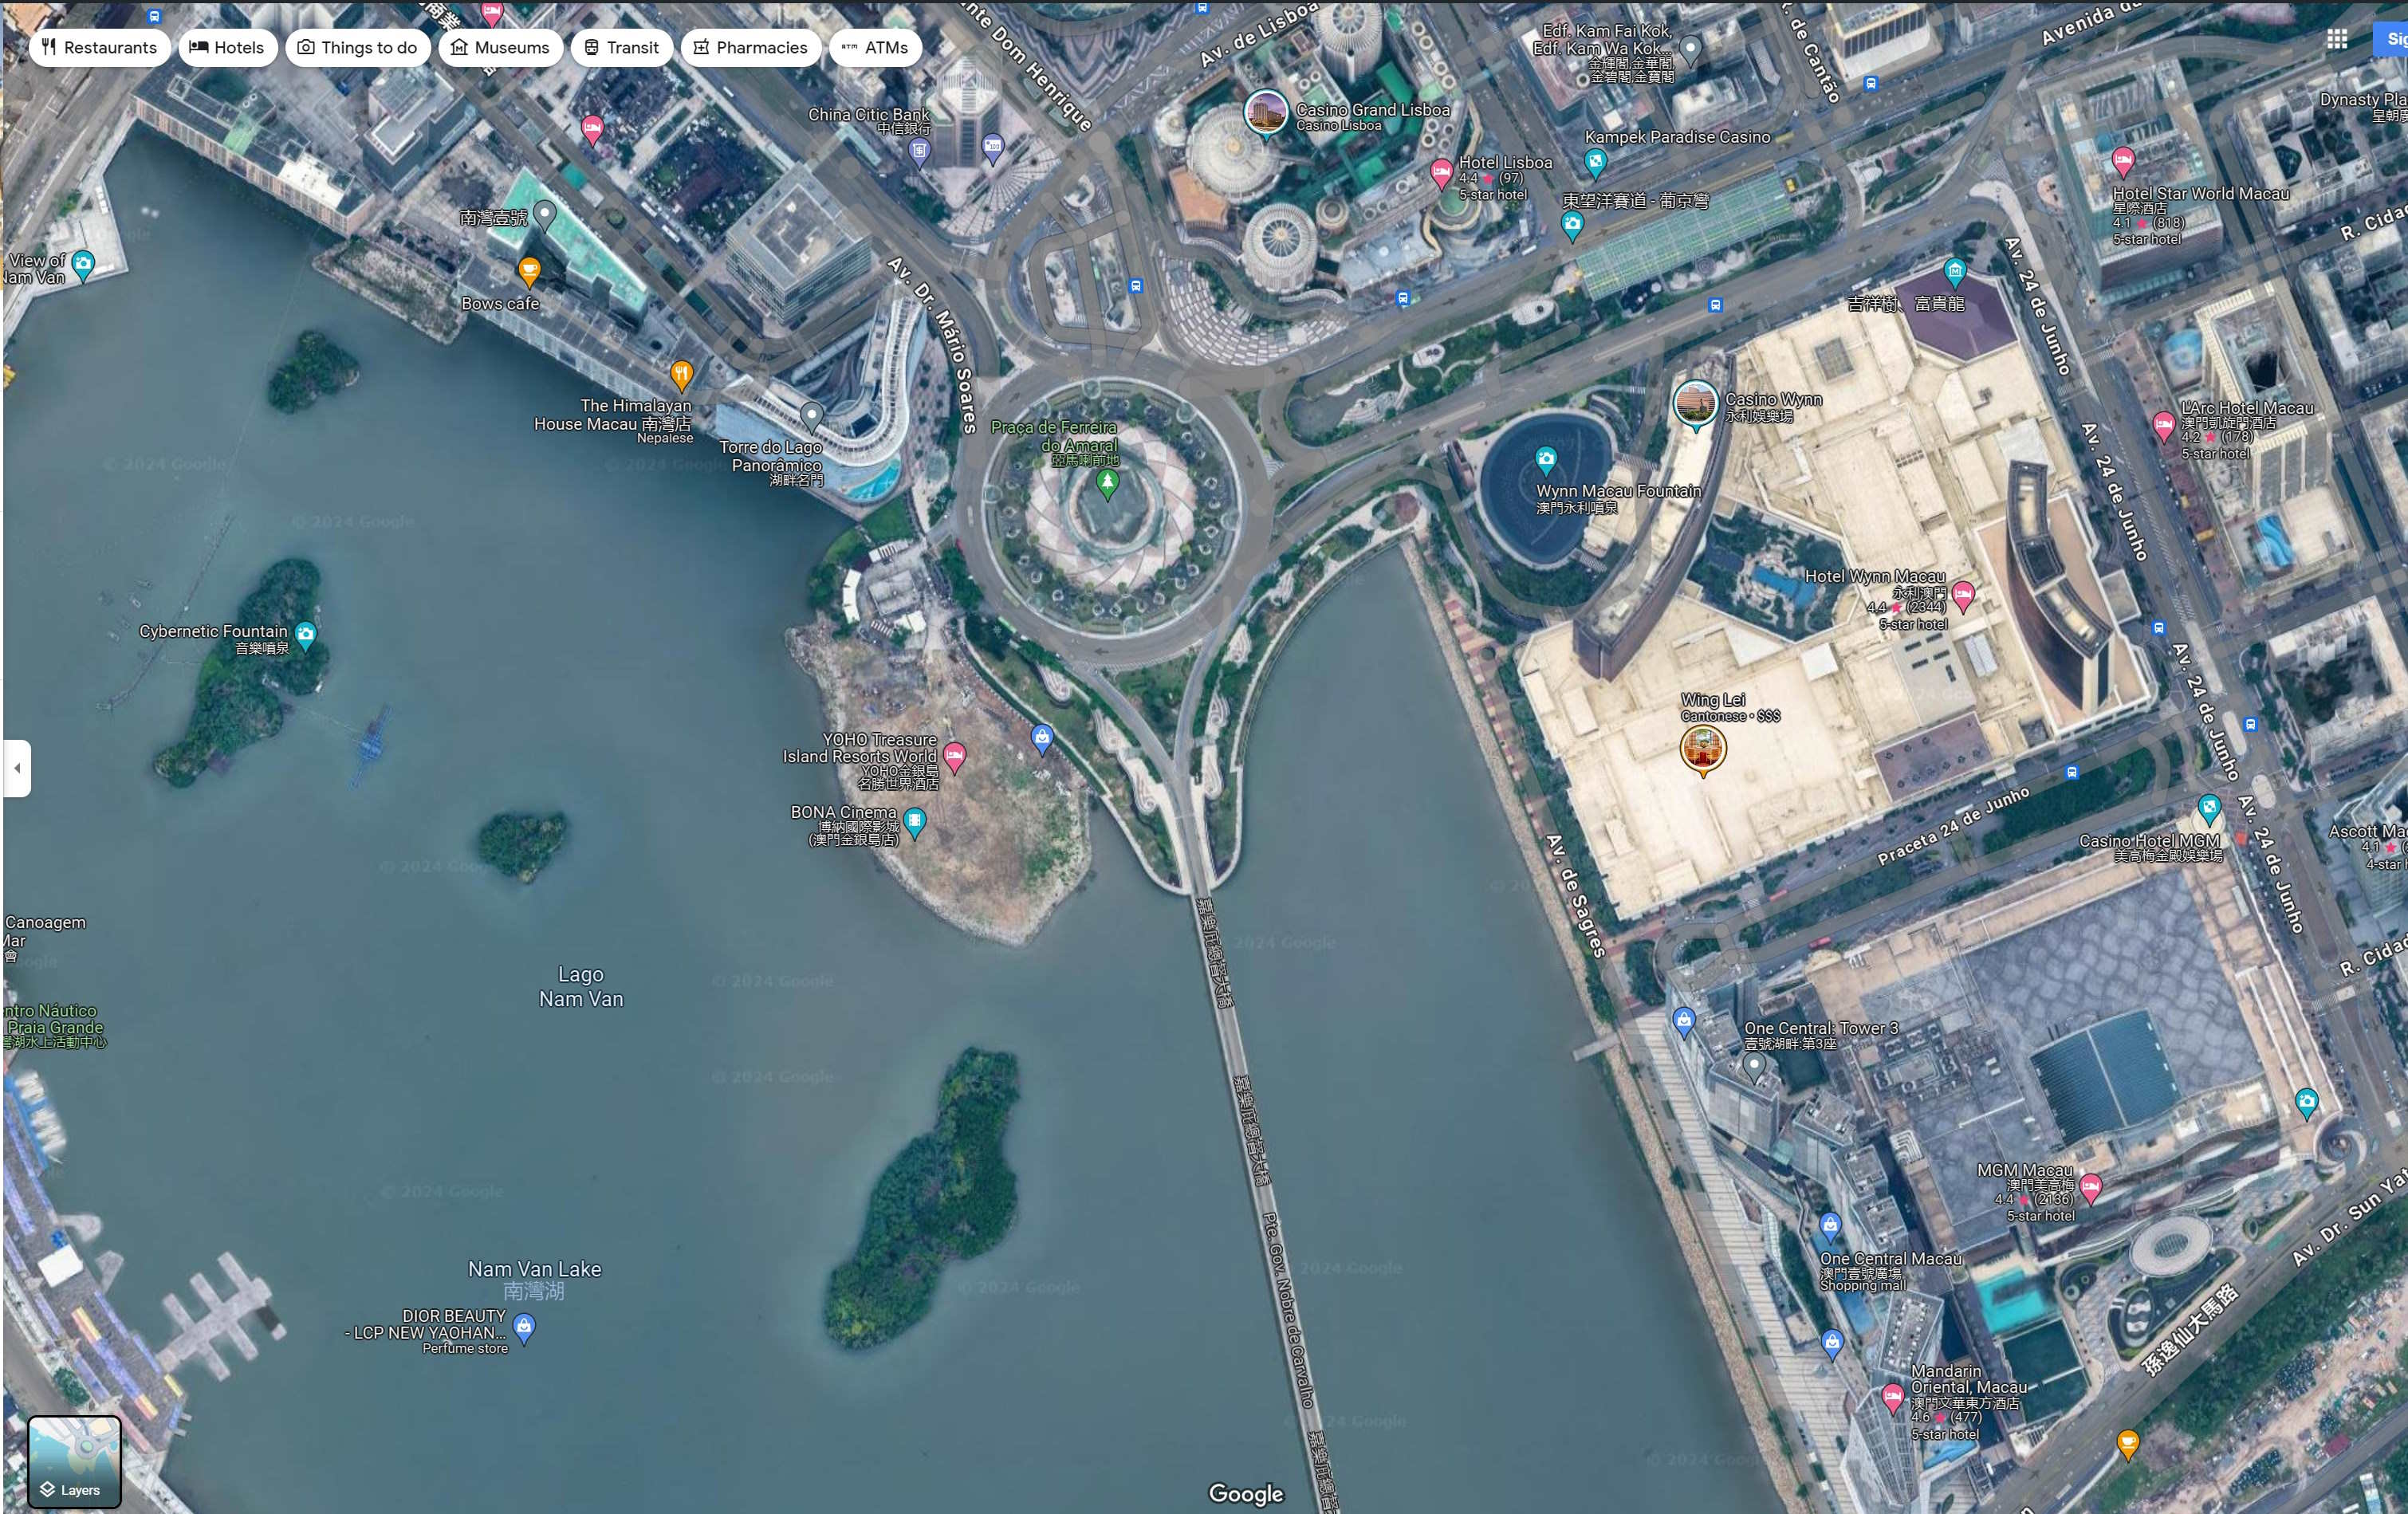
At first glance, I thought the model missing a massive building here in Macau. The underlying basemap is from Esri.
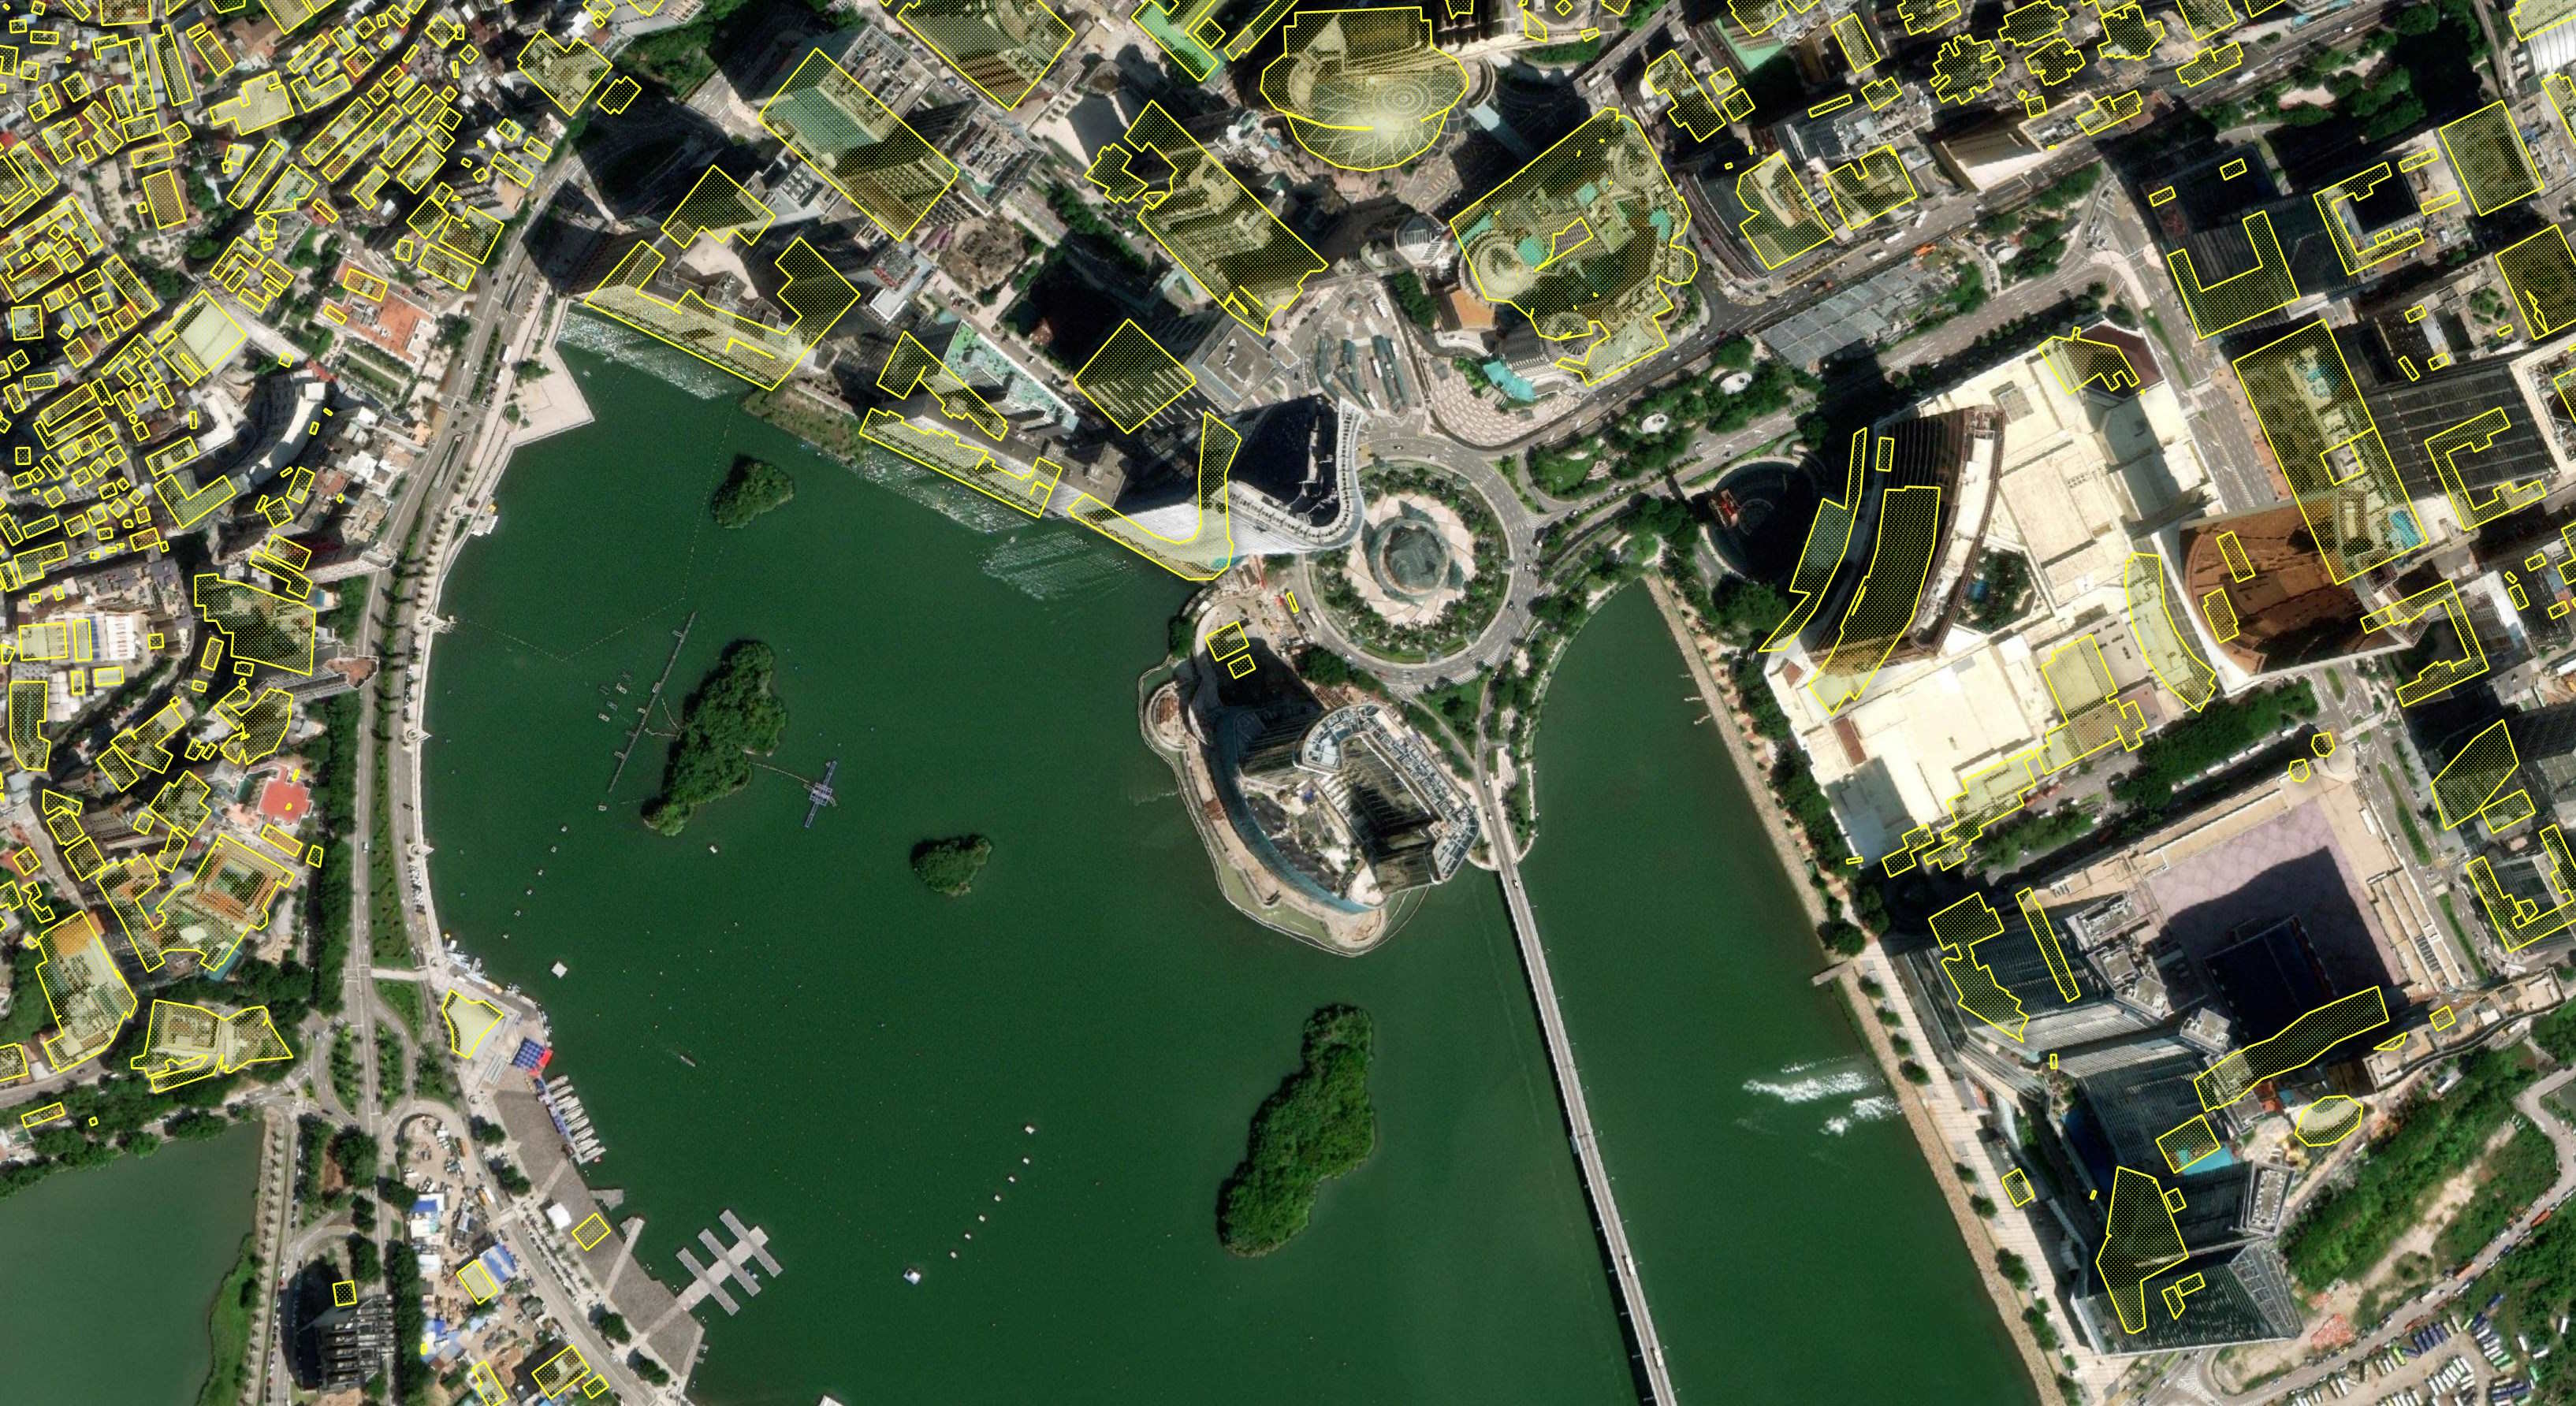
I found some imagery from this year from Maxar on Google's Maps for the area and it's a building site now.
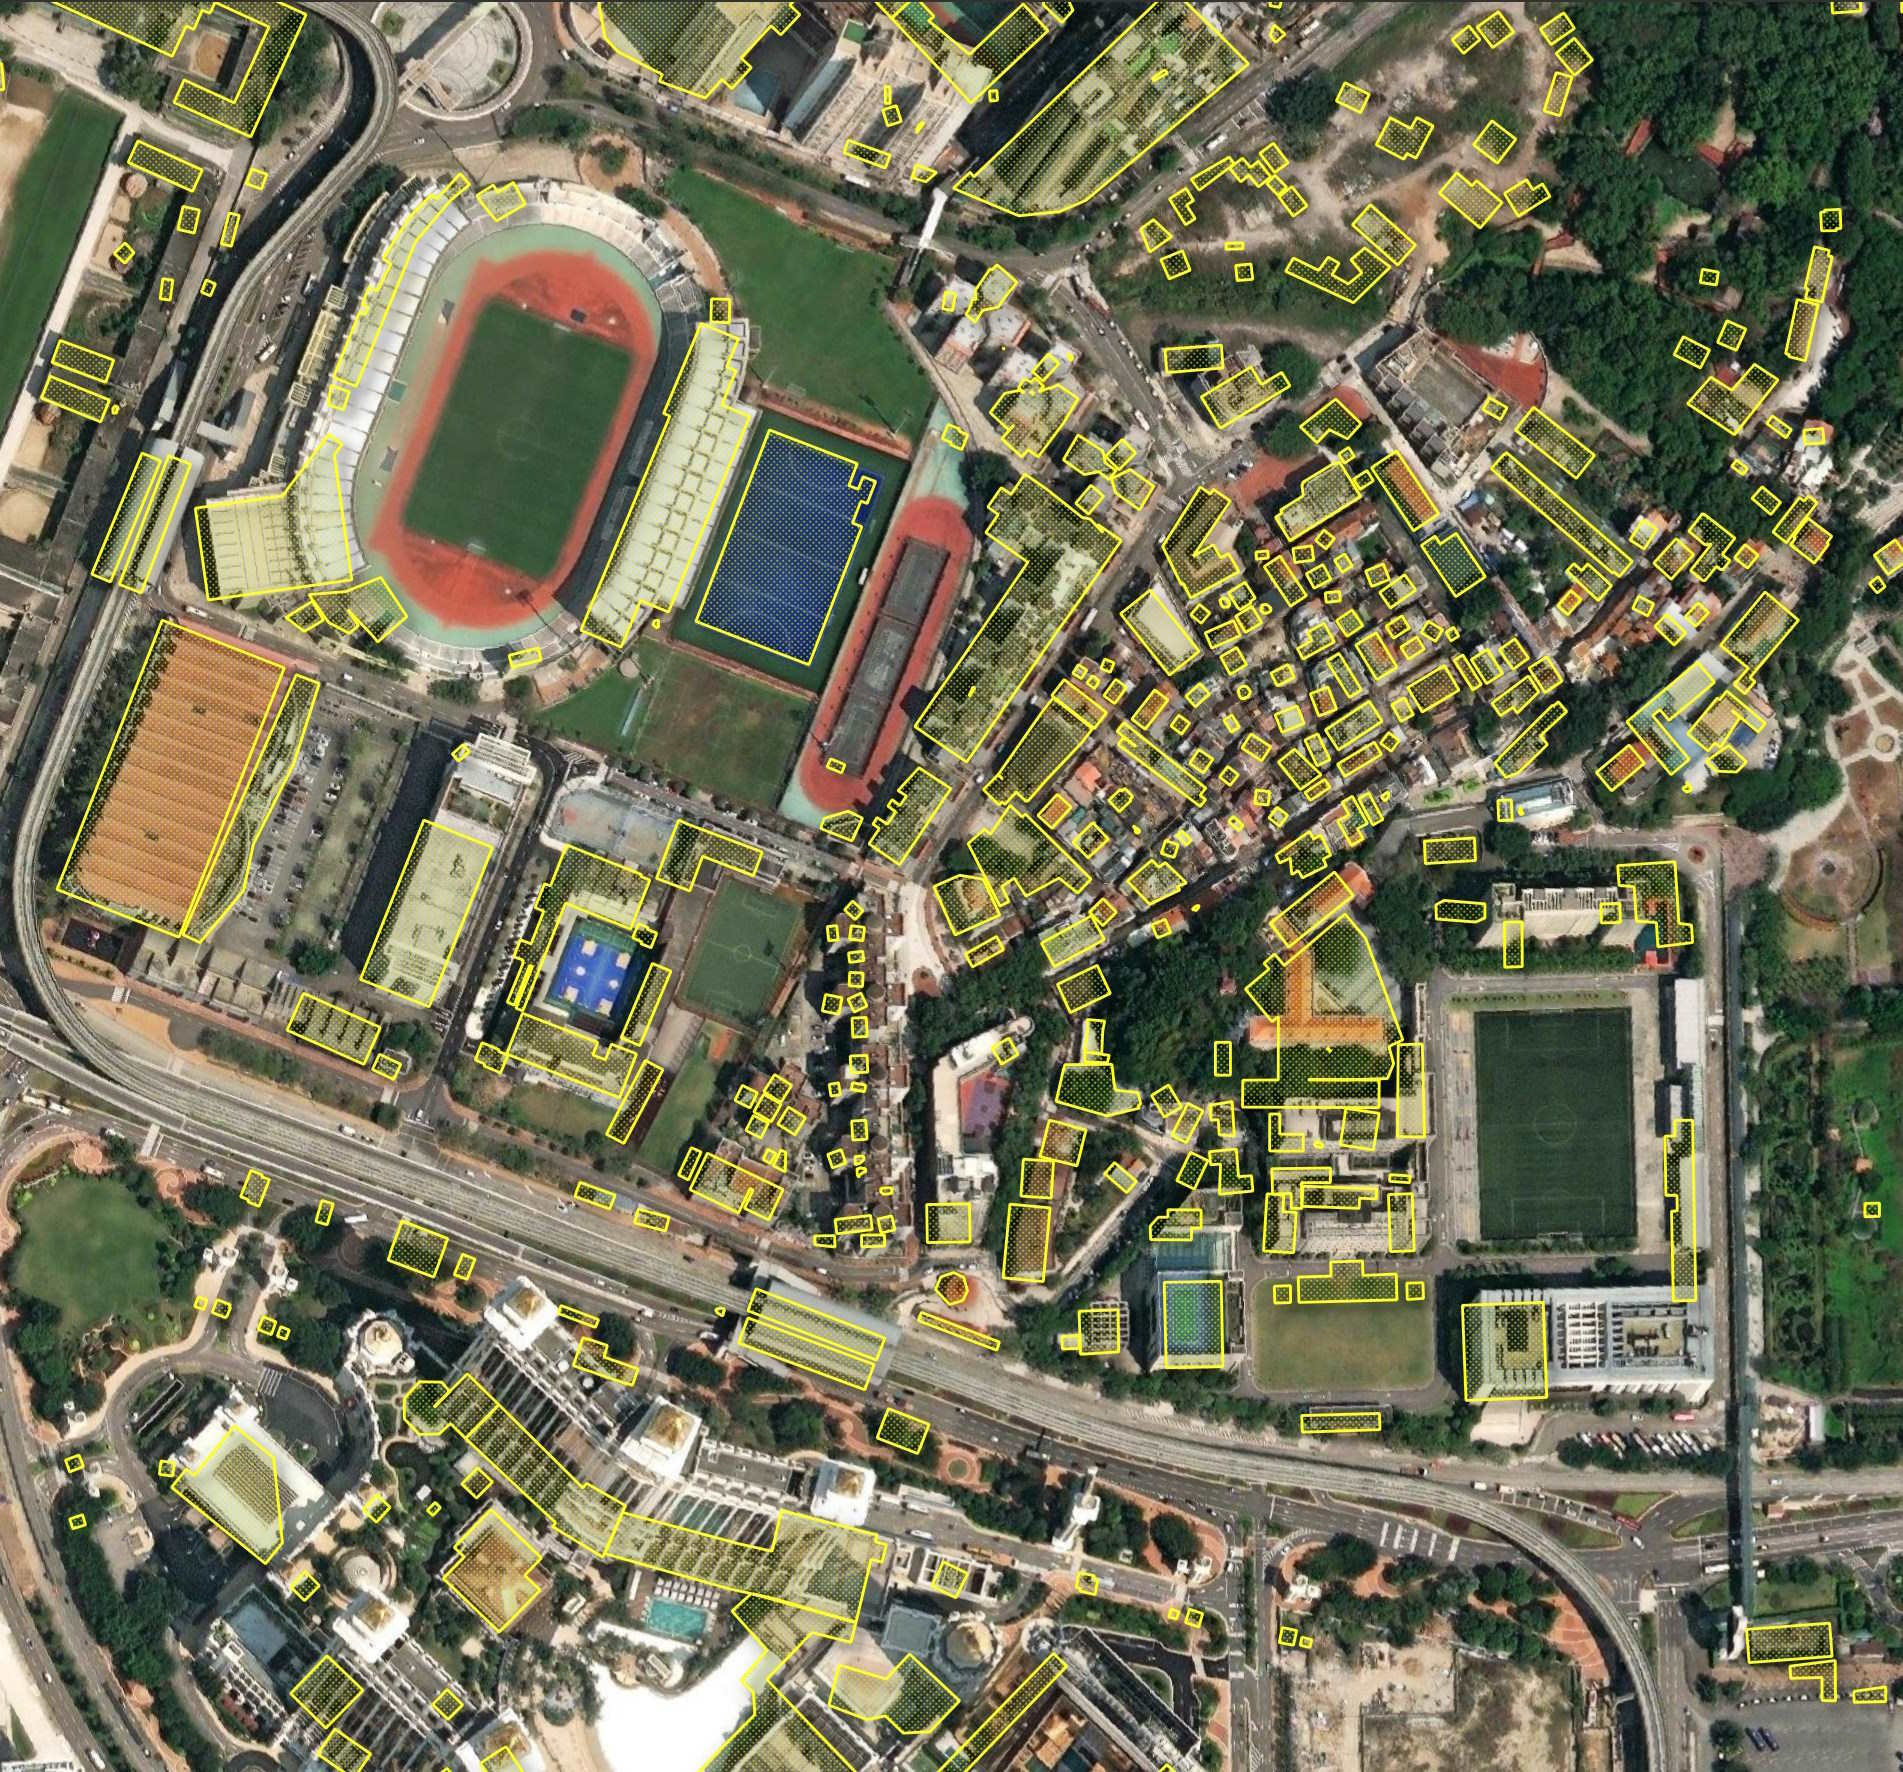
Some sports pitches in Macau are highlighted individually as buildings while others aren't.
North Korea is surprisingly well covered in OSM already but the coverage in this dataset looks even more impressive.
Pyongyang's General Hospital wasn't highlighted for some reason. The monument across the street was highlighted as a building though.
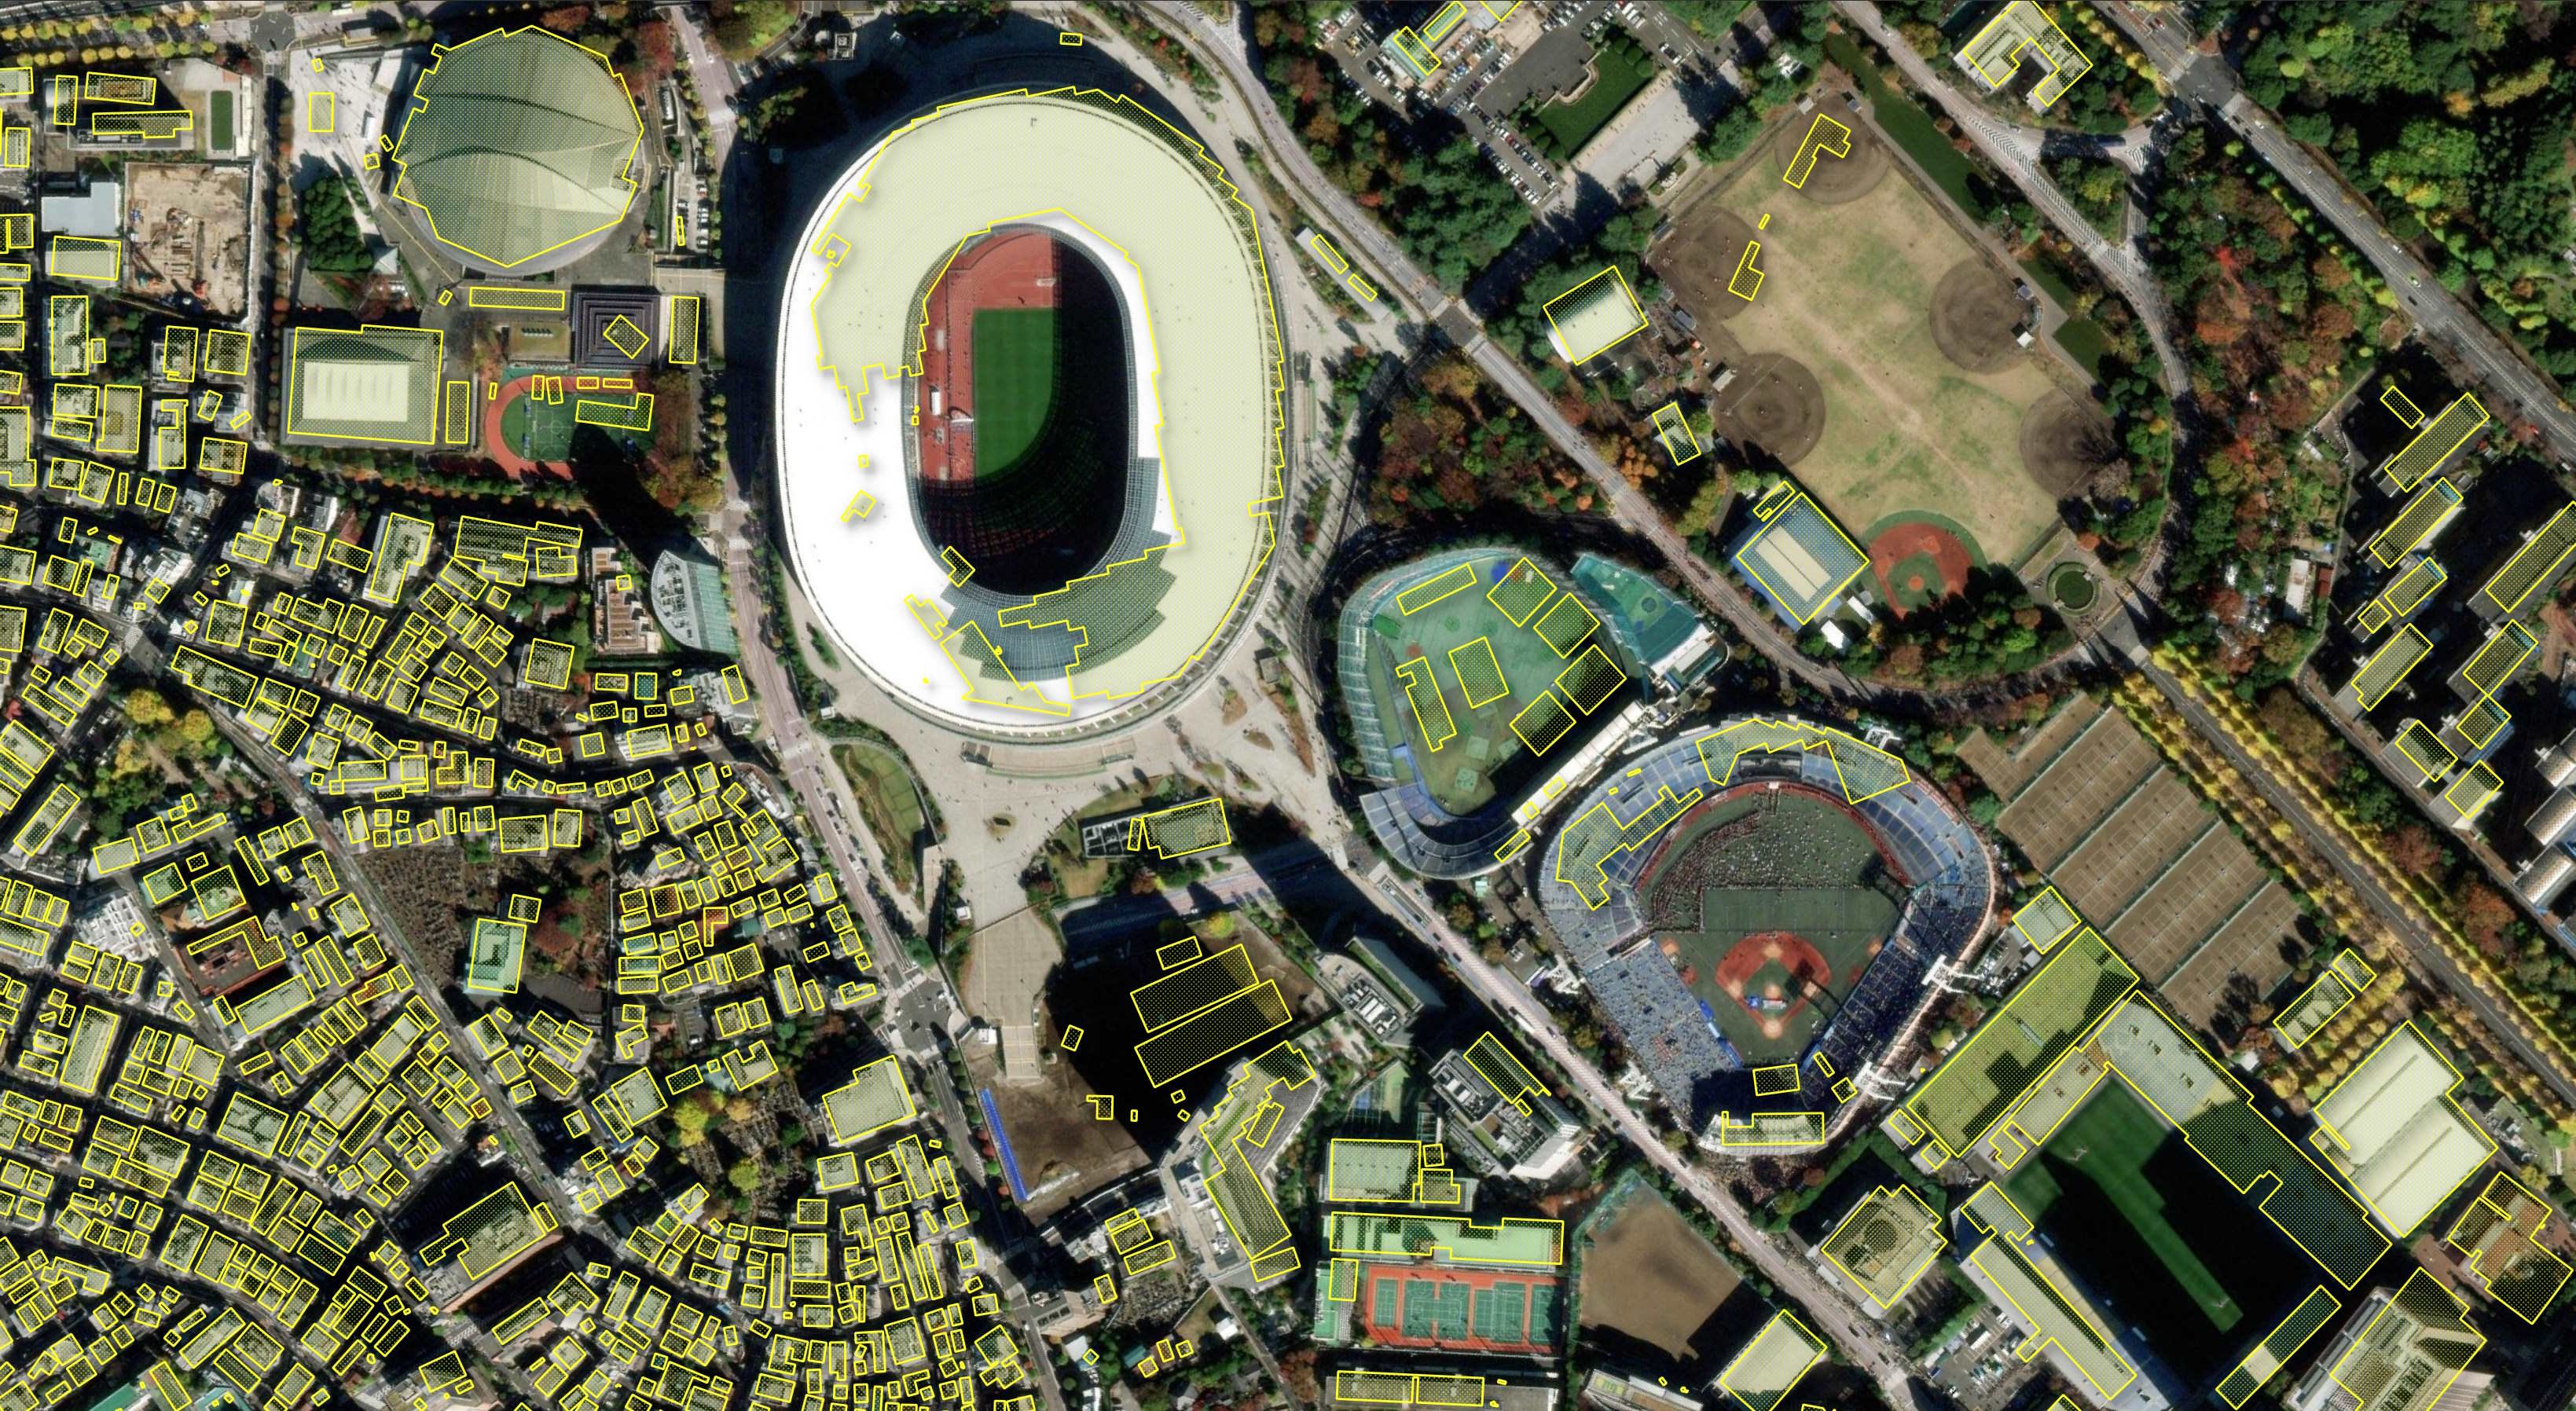
The sports stadiums in Tokyo seem to have thrown the model off.
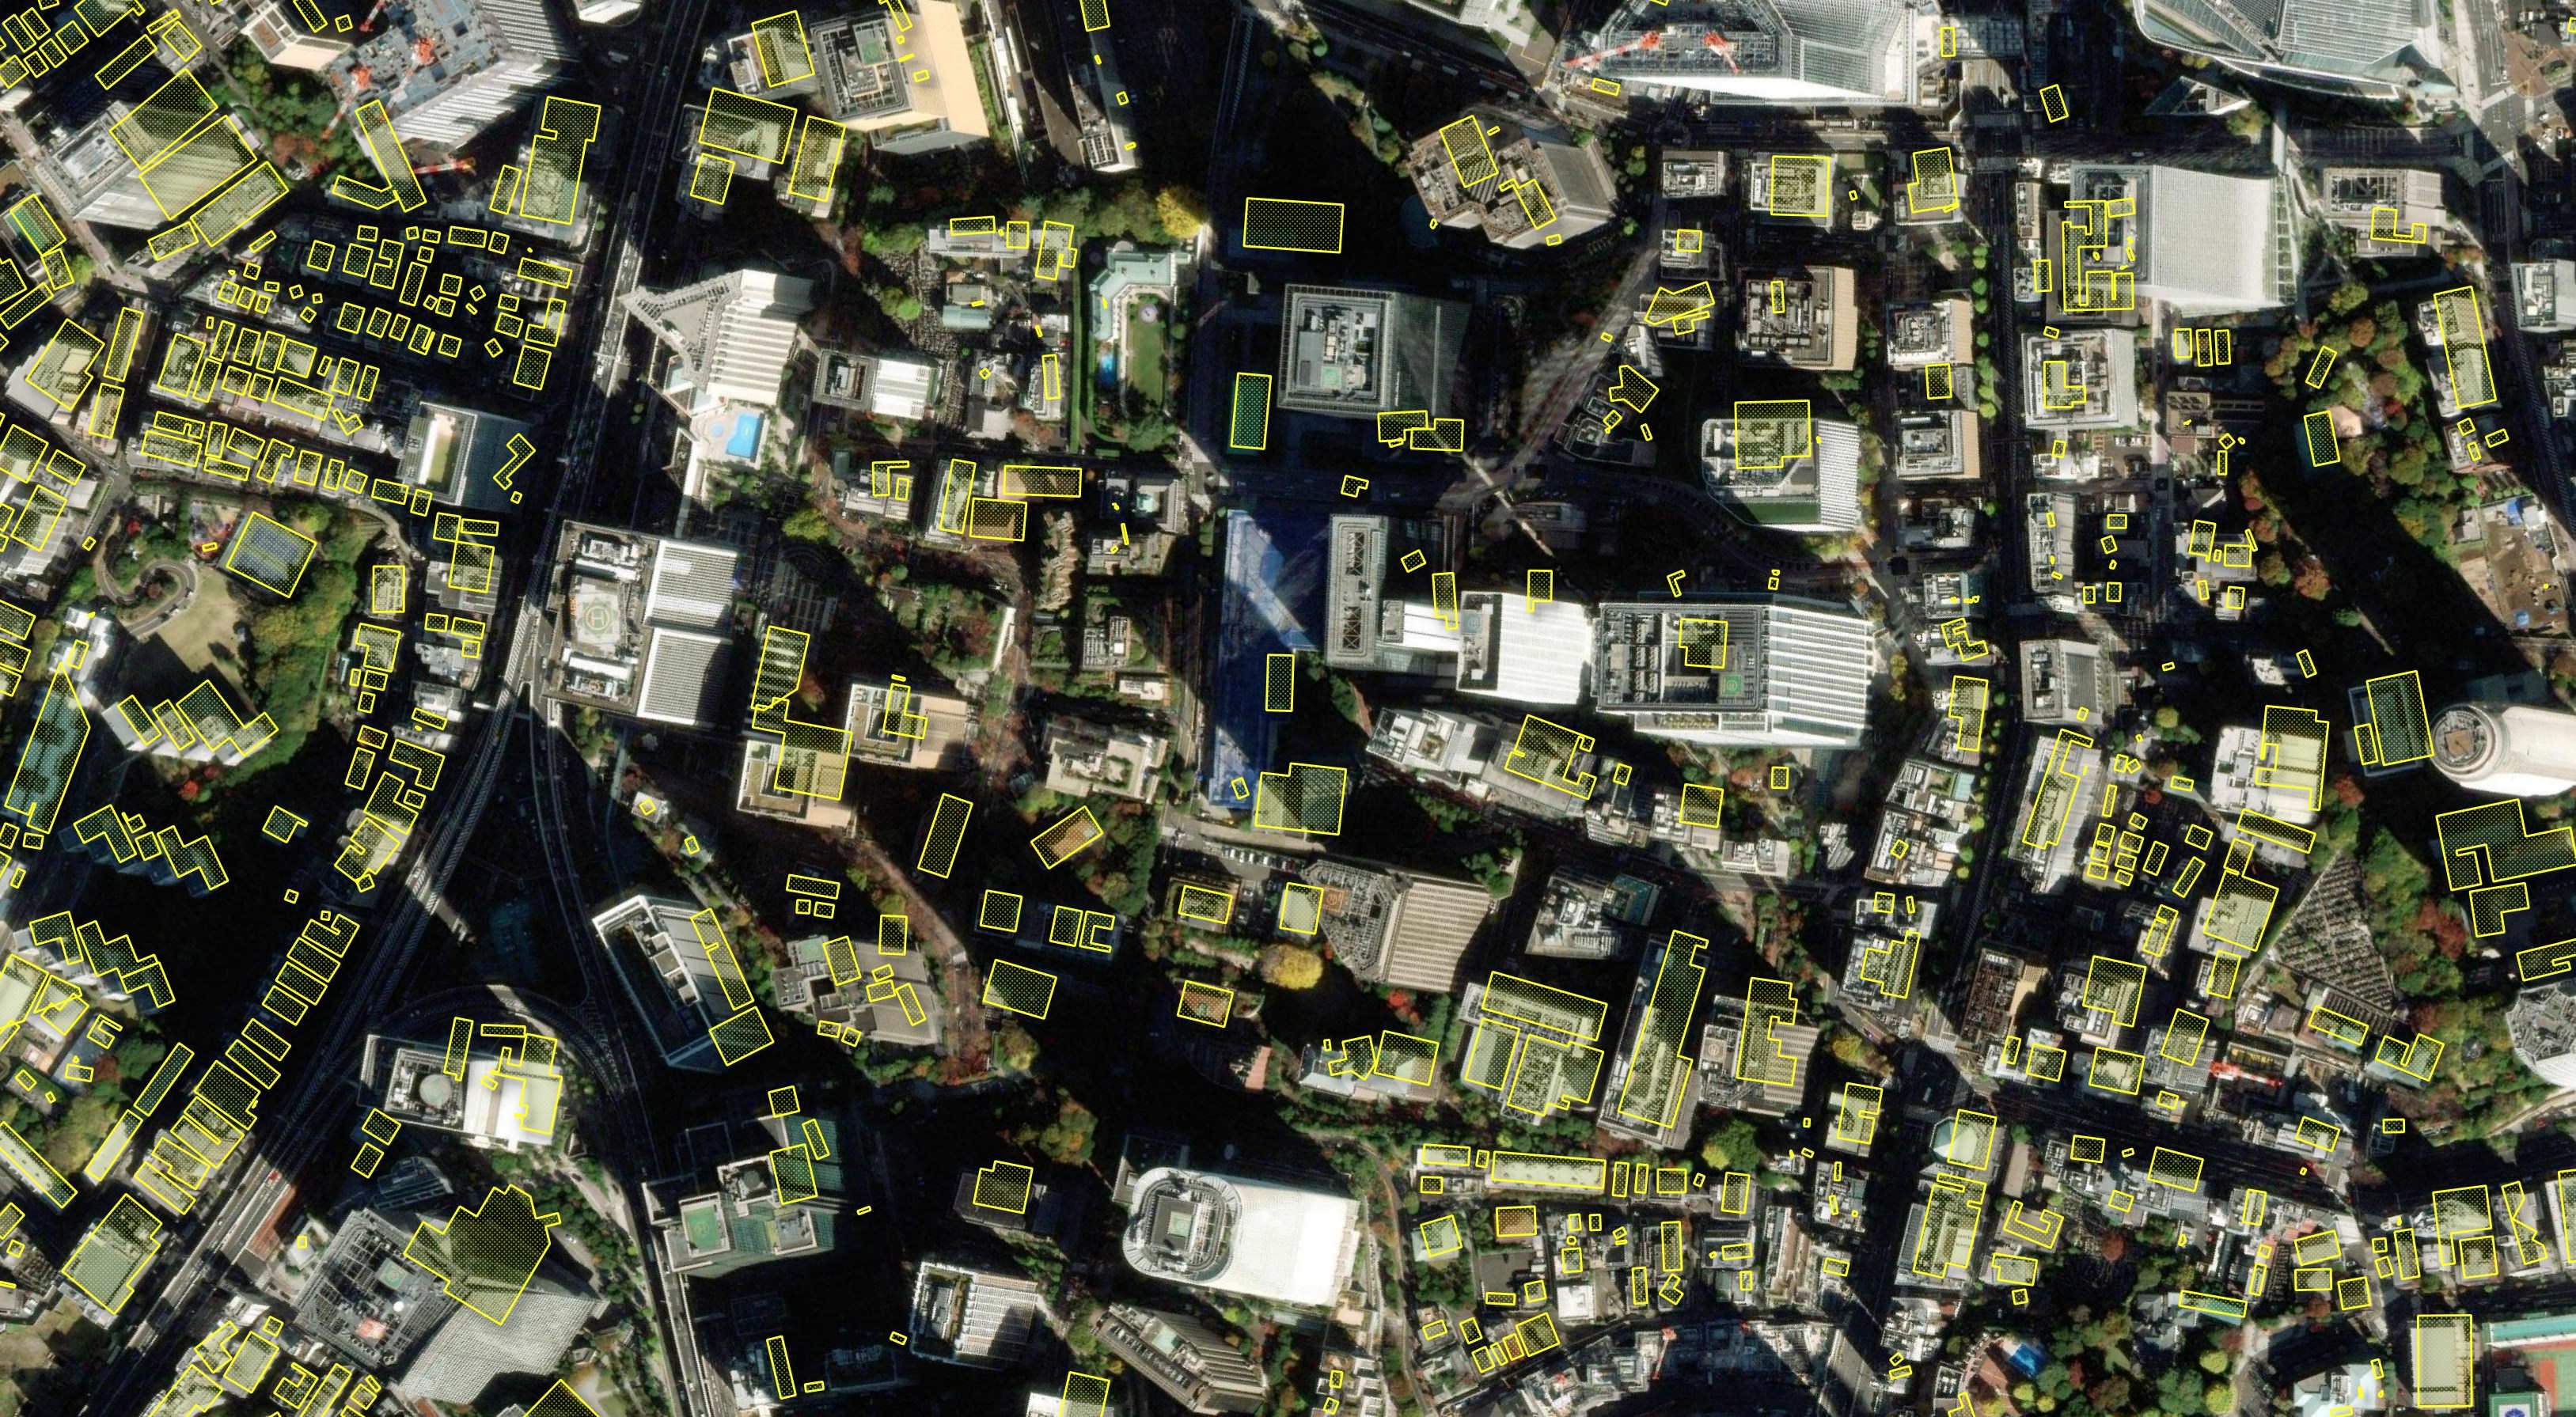
The tall buildings in Central Tokyo also seem to confuse the model.
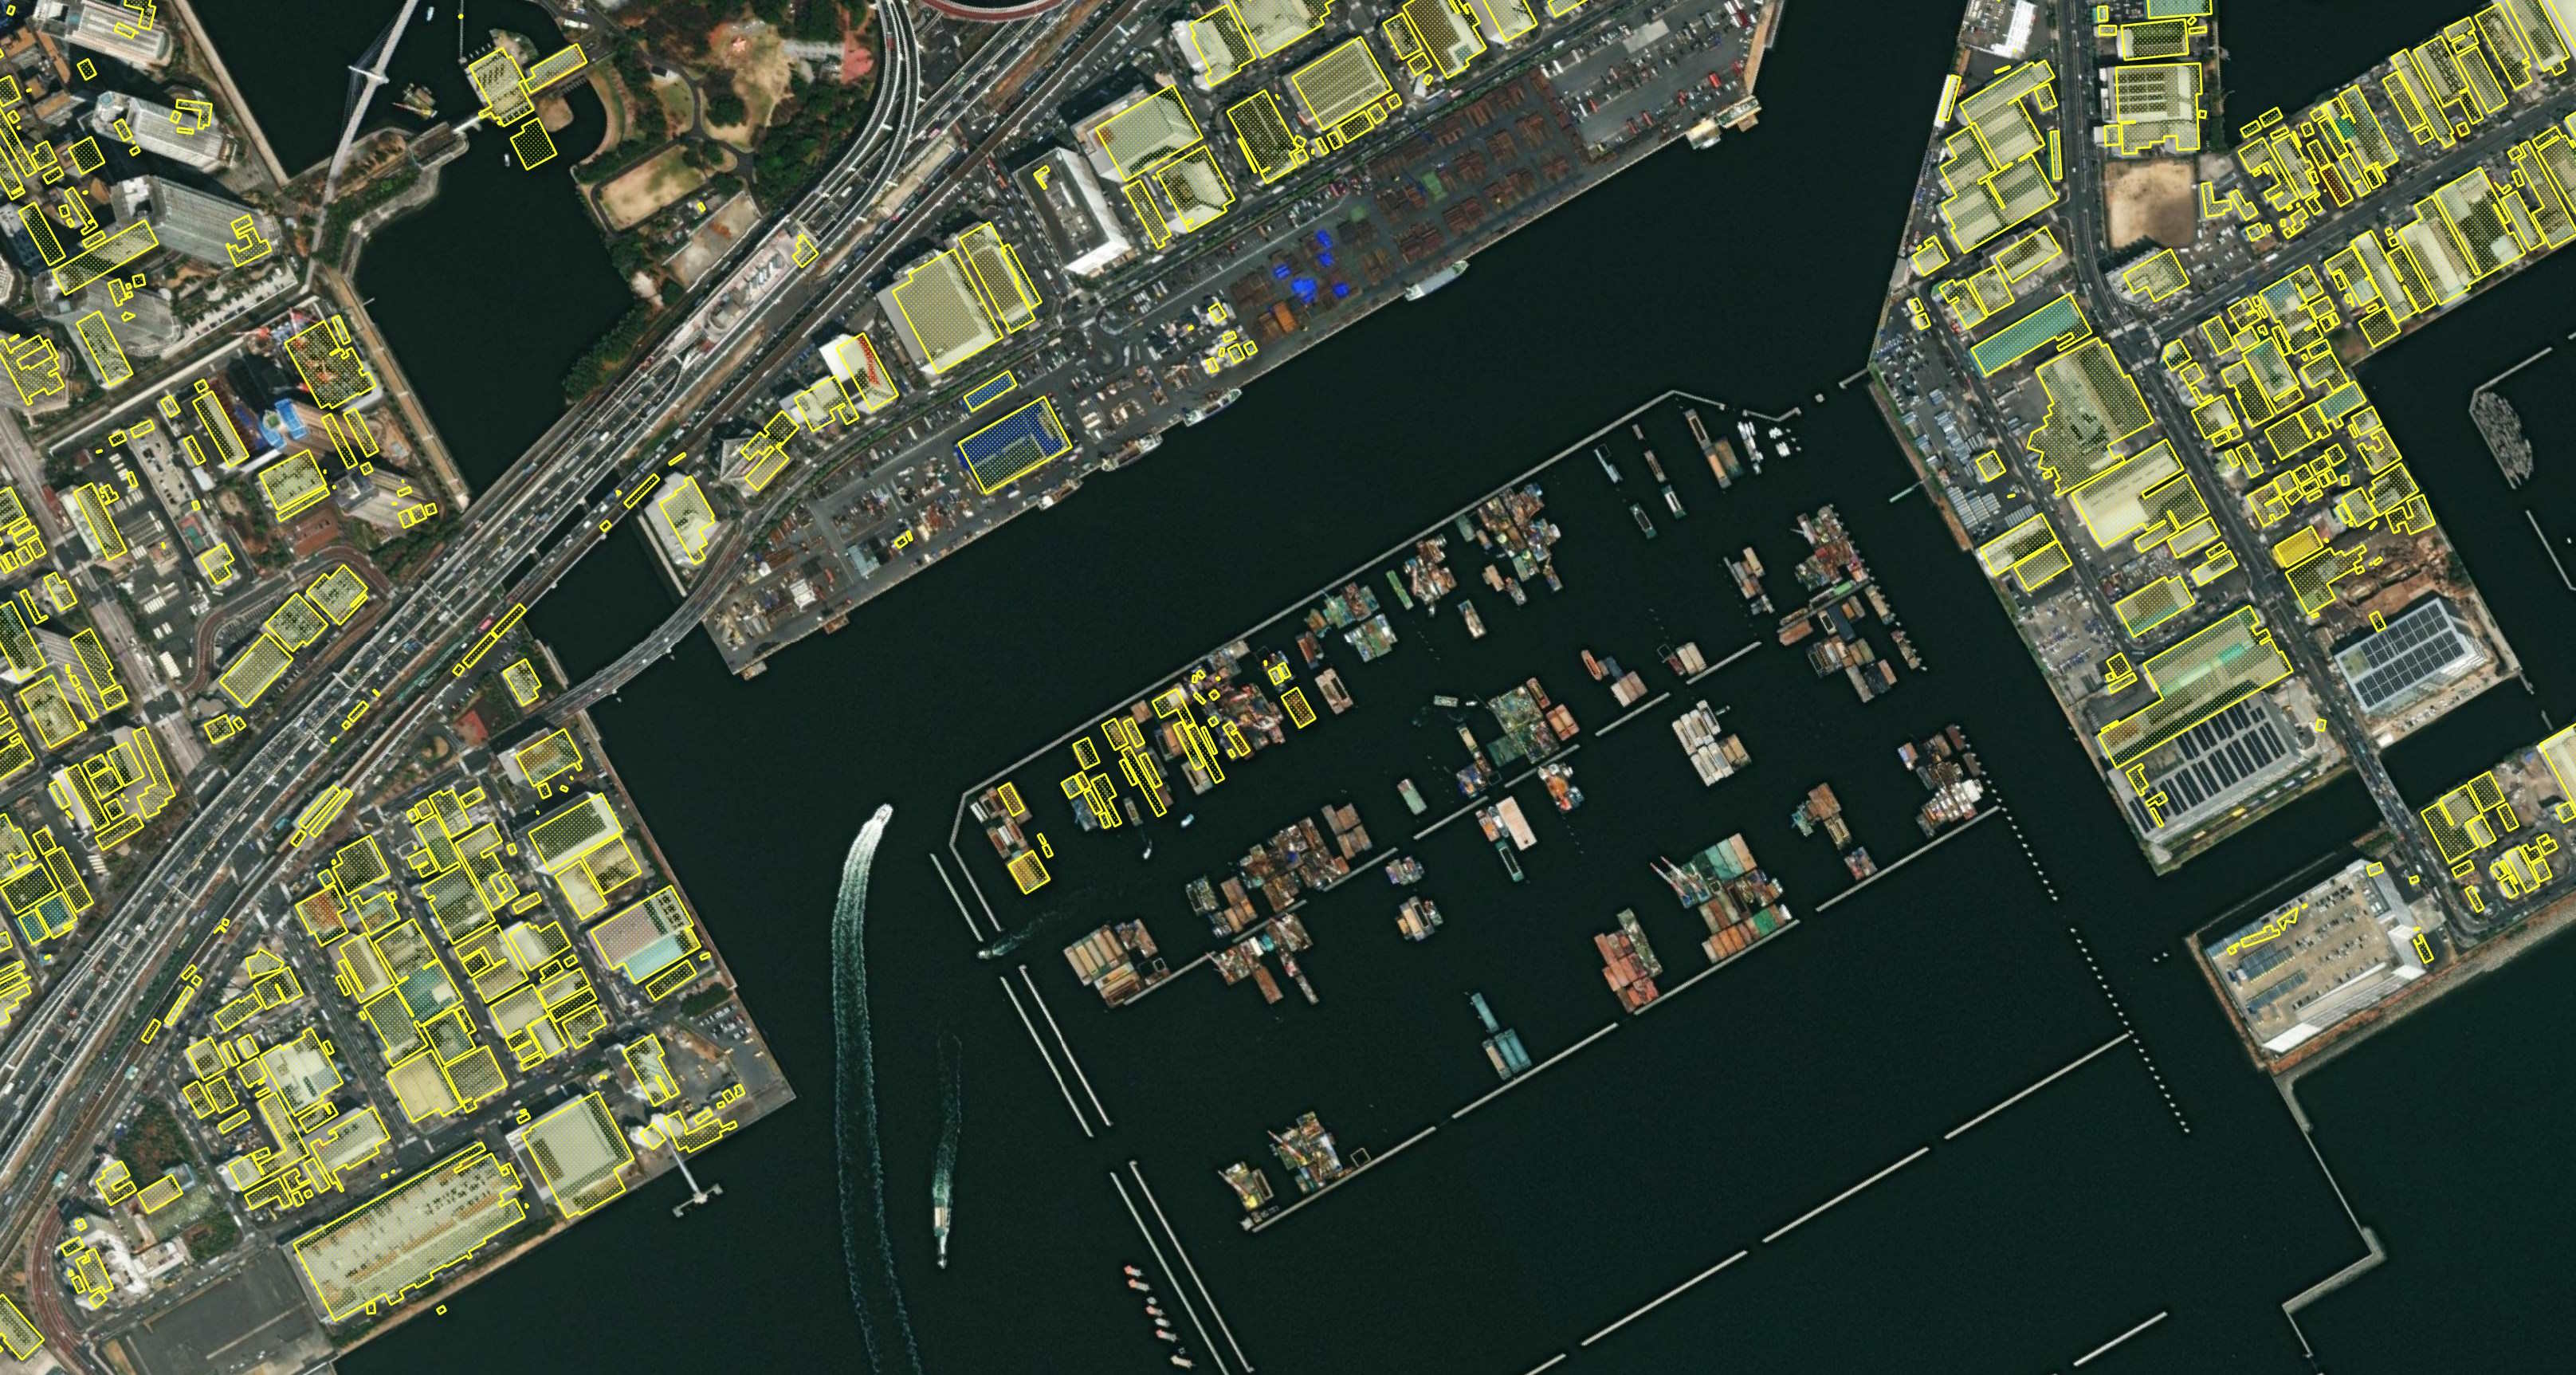
While not perfect, the model did a good job of not confusing too many shipping containers for buildings.
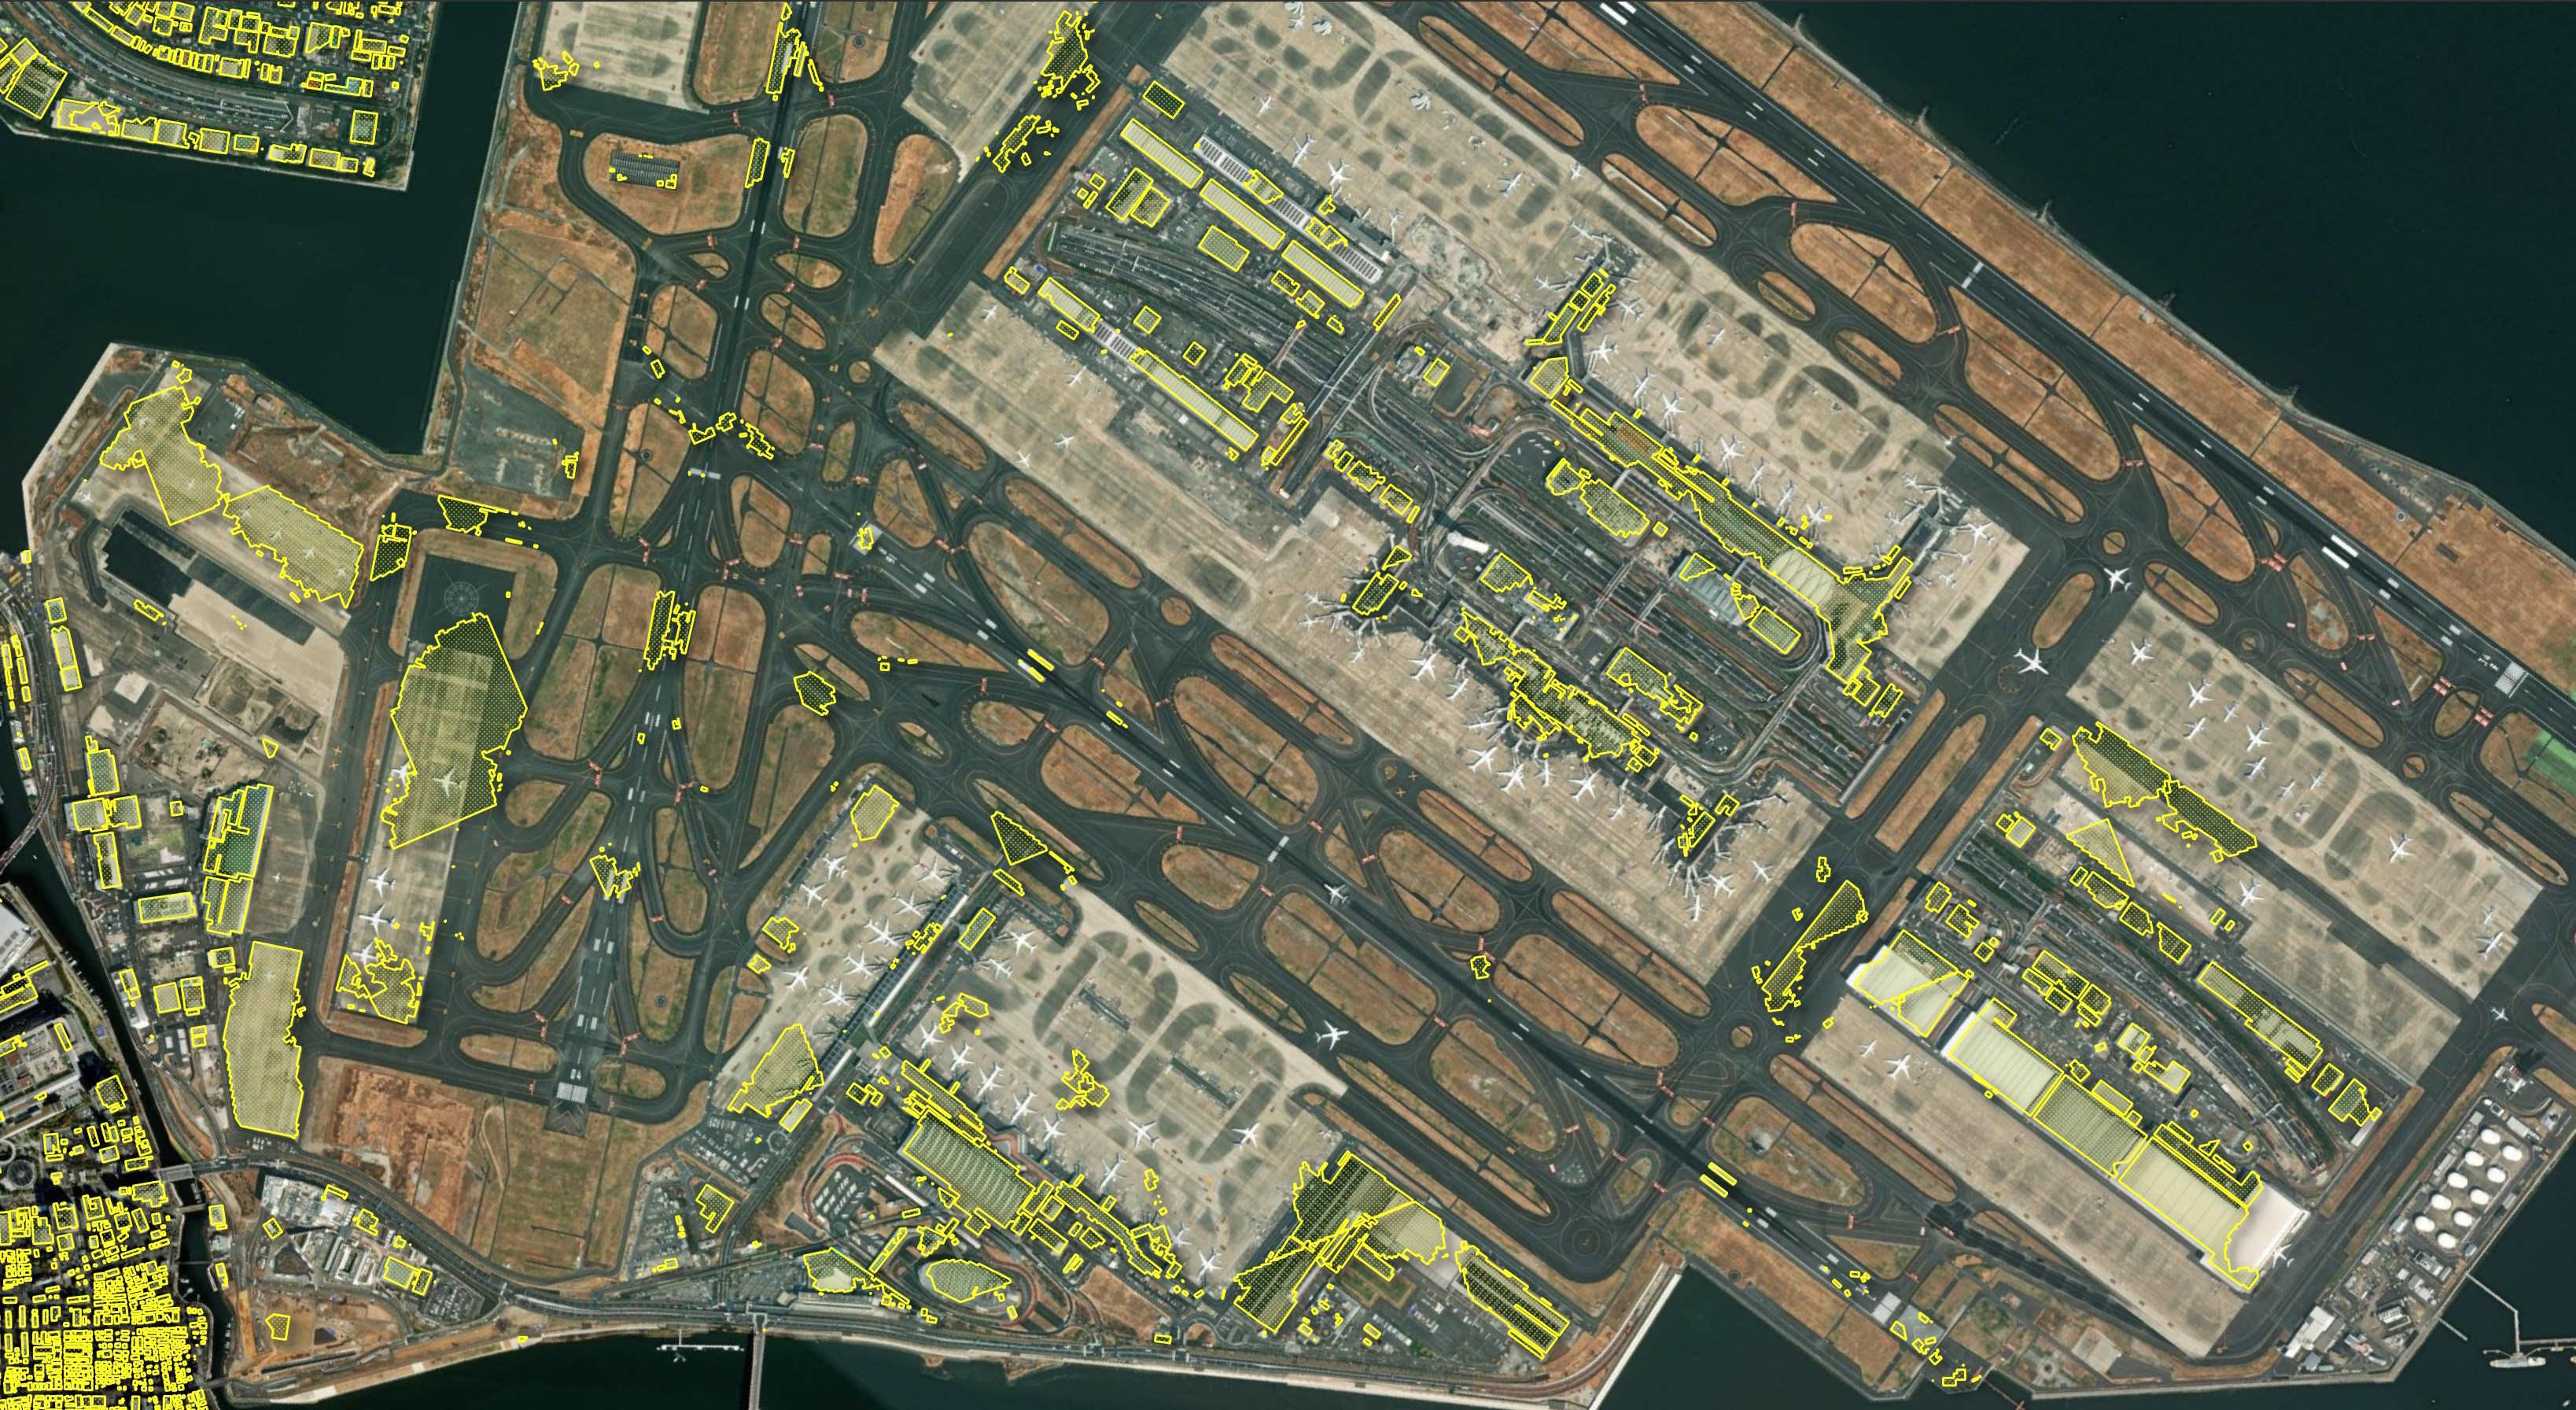
Haneda Airport seems to have many of the issues seen with the other Airports in this dataset.
I suspect a major motivation for building this dataset was a lack of high-quality, Chinese Mainland vector datasets. The building detection work around the Forbidden City was genuinely impressive.
With that said, it would be good to see another iteration of this model with data from countries like Japan that do have large and descriptive GIS datasets freely available feeding back into the development process.