Umbra Space is a 9-year-old manufacturer and operator of a Synthetic Aperture Radar (SAR) satellite fleet. These satellites can see through clouds, smoke and rain and can capture images day or night at resolutions as fine as 16cm. SpaceX launched Umbra's first satellite in 2021 and has a total of eight in orbit at the moment. I covered their fleet and open data programme in my Umbra's Open Satellite Feed post I published in April.
A few weeks ago, Umbra released almost 1,000 satellite images displaying ships around the world. The images have been made available in a number of SAR image formats and total almost 7.5 TB in size.
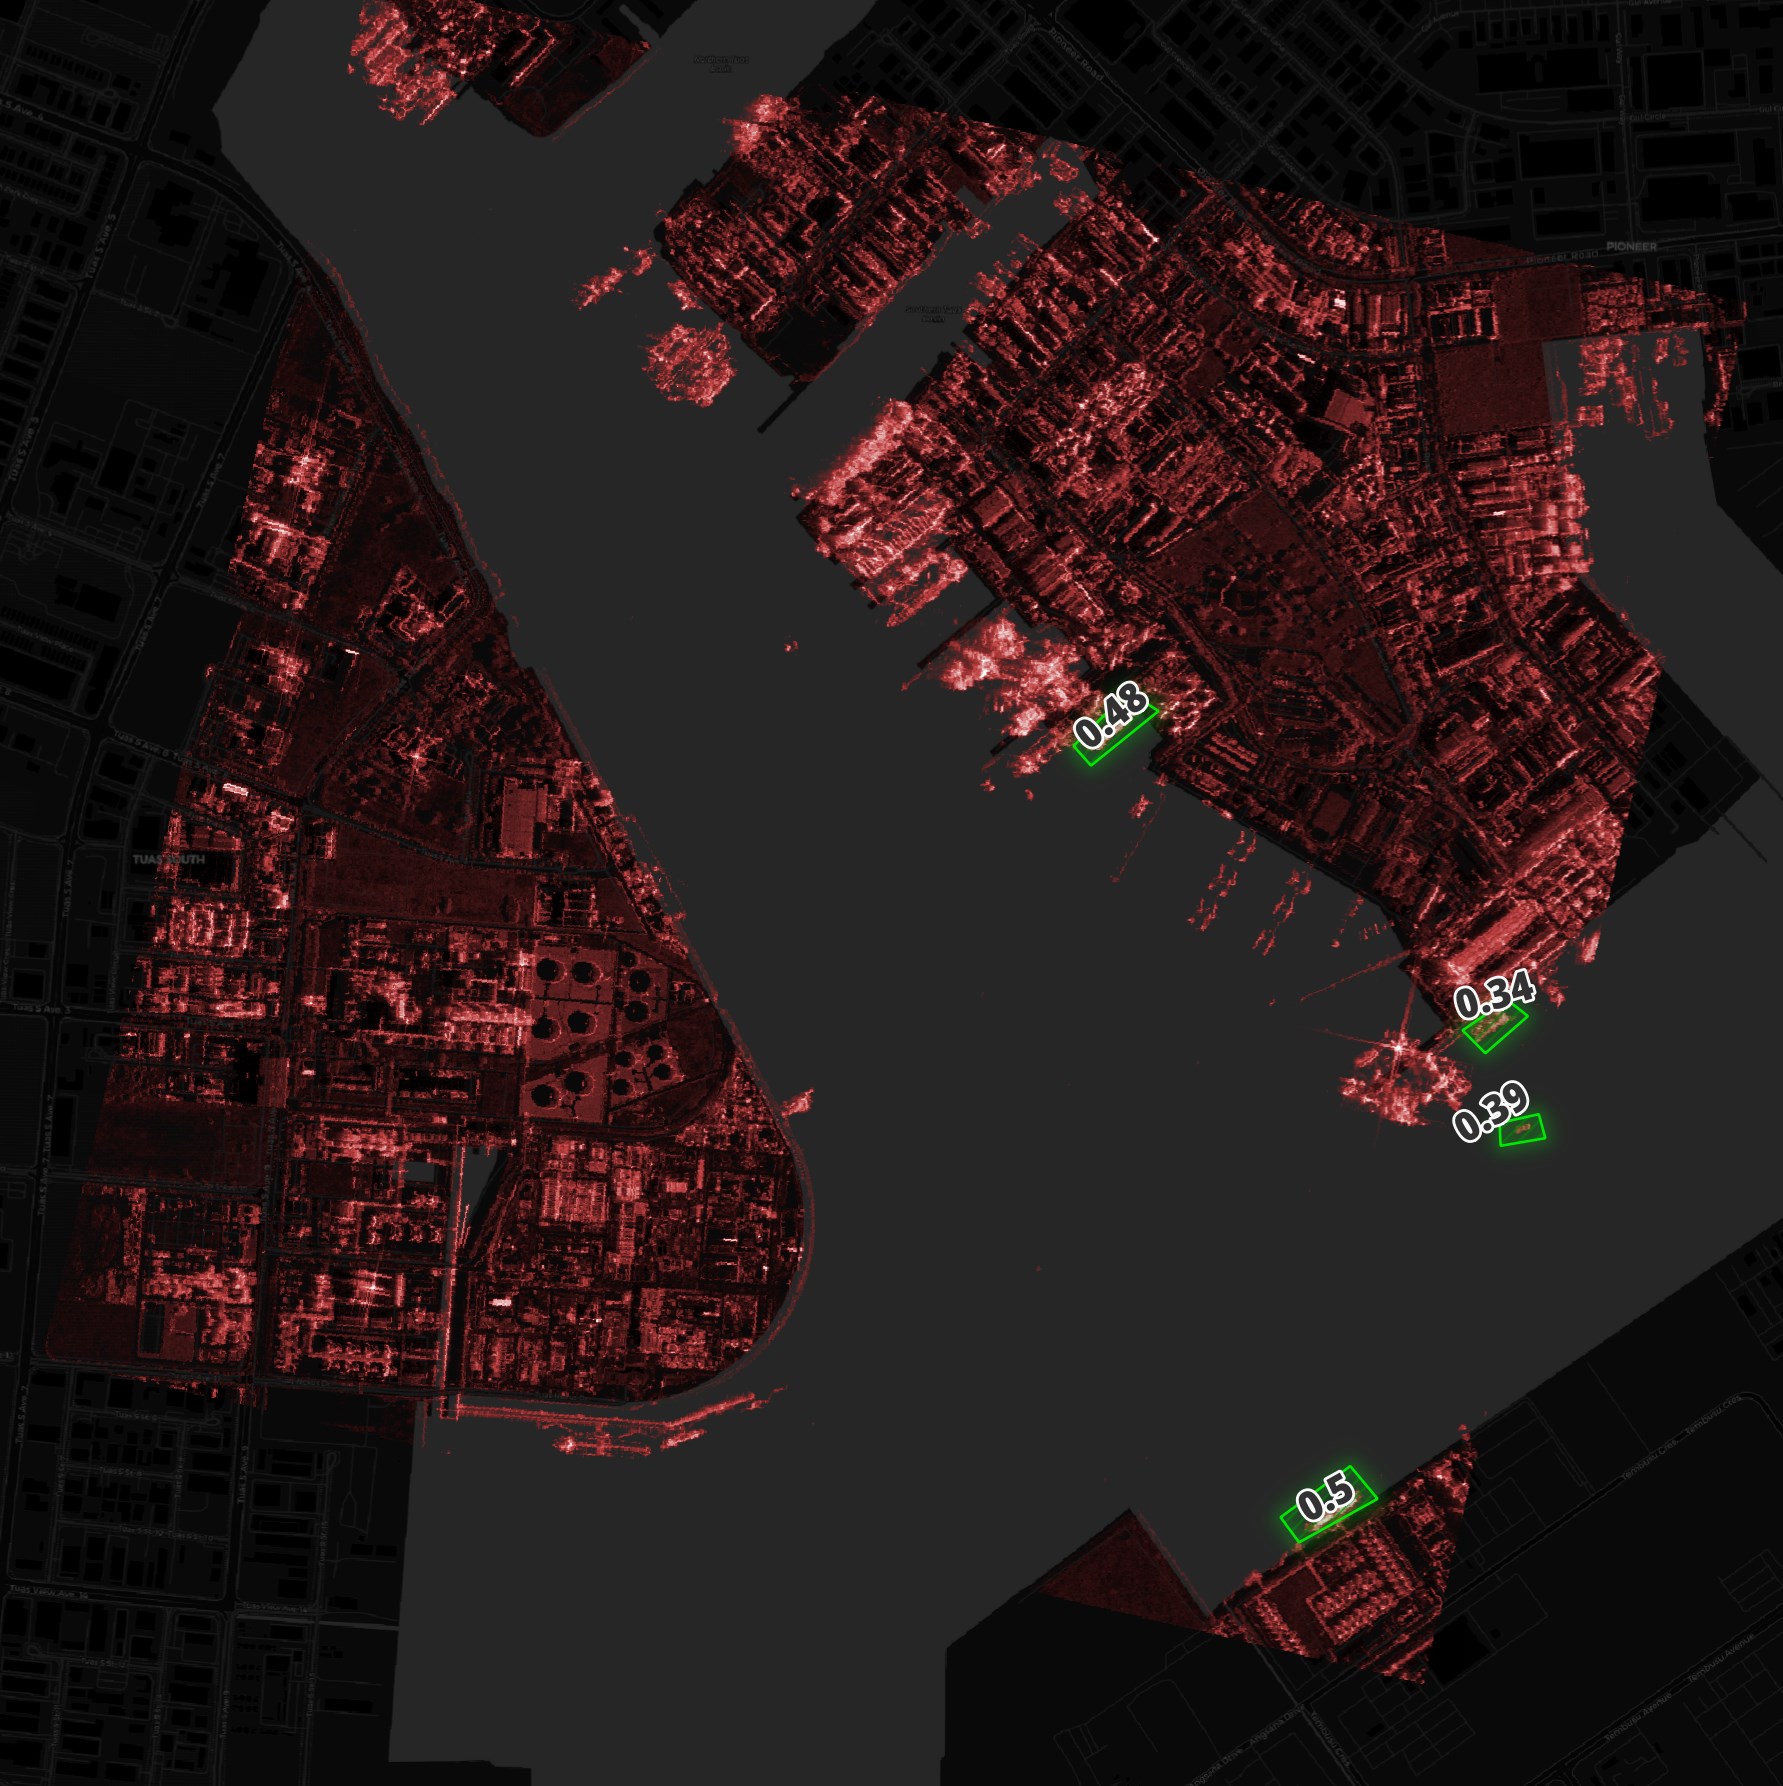
Below I've annotated one of the images from this dataset. I've used QGIS to tint the satellite imagery red, highlighted a few ships in green and used CARTO's dark basemap for geographical reference.
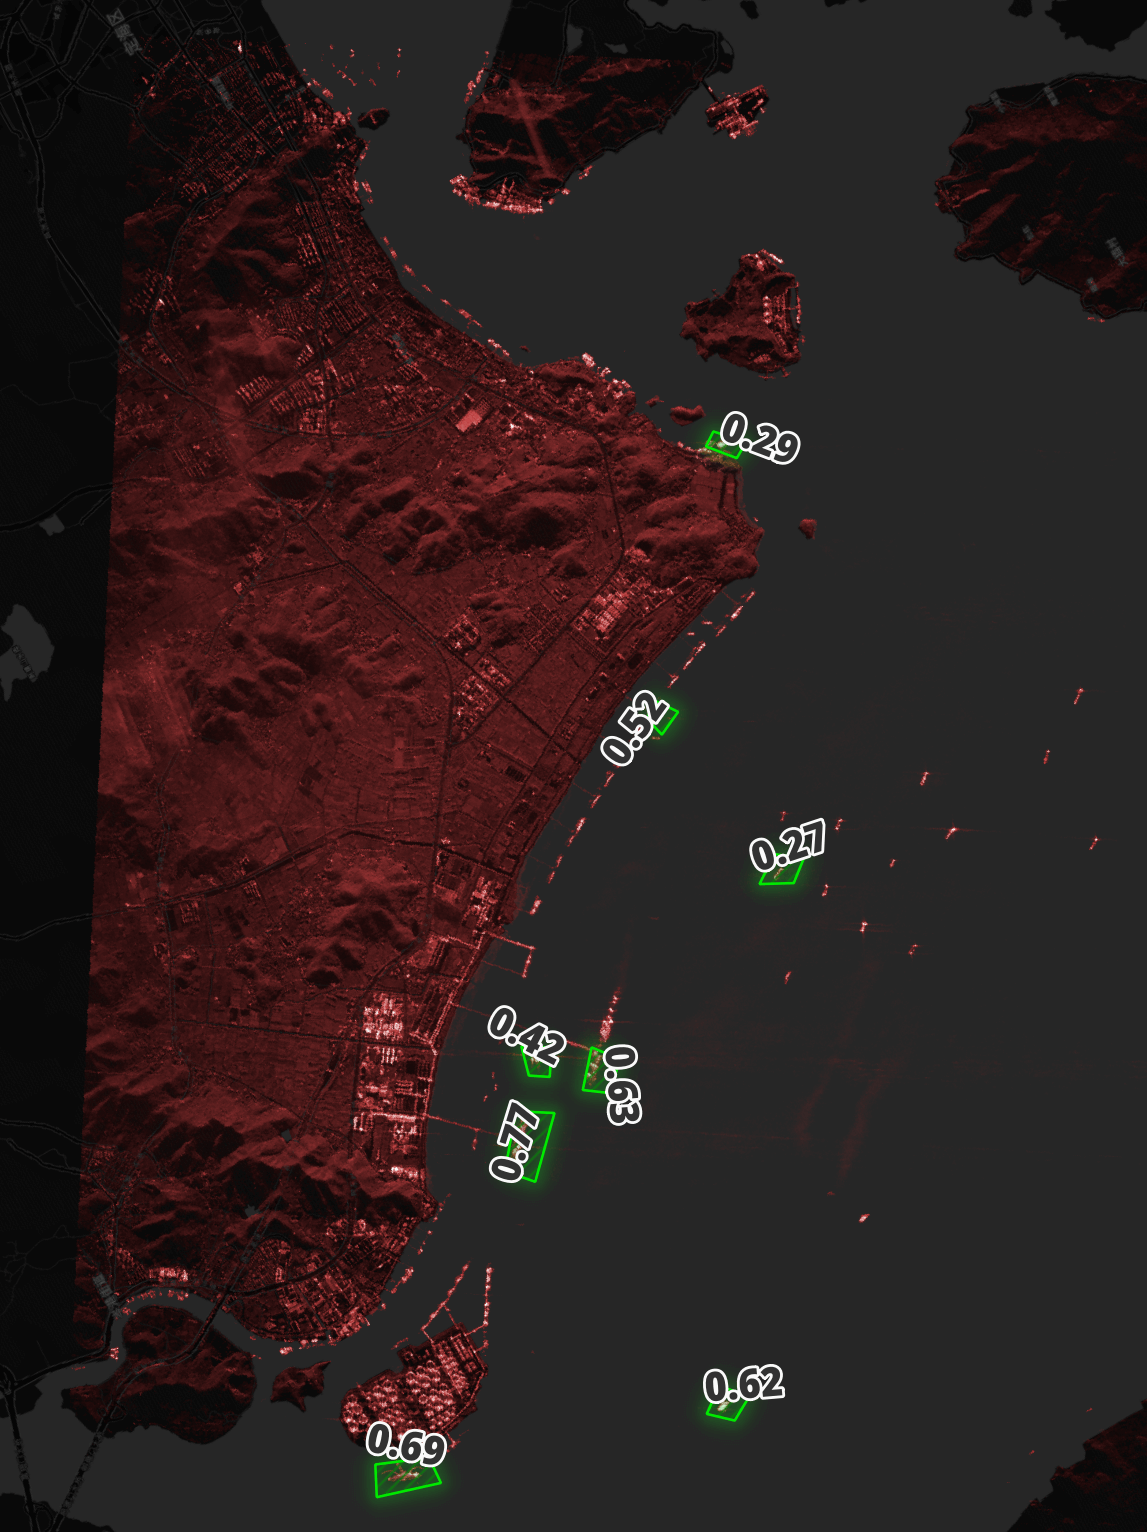
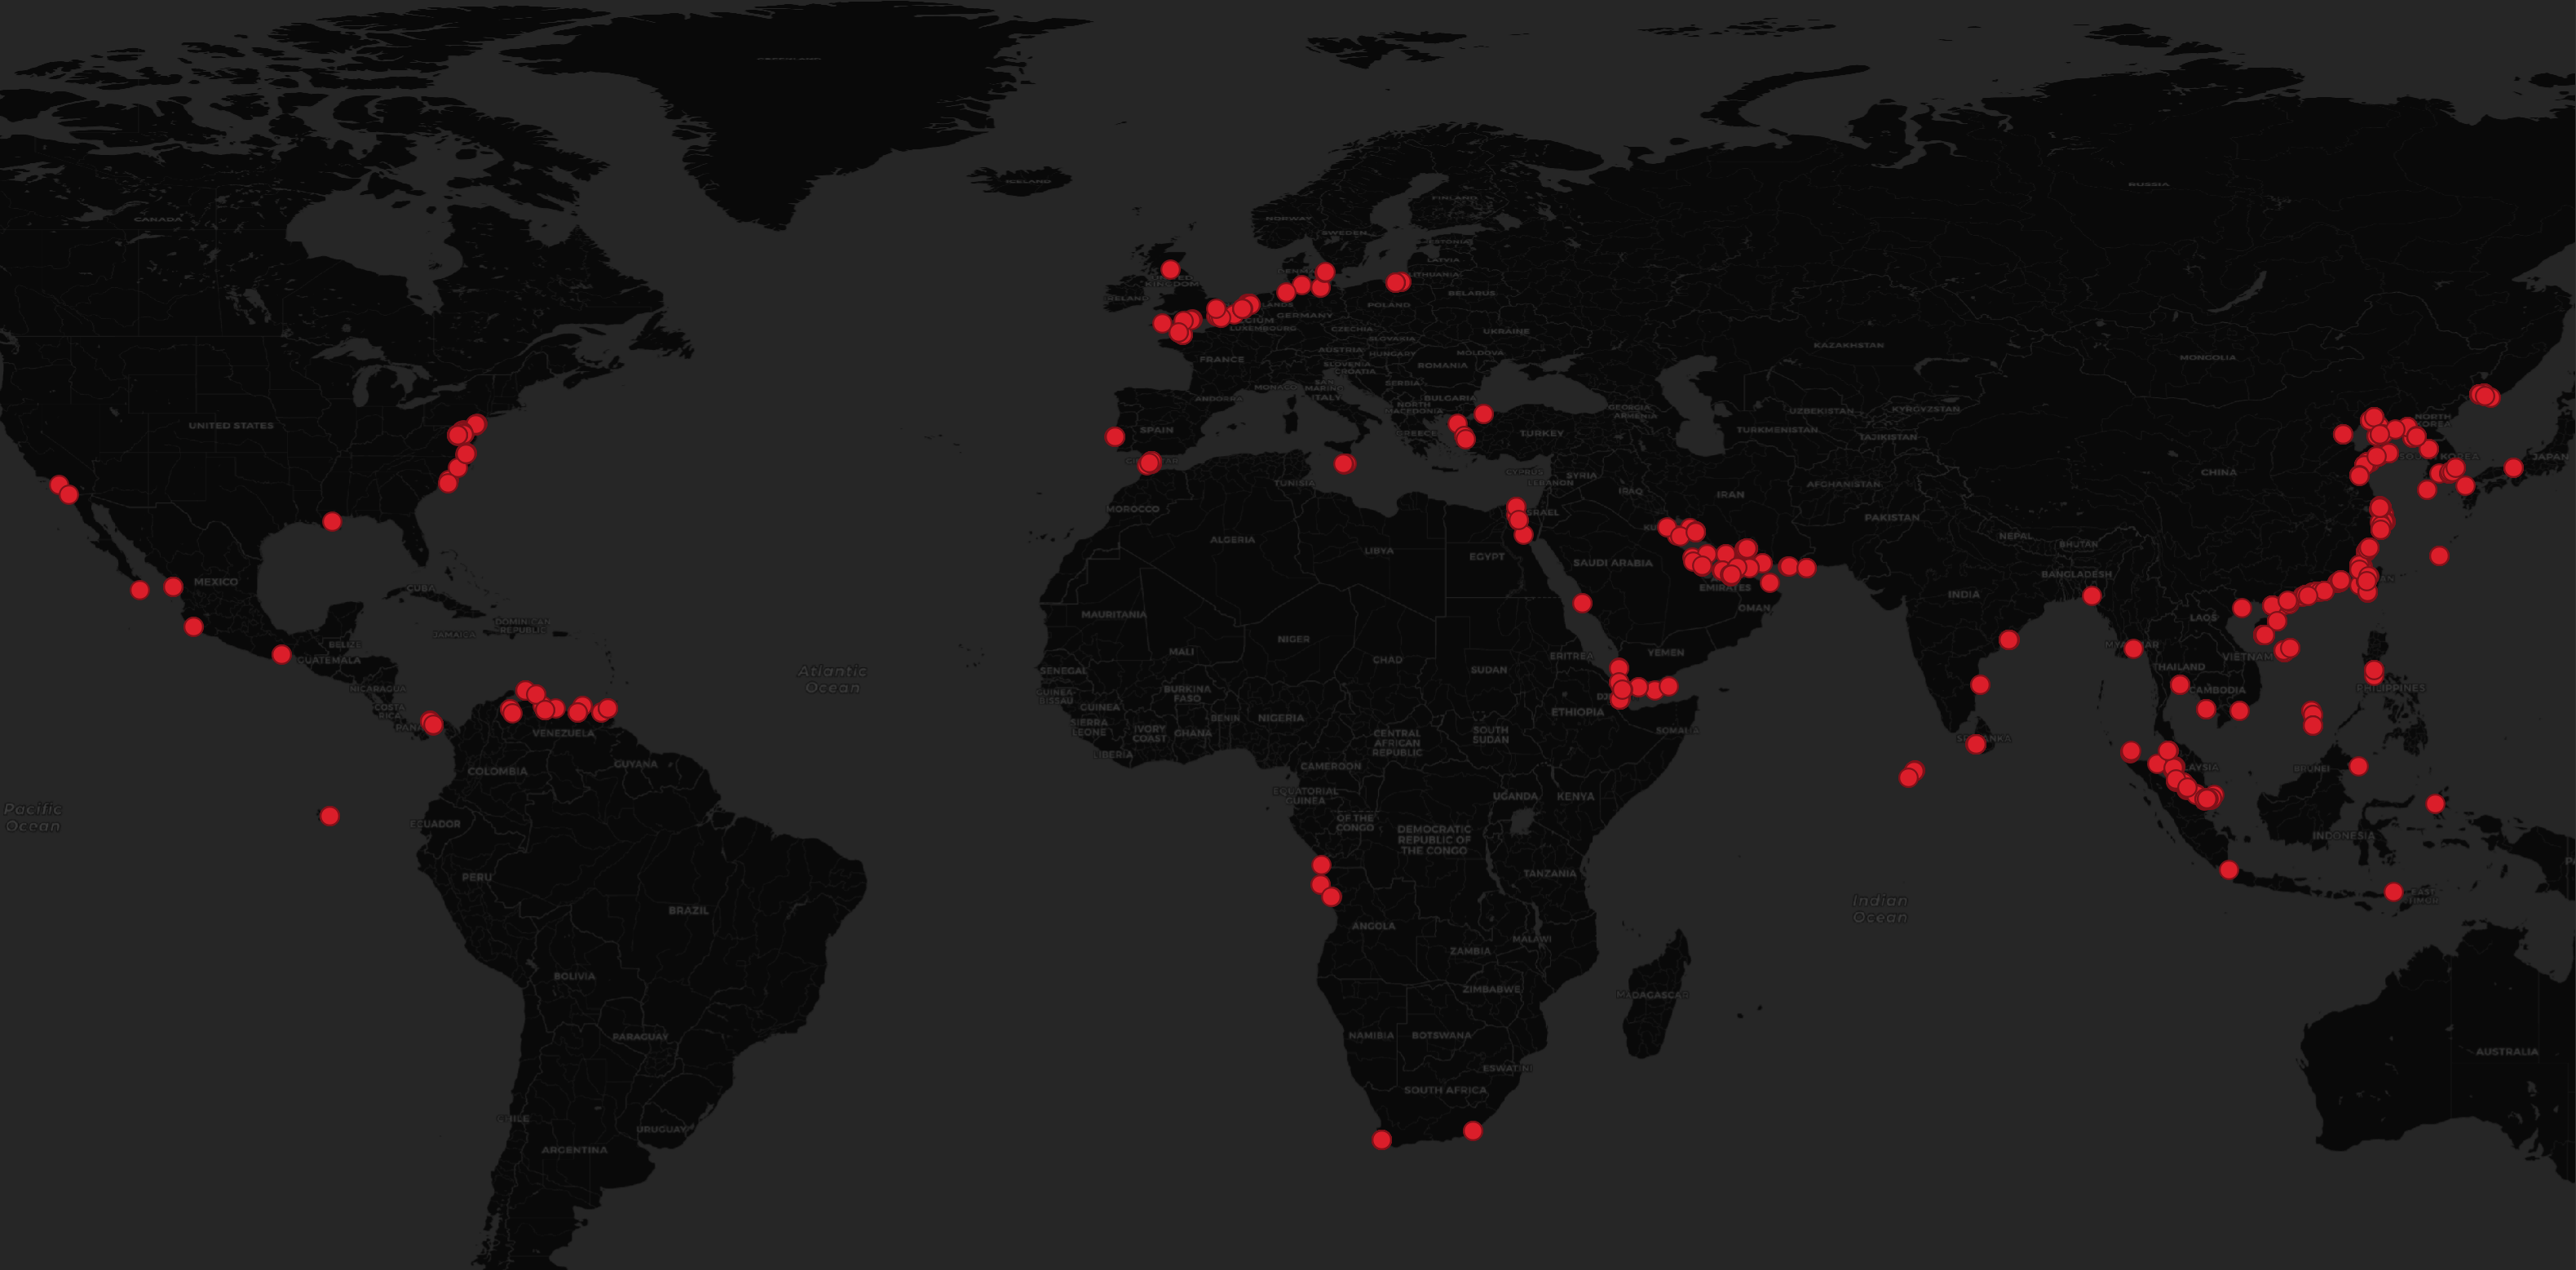
These images were taken across a diverse set of locations including many geopolitical hotspots.
$ python3
from   glob           import glob
import json

from shapely.geometry import shape


pattern = '/home/mark/ship_detection_testdata/*/*/*.json'

with open('umbra_ships.csv', 'w') as f:
    f.write('geom\n')

    for filename in glob(pattern):
        wkt_ = shape(json.loads(open(filename).read())
                    ['collects']
                    [0]
                    ['footprintPolygonLla']).centroid.wkt
        f.write('"%s"\n' % wkt_)
In this post, I'm going to train a ship detection model that works on Umbra's SAR imagery. I'll be using Ultralytics' YOLOv5 and the High-Resolution SAR Images Dataset (HRSID) for training the model.
My Workstation
I'm using a 6 GHz Intel Core i9-14900K CPU. It has 8 performance cores and 16 efficiency cores with a total of 32 threads and 32 MB of L2 cache. It has a liquid cooler attached and is housed in a spacious, full-sized, Cooler Master HAF 700 computer case. I've come across videos on YouTube where people have managed to overclock the i9-14900KF to 9.1 GHz.
The system has 96 GB of DDR5 RAM clocked at 6,000 MT/s and a 5th-generation, Crucial T700 4 TB NVMe M.2 SSD which can read at speeds up to 12,400 MB/s. There is a heatsink on the SSD to help keep its temperature down. This is my system's C drive.
The system is powered by a 1,200-watt, fully modular, Corsair Power Supply and is sat on an ASRock Z790 Pro RS Motherboard.
I'm running Ubuntu 22 LTS via Microsoft's Ubuntu for Windows on Windows 11 Pro. In case you're wondering why I don't run a Linux-based desktop as my primary work environment, I'm still using an Nvidia GTX 1080 GPU which has better driver support on Windows and I use ArcGIS Pro from time to time which only supports Windows natively.
Installing Prerequisites
I'll be using Python and a few other tools to help analyse the imagery in this post.
$ sudo apt update
$ sudo apt install \
    aws-cli \
    jq \
    python3-pip \
    python3-virtualenv
I'll set up a Python Virtual Environment and install a few packages.
$ virtualenv ~/.umbra_yolo
$ source ~/.umbra_yolo/bin/activate
$ python3 -m pip install \
    duckdb \
    geopy \
    rich \
    shapely
Below will install YOLOv5's dependencies.
$ git clone https://github.com/ultralytics/yolov5 ~/yolov5
$ pip install -r ~/yolov5/requirements.txt
I'll be using JSON Convert (jc) to convert the output of various CLI tools into JSON. This will make it much easier to compile statistics on the git repositories discussed in this post.
$ wget https://github.com/kellyjonbrazil/jc/releases/download/v1.25.2/jc_1.25.2-1_amd64.deb
$ sudo dpkg -i jc_1.25.2-1_amd64.deb
I'll also use DuckDB, along with its JSON and Spatial extensions, in this post.
$ cd ~
$ wget -c https://github.com/duckdb/duckdb/releases/download/v1.0.0/duckdb_cli-linux-amd64.zip
$ unzip -j duckdb_cli-linux-amd64.zip
$ chmod +x duckdb
$ ~/duckdb
INSTALL json;
INSTALL spatial;
I'll set up DuckDB to load all these extensions each time it launches.
$ vi ~/.duckdbrc
.timer on
.width 180
LOAD json;
LOAD spatial;
The maps in this post were rendered with QGIS version 3.34. QGIS is a desktop application that runs on Windows, macOS and Linux.
Downloading Satellite Imagery
Umbra currently have 7.4 TB of files in their ship detection folder in their open data S3 bucket.
$ aws s3 ls --no-sign-request \
            --summarize \
            --human \
            --recursive \
            s3://umbra-open-data-catalog/sar-data/tasks/ship_detection_testdata/ \
    | tail -n2
Total Objects: 4573
   Total Size: 7.4 TiB
I'll download the JSON metadata and GeoTIFFs. These add up to 394 GB in size.
$ mkdir -p ~/ship_detection_testdata
$ cd ~/ship_detection_testdata

$ for FORMAT in json tif; do
    aws s3 --no-sign-request \
           sync \
           --exclude="*" \
           --include="*.$FORMAT" \
           s3://umbra-open-data-catalog/sar-data/tasks/ship_detection_testdata/ \
           ./
  done
Below is a breakdown of the file counts bucketed to the nearest GB.
$ ls -lR \
    | jc --ls \
    | ~/duckdb -c "
            SELECT   ROUND(size / 1024 / 1024 / 1024)::int AS size_gb,
                     COUNT(*)
            FROM     READ_JSON_AUTO('/dev/stdin')
            GROUP BY 1
            ORDER BY 1;"
┌─────────┬──────────────┐
│ size_gb │ count_star() │
│  int32  │    int64     │
├─────────┼──────────────┤
│       0 │         3787 │
│       1 │          180 │
│       2 │           11 │
│       3 │            9 │
│       4 │            3 │
│       5 │            3 │
└─────────┴──────────────┘
The majority of files are under a GB but some are as large as five GB.
$ ls -lR \
    | jc --ls \
    | ~/duckdb -c "
            SELECT   size,
                     filename
            FROM     READ_JSON_AUTO('/dev/stdin')
            ORDER BY size DESC
            LIMIT    10;"
┌────────────┬──────────────────────────────────────┐
│    size    │               filename               │
│   int64    │               varchar                │
├────────────┼──────────────────────────────────────┤
│ 5125833514 │ 2023-12-06-14-30-39_UMBRA-05_GEC.tif │
│ 4973515962 │ 2023-12-30-02-56-59_UMBRA-04_GEC.tif │
│ 4880185578 │ 2023-12-30-01-23-15_UMBRA-04_GEC.tif │
│ 4722625282 │ 2023-12-06-01-53-34_UMBRA-05_GEC.tif │
│ 4351925386 │ 2023-12-04-03-54-25_UMBRA-05_GEC.tif │
│ 4027566020 │ 2023-10-26-05-39-39_UMBRA-05_GEC.tif │
│ 3271758578 │ 2023-12-06-12-24-10_UMBRA-05_GEC.tif │
│ 3196780818 │ 2024-02-10-19-06-27_UMBRA-07_GEC.tif │
│ 3078709927 │ 2024-03-29-17-52-28_UMBRA-05_GEC.tif │
│ 2867770018 │ 2023-10-06-02-28-43_UMBRA-05_GEC.tif │
├────────────┴──────────────────────────────────────┤
│ 10 rows                                 2 columns │
└───────────────────────────────────────────────────┘
Locations and Equipment
There are a lot of complexities as to who's water a ship is in. I've made an attempt to use OSM's reverse geocoder to determine which country the centre of each SAR image's footprint is in.
$ python3
import json
from   glob             import glob
from   time             import sleep

from   geopy.geocoders  import Nominatim
from   rich.progress    import track
from   shapely          import wkt
from   shapely.geometry import shape


geolocator = Nominatim(user_agent='geopy')

with open('imagery.json', 'w') as f:
    for filename in track(glob('*/*/*.json')):
        rec = json.loads(open(filename).read())

        for collect_num, collect in enumerate(rec['collects']):
            geom = shape(collect['footprintPolygonLla'])

            # Convert the POLYGON Z to a POLYGON
            geom = wkt.loads(wkt.dumps(geom, output_dimension=2))

            try:
                osm = geolocator.reverse('%f %f' % (geom.centroid.y,
                                                    geom.centroid.x)).raw
            except Exception as exc:
                print(exc)
                osm = None

            f.write(json.dumps({
                'osm':         osm,
                'collect_num': collect_num,
                'sku':         rec['productSku'],
                'sat':         rec['umbraSatelliteName'],
                'filename':    filename,
                'yyyy_mm':     rec['collects'][0]['startAtUTC'][:7],
                'centroid_x':  geom.centroid.x,
                'centroid_y':  geom.centroid.y,
                'geom':        geom.wkt},
                sort_keys=True) + '\n')
            sleep(1)
The imagery covers at least 53 countries and international waters. Below are the top ten countries represented.
$ jq -S .osm.address.country_code imagery.json \
    | sort \
    | uniq -c \
    | sort -rn \
    | head
321 "cn"
 80 "us"
 59 "ir"
 34 "kr"
 33 "ru"
 31 "ae"
 30 "sg"
 29 "my"
 29 "dj"
 26 "nl"
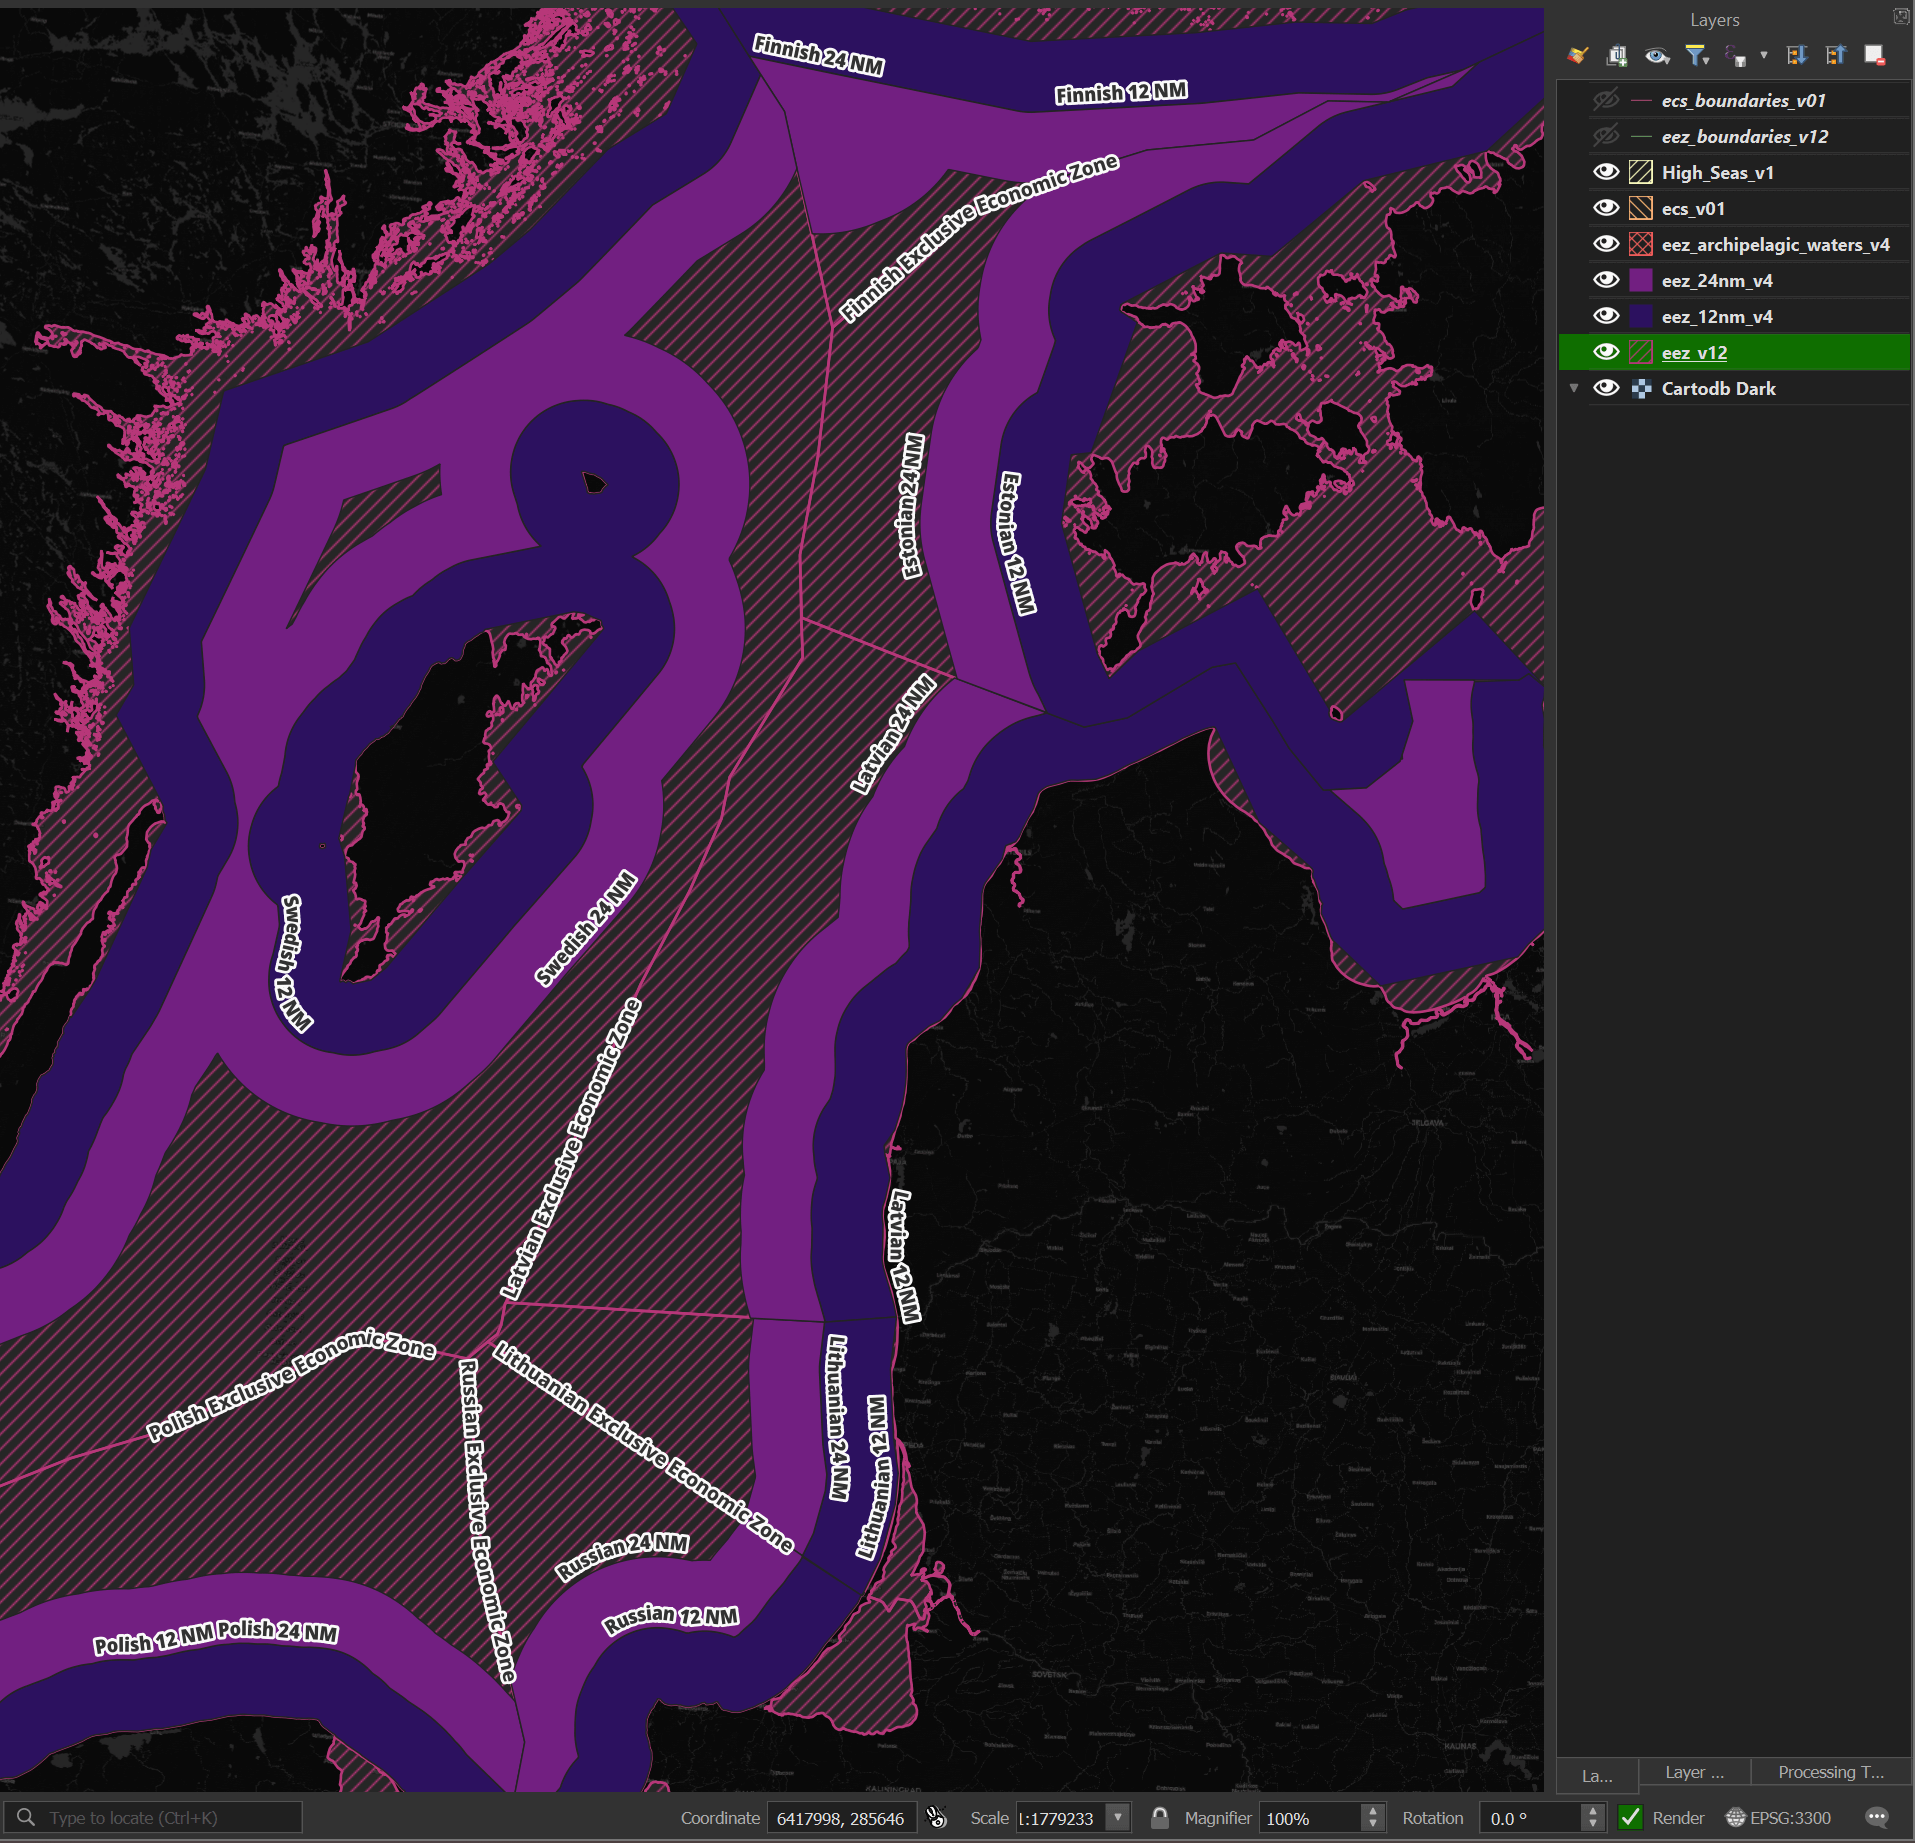
Marine Regions has GeoPackage files delineating maritime boundaries. Seven of the nine files contain polygons that I'll use to determine the waters a given centroid is in.
$ cd ~/marineregions_org
$ ls -lh *.gpkg
..  69M .. eez_12nm_v4.gpkg
..  60M .. eez_24nm_v4.gpkg
..  77M .. eez_internal_waters_v4.gpkg
..  16M .. eez_boundaries_v12.gpkg
.. 157M .. eez_v12.gpkg
..  39M .. eez_archipelagic_waters_v4.gpkg
.. 2.1M .. ecs_boundaries_v01.gpkg
.. 7.0M .. ecs_v01.gpkg
.. 8.8M .. High_Seas_v1.gpkg
Below is a rendering of this dataset.
I'll first import these GeoPackage files into DuckDB.
$ for FILENAME in *.gpkg; do
      BASENAME=`echo "$FILENAME" | cut -d. -f1`
      ~/duckdb -c "CREATE OR REPLACE TABLE $BASENAME AS
                      SELECT *
                      FROM   ST_READ('$FILENAME');" \
          waters.duckdb
  done
Polygons can overlap one another so I'll first get every point-polygon collision there is.
$ python
import json

import duckdb
from   rich.progress import track


tables = (
    'High_Seas_v1',
    'eez_archipelagic_waters_v4',
    'ecs_boundaries_v01',
    'eez_boundaries_v12',
    'ecs_v01',
    'eez_internal_waters_v4',
    'eez_12nm_v4',
    'eez_v12',
    'eez_24nm_v4')

con = duckdb.connect(database='waters.duckdb')
df = con.sql('INSTALL spatial;')

with open('waters.json', 'w') as f:
    centroid_num = 0

    for geom in track(open('/home/mark/umbra_ships.csv'), total=996):
        try:
            lon, lat = [float(x)
                        for x in geom.strip()
                                     .split('(')[-1]
                                     .split(')')[0]
                                     .split(' ')]
        except:
            continue

        for table in tables:
            df = con.sql("""LOAD    spatial;

                            SELECT *
                            FROM   """ + table + """
                            WHERE  ST_CONTAINS(geom, ST_POINT(?, ?));""",
                         params=(lon, lat)).to_df()
            if not df.empty:
                out = {'lon':          lon,
                       'lat':          lat,
                       'centroid_num': centroid_num}
                out[table] = json.loads(df.to_json())

                f.write(json.dumps(out, sort_keys=True) + '\n')

        centroid_num = centroid_num + 1
I'll then take the last point-polygon collision from the results and use it as the location for each image's centroid.
with open('waters_last_geoname.json', 'w') as f:
    for line in open('waters.json'):
        rec = json.loads(line)

        out = {'centroid_num': rec['centroid_num'],
               'lat':          rec['lat'],
               'lon':          rec['lon']}

        tables = [x
                  for x in rec.keys()
                  if x not in ('centroid_num', 'lat', 'lon')]

        for table in tables:
            out['GEONAME'] = rec[table]['GEONAME']['0']

        f.write(json.dumps(out, sort_keys=True) + '\n')
The above returned 881 results out of the 998 image centroids in this dataset. Below are the top 40 locations for the imagery in Umbra's dataset.
$ ~/duckdb
.maxrows 100

SELECT   GEONAME,
         COUNT(*)
FROM     READ_JSON('waters_last_geoname.json')
GROUP BY 1
ORDER BY 2 DESC
LIMIT    40;
┌──────────────────────────────────────────┬──────────────┐
│                 GEONAME                  │ count_star() │
│                 varchar                  │    int64     │
├──────────────────────────────────────────┼──────────────┤
│ Chinese Exclusive Economic Zone          │          165 │
│ Chinese Internal Waters                  │          112 │
│ Chinese 12 NM                            │           36 │
│ United States Exclusive Economic Zone    │           31 │
│ United States 12 NM                      │           31 │
│ Russian Exclusive Economic Zone          │           23 │
│ Russian Internal Waters                  │           23 │
│ Malaysian Exclusive Economic Zone        │           22 │
│ Djiboutian Exclusive Economic Zone       │           18 │
│ Iranian Exclusive Economic Zone          │           17 │
│ Iranian Internal Waters                  │           16 │
│ Indonesian Exclusive Economic Zone       │           16 │
│ Panamanian Exclusive Economic Zone       │           13 │
│ Panamanian Internal Waters               │           13 │
│ Malaysian Internal Waters                │           13 │
│ Sri Lankan 12 NM                         │           12 │
│ Sri Lankan Exclusive Economic Zone       │           12 │
│ Yemeni Exclusive Economic Zone           │           12 │
│ Philippine Exclusive Economic Zone       │           12 │
│ Djiboutian Internal Waters               │           12 │
│ Emirati Exclusive Economic Zone          │           11 │
│ Emirati 12 NM                            │           11 │
│ Overlapping claim Taiwan: Taiwan / China │           10 │
│ Maldivian Exclusive Economic Zone        │           10 │
│ Maldivian Archipelagic Waters            │           10 │
│ South Korean Exclusive Economic Zone     │            9 │
│ Malaysian 12 NM                          │            9 │
│ South Korean Internal Waters             │            9 │
│ North Korean 12 NM                       │            8 │
│ North Korean Exclusive Economic Zone     │            8 │
│ Yemeni 12 NM                             │            7 │
│ Egyptian Exclusive Economic Zone         │            7 │
│ Venezuelan Exclusive Economic Zone       │            6 │
│ Djiboutian 12 NM                         │            6 │
│ Indonesian 12 NM                         │            6 │
│ Thai Internal Waters                     │            5 │
│ Thailand Exclusive Economic Zone         │            5 │
│ Singaporean 12 NM                        │            5 │
│ Pakistani Internal Waters                │            5 │
│ Indian Exclusive Economic Zone           │            5 │
├──────────────────────────────────────────┴──────────────┤
│ 40 rows                                       2 columns │
└─────────────────────────────────────────────────────────┘
Below is a breakdown of the satellites and the months in which the images were captured.
$ ~/duckdb
PIVOT    READ_JSON_AUTO('imagery.json')
ON       sat
USING    COUNT(*)
GROUP BY yyyy_mm
ORDER BY yyyy_mm;
┌─────────┬──────────┬──────────┬──────────┬──────────┬──────────┐
│ yyyy_mm │ UMBRA_04 │ UMBRA_05 │ UMBRA_06 │ UMBRA_07 │ UMBRA_08 │
│ varchar │  int64   │  int64   │  int64   │  int64   │  int64   │
├─────────┼──────────┼──────────┼──────────┼──────────┼──────────┤
│ 2023-01 │       62 │       32 │        0 │        0 │        0 │
│ 2023-02 │       49 │       54 │        0 │        0 │        0 │
│ 2023-03 │       22 │       24 │        0 │        0 │        0 │
│ 2023-04 │       18 │       17 │        1 │        0 │        0 │
│ 2023-05 │       11 │       11 │        1 │        0 │        0 │
│ 2023-06 │       30 │       33 │       45 │        0 │        0 │
│ 2023-07 │       38 │       43 │        8 │        0 │        0 │
│ 2023-08 │        9 │       31 │        9 │        0 │        0 │
│ 2023-09 │       23 │       26 │       19 │        0 │        0 │
│ 2023-10 │       57 │       50 │        4 │        0 │        0 │
│ 2023-11 │       24 │       15 │        1 │        0 │        0 │
│ 2023-12 │       36 │       46 │       22 │        0 │        0 │
│ 2024-01 │        7 │        2 │        7 │        0 │        0 │
│ 2024-02 │       12 │       10 │        4 │        9 │        7 │
│ 2024-03 │       20 │       18 │       12 │        6 │        8 │
│ 2024-04 │        1 │        0 │        1 │        0 │        0 │
├─────────┴──────────┴──────────┴──────────┴──────────┴──────────┤
│ 16 rows                                              6 columns │
└────────────────────────────────────────────────────────────────┘
Ship Detection Training Data
HRSID contains imagery of 16,951 ships across 5,604 images. The images span a wide range of resolutions, polarisations, sea conditions and geographies.
I found a GitHub repository of HRSID's training data already nicely organised. The repository is 2.6 GB including the .git folder.
$ git clone https://github.com/Akashkalasagond/SAR-Ship-Detection/ \
    ~/SAR-Ship-Detection
Training with YOLOv5
I'll download one of YOLOv5's pre-trained weights.
$ cd ~
$ wget https://github.com/ultralytics/assets/releases/download/v8.2.0/yolov5nu.pt
Below I'll set up a training configuration for YOLOv5.
$ cd ~/SAR-Ship-Detection
$ vi settings.yaml
path: "/home/mark/SAR-Ship-Detection/"
train: "/home/mark/SAR-Ship-Detection/train/images"
val: "/home/mark/SAR-Ship-Detection/test/images"

# class names
names:
  0: 'ship'
I'll train a model using the above settings on my Nvidia GeForce GTX 1080.
$ python3
from ultralytics import YOLO


model   = YOLO('/home/mark/yolov5nu.pt')
results = model.train(data='/home/mark/SAR-Ship-Detection/settings.yaml',
                      epochs=100,
                      batch=8,
                      imgsz=800,
                      plots=True)
Ultralytics YOLOv8.2.32 🚀 Python-3.10.12 torch-2.3.1+cu121 CUDA:0 (NVIDIA GeForce GTX 1080, 8192MiB)
...
100 epochs completed in 2.885 hours.
Optimizer stripped from runs/detect/train/weights/last.pt, 5.3MB
Optimizer stripped from runs/detect/train/weights/best.pt, 5.3MB
The training finished in just under 3 hours and produced a 5.3 MB weights model.
Inferring Umbra's Imagery
Below I'll attempt to detect ships in Umbra's 998 SAR images using the model I trained.
$ python3
from glob import glob
import json

from   rich.progress import track
from   ultralytics import YOLO


model   = YOLO('runs/detect/train/weights/best.pt')
pattern = '/home/mark/ship_detection_testdata/*/*/*_GEC.tif'

with open('ship_detections.jsonl', 'w') as f:
    for filename in track(glob(pattern), total=998):
        try:
            for results in model(filename):
                for result in results:
                    ships = json.loads(result.tojson())

                    for ship in ships:
                        f.write(json.dumps({**ship,
                                            **{'filename': result.path}},
                                           sort_keys=True) + '\n')
        except Exception as exc:
            print(exc)
During the run, the 5 GB GeoTIFF caused the following exception.
error: OpenCV(4.10.0) /io/opencv/modules/imgcodecs/src/loadsave.cpp:79: error: (-215:Assertion failed) pixels <= CV_IO_MAX_IMAGE_PIXELS in function 'validateInputImageSize'
I wasn't able to adjust OpenCV's settings within the allotted time box I had for this post so I wrapped the inference in a try/except statement so to not hold back the rest of the job.
Below is a section of YOLO's output during inference.
..2023-04-15-01-17-53_UMBRA-05_GEC.tif: 800x800 3 ships, 41.6ms
..2023-08-07-13-53-00_UMBRA-04_GEC.tif: 800x800 (no detections), 45.4ms
..2023-03-25-02-22-27_UMBRA-04_GEC.tif: 800x800 4 ships, 39.1ms
..2023-01-23-18-25-33_UMBRA-05_GEC.tif: 800x800 (no detections), 40.5ms
..2023-08-10-13-17-17_UMBRA-05_GEC.tif: 800x800 4 ships, 38.7ms
..2023-10-25-10-31-48_UMBRA-05_GEC.tif: 800x640 (no detections), 31.7ms
..2023-06-18-01-56-53_UMBRA-04_GEC.tif: 800x800 6 ships, 43.8ms
..2023-11-01-13-52-39_UMBRA-05_GEC.tif: 800x800 1 ship, 43.1ms
..2023-04-23-07-12-19_UMBRA-05_GEC.tif: 800x800 3 ships, 52.2ms
..2023-03-06-02-08-59_UMBRA-04_GEC.tif: 800x800 8 ships, 40.0ms
..2023-10-06-02-14-22_UMBRA-04_GEC.tif: 800x800 (no detections), 80.0ms
..2023-03-09-02-49-06_UMBRA-05_GEC.tif: 800x800 (no detections), 39.5ms
..2023-02-26-14-24-37_UMBRA-04_GEC.tif: 800x800 6 ships, 44.9ms
...
There were 2,534 ships detected. Below is an example record from the results file.
$ wc -l ship_detections.jsonl # 2,534 lines
$ head -n1 ship_detections.jsonl | jq -S .
{
  "box": {
    "x1": 12475.06152,
    "x2": 13001.17188,
    "y1": 9329.18945,
    "y2": 9791.08105
  },
  "class": 0,
  "confidence": 0.45151,
  "filename": "/home/mark/ship_detection_testdata/00174818-00fe-4c89-bf45-cc6149253707/2023-04-15-01-17-53_UMBRA-05/2023-04-15-01-17-53_UMBRA-05_GEC.tif",
  "name": "ship"
}
Below are the ship counts across each confidence bracket.
$ ~/duckdb
SELECT   ROUND(confidence, 1),
         COUNT(*)
FROM     READ_JSON('ship_detections.jsonl')
GROUP BY 1
ORDER BY 1;
┌──────────────────────┬──────────────┐
│ round(confidence, 1) │ count_star() │
│        double        │    int64     │
├──────────────────────┼──────────────┤
│                  0.3 │          615 │
│                  0.4 │          466 │
│                  0.5 │          364 │
│                  0.6 │          320 │
│                  0.7 │          306 │
│                  0.8 │          384 │
│                  0.9 │           79 │
└──────────────────────┴──────────────┘
Visualising Ship Detections
I'll get YOLOv5 to annotate Umbra's imagery.
$ python3
from   glob          import glob
import json
from   os.path       import abspath, dirname

from   rich.progress import track
from   ultralytics   import YOLO


model   = YOLO('runs/detect/train/weights/best.pt')
pattern = '/home/mark/ship_detection_testdata/*/*/*_GEC.tif'

for filename in track(glob(pattern), total=998):
    try:
        for results in model(filename):
            for res_num, result in enumerate(results):
                result.save(filename='%s/%04d.jpg' % (dirname(filename), res_num))
    except Exception as exc:
        print(exc)
I re-drew the above images in QGIS to control their formatting and layout better.
Below is a harbour in Taiwan. The model identified three ships correctly but missed out on 10s of others.
Below is an image taken in Singapore and every detection, even with low confidence, is spot on but there are many more ships that go undetected.
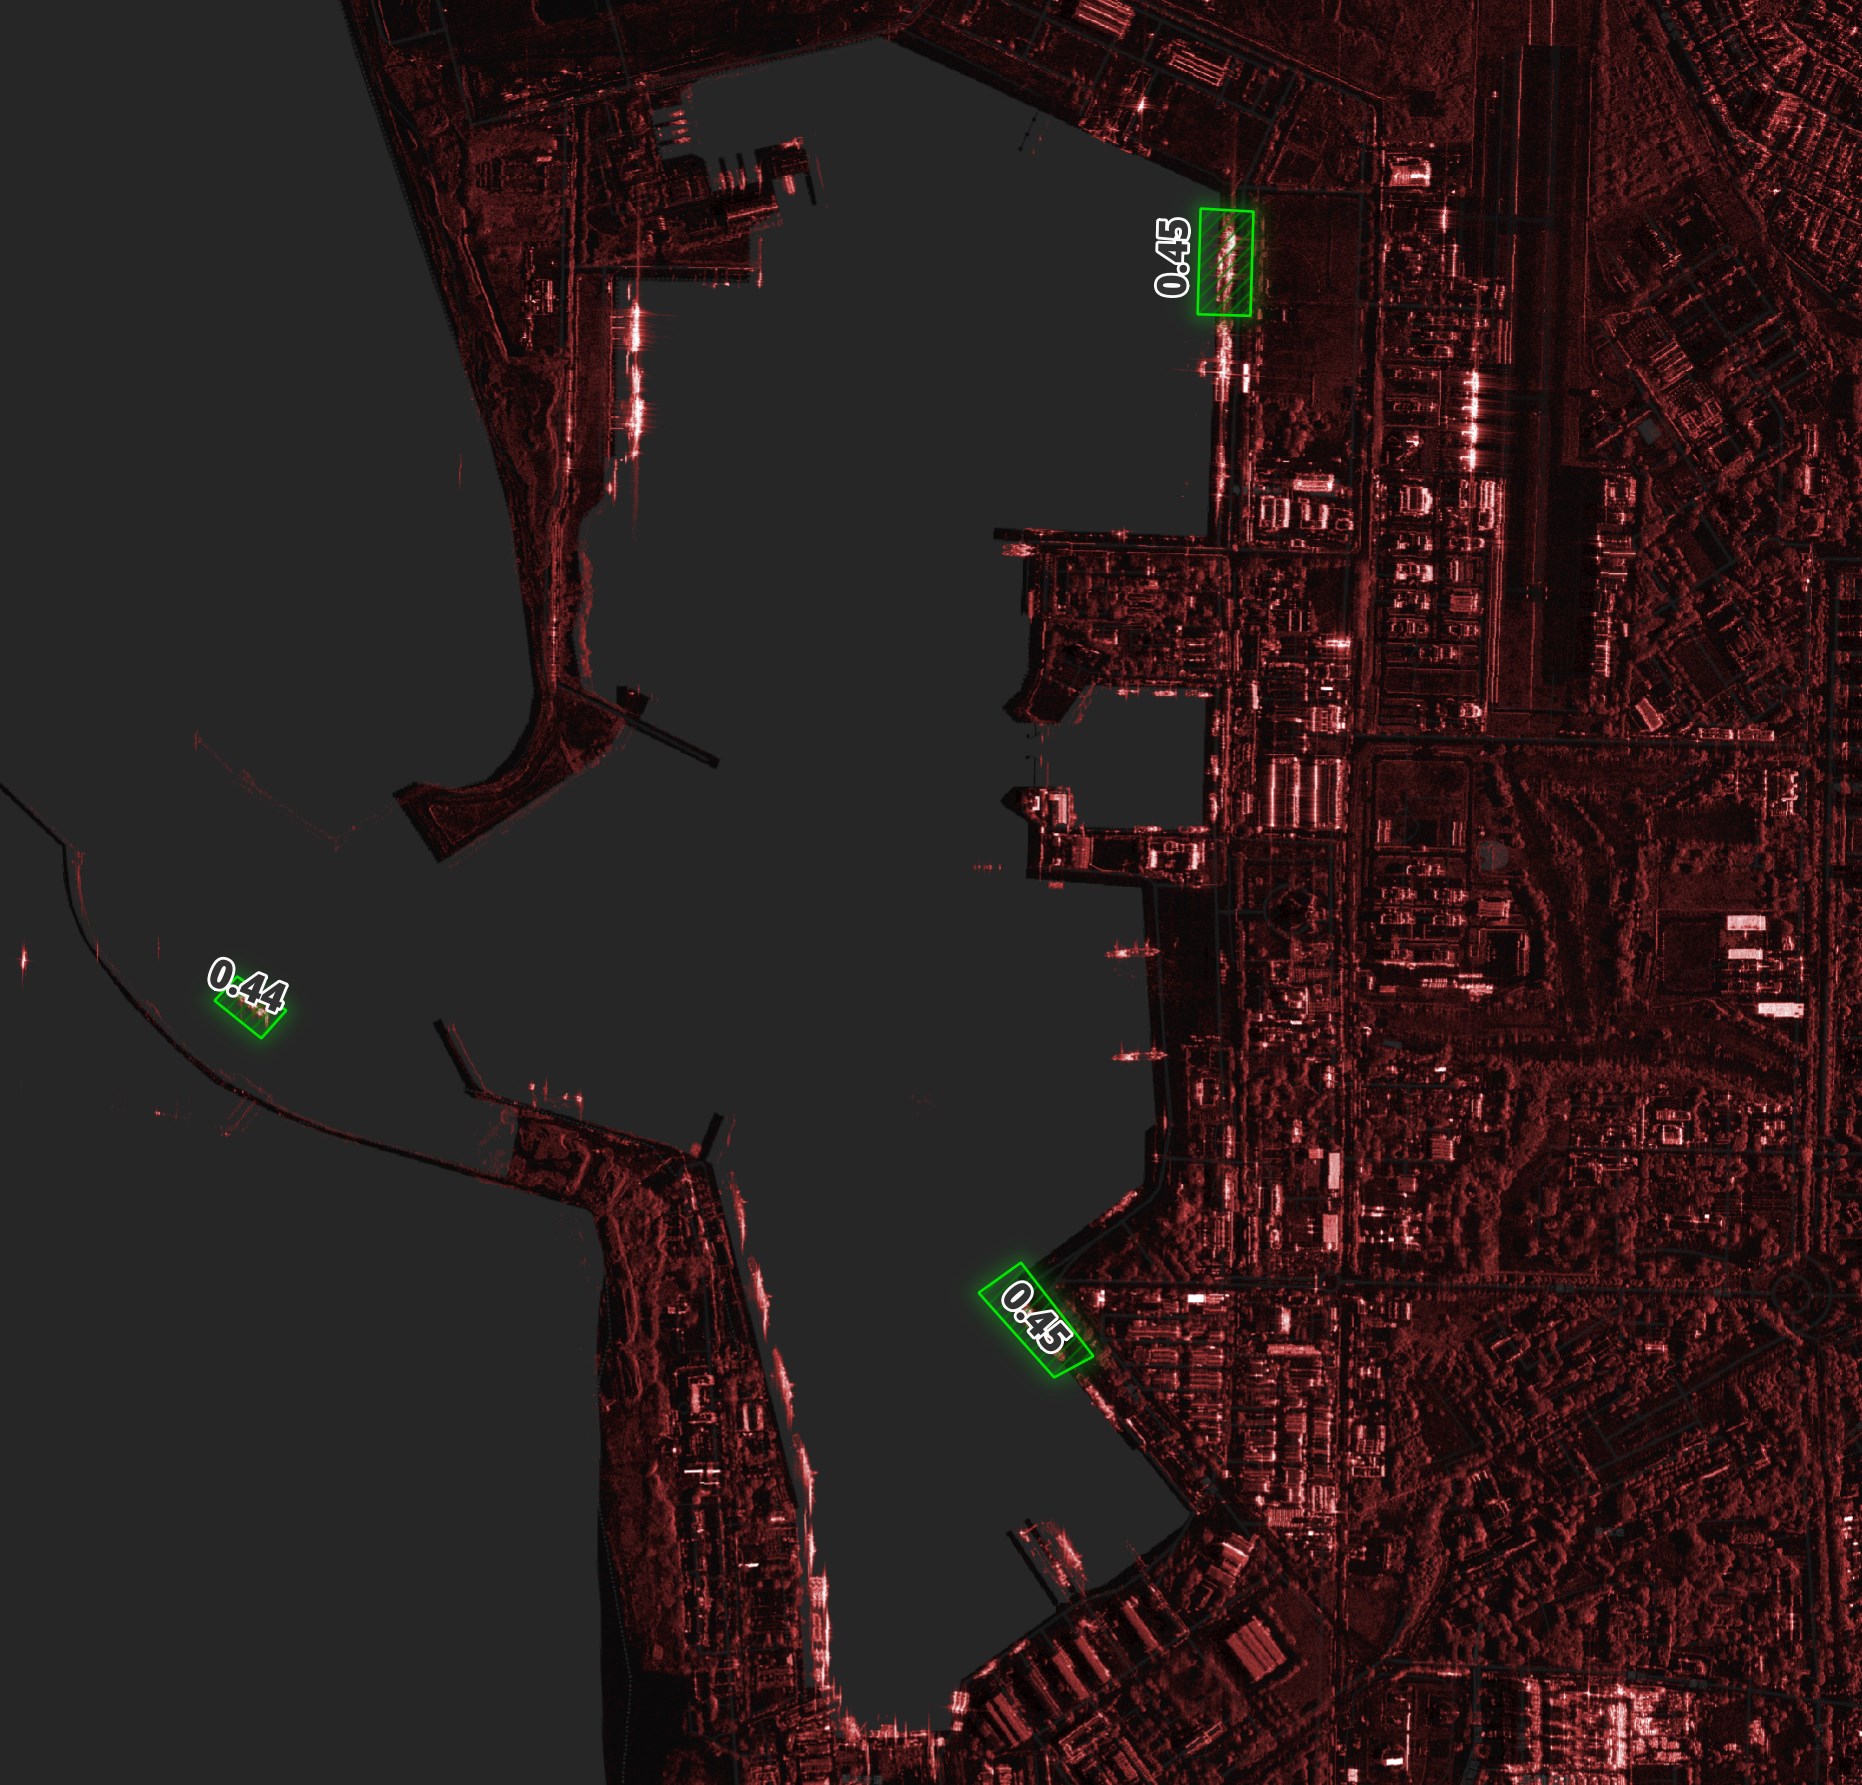
In this port in China, the confidence scores of some of the matches are pretty high but there are a huge number of ships that remain undetected.