In 2015, I published a blog post where I walked through scraping passenger counts between airports off of Wikipedia. With this data, I produced the following rendering.
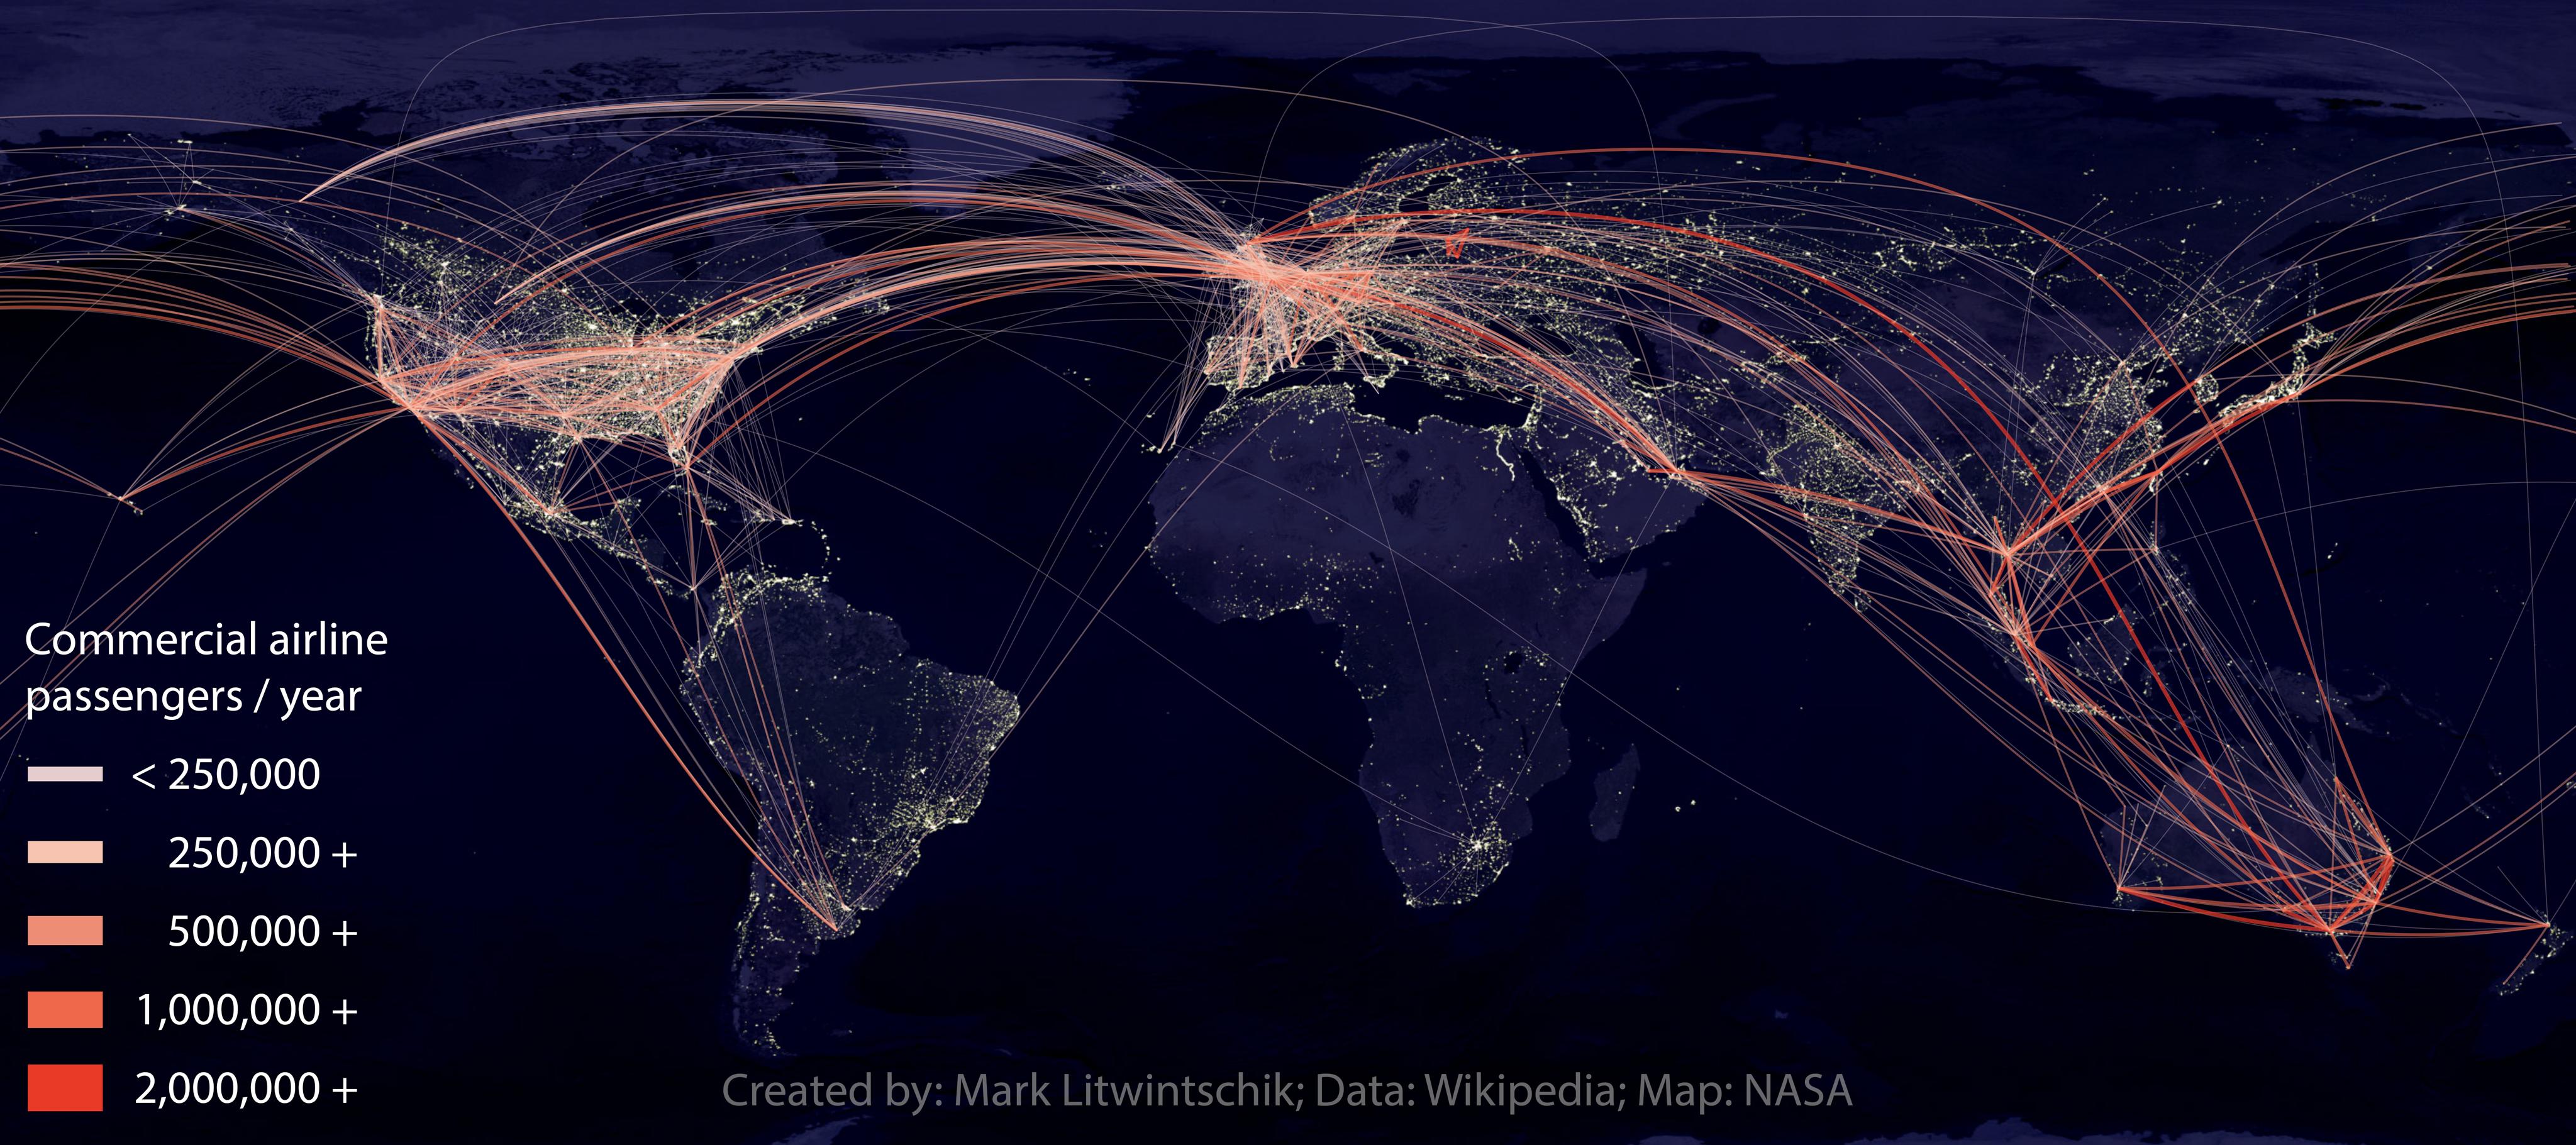
The map was well received and in March 2020, I had agreed for it to be displayed in the Smithsonian in New York before world events cancelled the exhibition.
In terms of broad trends, not much has changed between 2015 and 2023. Transatlantic flights are still a huge revenue driver, the Gulf States continue to do well connecting Europe and Asia, Asia is taking to the skies in incredible numbers and Africa and South America appear to be vastly underserved relative to their populations.
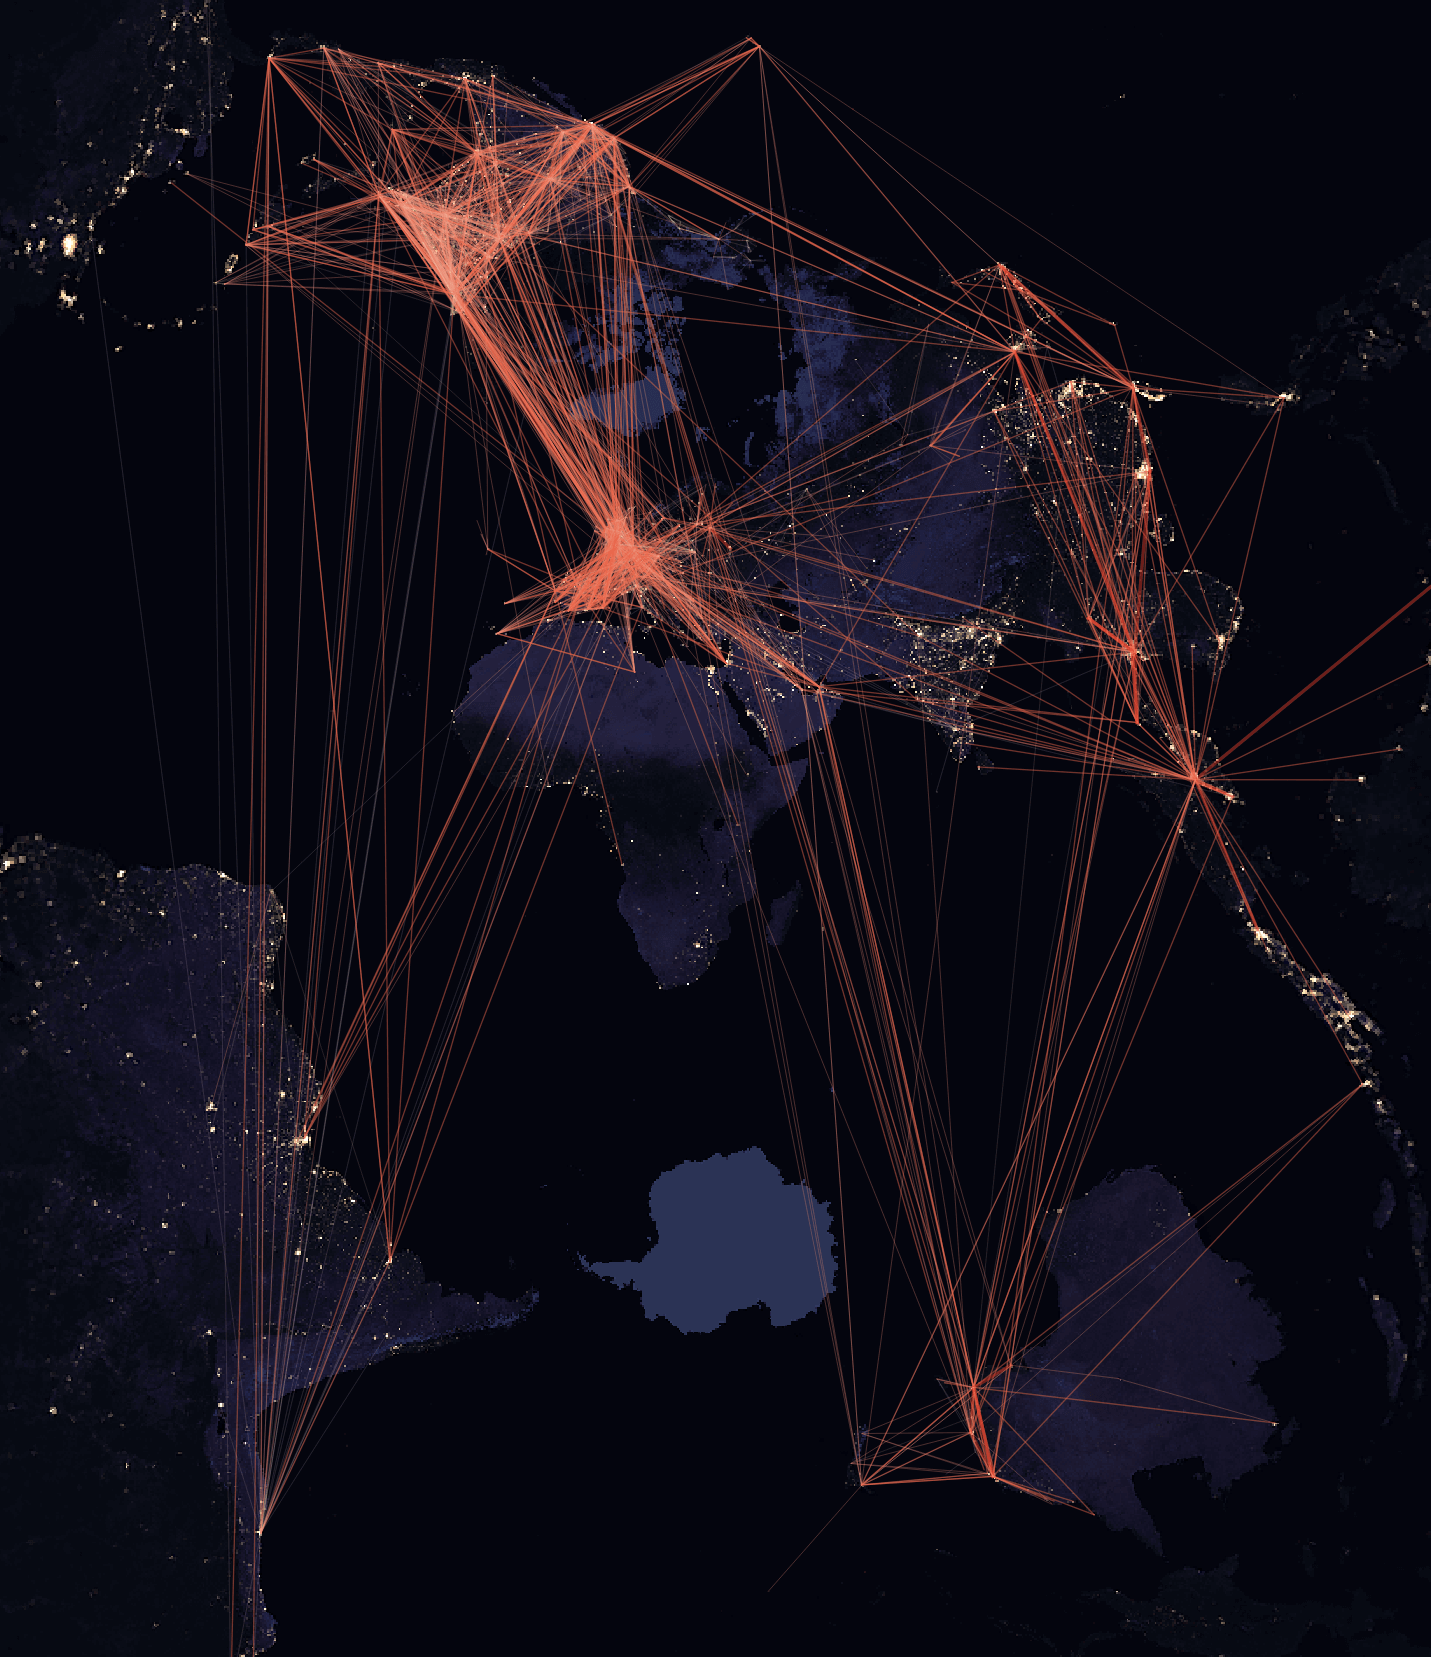
Rendering passenger numbers again for 2023 produces a very similar map despite passenger volumes hitting an all-time high this month. So for that reason, I did a complete overhaul of the parsing code, collected the data from this month's Wikipedia article dump and rendered the world again using an EPSG:9840 project rather than an EPSG:4326 projection as I did above. This offers a unique portrait view that hopefully draws viewers to examine it in closer detail. Thank you to Diana Bonnarens for suggesting this projection.
In this blog post, I'll walk through the steps taken to produce the above rendering.
Installing Prerequisites
If you're using a Mac, install Homebrew and then run the following to install Python and DuckDB.
$ brew install \
    duckdb \
    jq \
    virtualenv
If you are running Ubuntu or Ubuntu for Windows, use the following to install Python and DuckDB.
$ sudo apt update
$ sudo apt install \
    jq \
    python3-pip \
    python3-virtualenv

$ wget 'https://github.com/duckdb/duckdb/releases/download/v0.8.1/duckdb_cli-linux-amd64.zip'
$ unzip -j duckdb_cli-linux-amd64.zip
$ chmod +x duckdb
$ alias duckdb=`pwd`/duckdb
Then, regardless of platform, run the following to set up Python's virtual environment with the packages that will be used in this post.
$ virtualenv ~/.passengers
$ source ~/.passengers/bin/activate
$ pip install \
    ipython \
    lat-lon-parser \
    lxml \
    rich \
    shapely \
    typer \
    wikitextparser
QGIS will be used for rendering the Map. There are pre-compiled binaries available for Windows, Linux and macOS.
Collecting Datasets
Wikipedia produces a 21 GB, Bzip2-compressed dump of its articles every few days. Below will download the July 1st snapshot.
$ wget -c https://dumps.wikimedia.org/enwiki/20230701/enwiki-20230701-pages-articles-multistream.xml.bz2
I'll be using a country boundaries dataset to identify the regions each airport is located in. Below will download the 8.7 MB GeoJSON file with this information.
$ wget 'https://public.opendatasoft.com/api/explore/v2.1/catalog/datasets/world-administrative-boundaries/exports/geojson?lang=en&timezone=Europe%2FHelsinki'
The flight paths are rendered on top of a map NASA produced called Night Black Marble. The 3600x1800 GeoTIFF version of this file is 4.6 MB.
Extracting and Parsing
I'll be using a Python script to conduct all of the extracting, parsing and preparation of the data. There are five verbs this script supports.
$ python extract.py --help
 Usage: extract.py [OPTIONS] COMMAND [ARGS]...

...
╭─ Commands ──────────────────────────────────────────────────────────────────╮
│ bz2-to-jsonl                                                                │
│ jsonl-to-csv                                                                │
│ markdown-to-jsonl                                                           │
│ parsed-to-geojson                                                           │
│ parsed-to-jsonl                                                             │
╰─────────────────────────────────────────────────────────────────────────────╯
The following shows the Python code for extract.py in the order the code appears within the script. I've broken it up into sections for annotation purposes.
$ vi extract.py
Below are the Python modules I'll be using. Typer will be used to produce a CLI interface for the script as well as use Rich to print out clear stack traces and variables within the context of any exception raised during execution. This has been invaluable in helping me work through parsing issues much faster than I would have otherwise.
import bz2
import json
import re

from   geojson import (dumps,
                       Feature,
                       FeatureCollection,
                       LineString)
from   lat_lon_parser import parse as ll_parse
from   lxml import etree
from   shapely import intersection, Point
from   shapely.geometry import shape
import typer
import wikitextparser as wtp


app = typer.Typer(rich_markup_mode='rich')
The first verb will take the BZip2 file from Wikipedia and extract any 'airport' article's title and markdown into a JSON line. This is a lengthy process so the output of this will be kept in a file that later verbs will be able to iterate on more quickly.
@app.command()
def bz2_to_jsonl(bz2_file: str,
                 token:    str = 'airport'):
    parser = get_parser(bz2_file)

    for title, text in parser:
        if token in title.lower():
            print(json.dumps({'title': title, 'text': text}))


def get_parser(filename):
    ns_token        = '{http://www.mediawiki.org/xml/export-0.10/}ns'
    title_token     = '{http://www.mediawiki.org/xml/export-0.10/}title'
    revision_token  = '{http://www.mediawiki.org/xml/export-0.10/}revision'
    text_token      = '{http://www.mediawiki.org/xml/export-0.10/}text'

    with bz2.BZ2File(filename, 'r') as bz2_file:
        for event, element in etree.iterparse(bz2_file, events=('end',)):
            if element.tag.endswith('page'):
                namespace_tag = element.find(ns_token)

                if namespace_tag.text == '0':
                    title_tag = element.find(title_token)
                    text_tag = element.find(revision_token).find(text_token)
                    yield title_tag.text, text_tag.text

                element.clear()
The next verb will take the airport articles JSONL file and attempt to parse out any airport codes, locations and busiest routes lists within each article's markdown.
There are many major airports that do not have a top destinations list within their respective Wikipedia articles but often their top destinations will list them as one of their top destinations. For Example, Dubai International Airport's Wikipedia article doesn't have its top destinations broken down by passenger numbers but Bangkok's Suvarnabhumi Airport lists Dubai as its fifth most popular destination with 1,707,276 passengers in 2019. So even though the statistic is 4 years old, given the recovery in international passenger flights, I'm still able to collect a number that should be within an order of magnitude of what this year's passenger count between these two airports.
Some airports break down passenger numbers for both domestic and international destinations so the parser needs to look for multiple tables within any given article.
There are also some airports like Athens International Airport and Mexico City International Airport that structured their top destinations in such a way that I would have broken my time box for this post chasing a long tail of inconsistent report structure parsing.
@app.command()
def markdown_to_jsonl(jsonl_file: str):
    for line in open(jsonl_file):
        rec = json.loads(line)
        resp = parse_markdown(rec['text'])

        if resp:
            resp['title'] = rec['title']
            print(json.dumps(resp, sort_keys=True))


def parse_markdown(markdown):
    parsed = wtp.parse(markdown)
    out = {}

    def use_regex(input_text):
        pattern = re.compile(
            r"\{\{Airport codes\|([A-Za-z]{3,4})\|([A-Za-z]{3,4})\}\}",
            re.IGNORECASE)
        return pattern.match(input_text)

    for section in parsed.sections:
        for template in section.templates:
            resp = use_regex(template.string)

            if resp:
                out['airport_codes'] = resp.groups() # ('LHR', 'EGLL')

    def use_regex(input_text):
        patterns = [
            r'([0-9]+) busiest ([A-Za-z0-9]+) routes at ([A-Za-z0-9]+) Airport \(([0-9]{4})\)',
            r'Busiest ([0-9]+) routes to and from ([A-Za-z0-9\ ]+) Airport ([0-9]{4})',
            r'Busiest ([A-Za-z0-9]+) Routes ([A-Za-z0-9\/]+) ([A-Za-z0-9\ ]+) Airport \(([0-9]{4})\)',
            r'Busiest ([A-Za-z0-9]+) routes \(([0-9]{4})\)',
            r'Busiest ([A-Za-z0-9]+) routes from ([A-Za-z0-9]+) \(([0-9]{4})\)',
            r'Busiest ([A-Za-z0-9]+) routes to and from ([A-Za-z0-9]+) \(([0-9]{4})\)',
            r'Busiest routes at ([A-Za-z0-9\ ]+) Airport \(([0-9]{4})\)',
            r'Busiest routes to and from ([A-Za-z0-9]+) \(([0-9]{4})\)',
            r'Top ([0-9]+) busiest routes from ([A-Za-z0-9]+) in ([0-9]{4})',
        ]
        for pattern in patterns:
            pattern = re.compile(pattern, re.IGNORECASE)
            matched = pattern.match(input_text)

            if matched:
                return matched

        if 'top ' in input_text.lower() or 'busiest ' in input_text.lower():
            if 'routes' in input_text.lower():
                pattern = r'.* ([0-9]{4})'
                pattern = re.compile(pattern, re.IGNORECASE)
                return pattern.match(input_text)

        return None

    # Amsterdam has multiple tables breaking numbers down by EU and Non-EU
    for table in parsed.tables:
        if table.caption:
            resp = use_regex(table.caption.strip().strip("'").strip())

            if resp:
                if 'parsed_traffic' not in out.keys():
                    out['parsed_traffic'] = []

                out['parsed_traffic'].append({
                    'year': resp.groups()[-1],
                    'parsed_traffic': parse_traffic(table.data())})

    # Parse the Airport's location
    for section in parsed.sections:
        resp = [x.string
                for x in section.templates
                if x.string.startswith('{{coord|')]

        if resp:
            coords = [x
                      for x in resp[0].split('|')[1:9]
                      if 'region' not in x and '=' not in x]

            if len(coords) == 8:
                latitude = ll_parse("%s°%s′%s″%s" % (coords[0],
                                                    coords[1],
                                                    coords[2],
                                                    coords[3]))

                longitude = ll_parse("%s°%s′%s″%s" % (coords[4],
                                                     coords[5],
                                                     coords[6],
                                                     coords[7]))

                out['latitude'] = latitude
                out['longitude'] = longitude
            elif len(coords) == 6:
                latitude = ll_parse("%s°%s″%s" % (coords[0],
                                                  coords[1],
                                                  coords[2]))

                longitude = ll_parse("%s°%s″%s" % (coords[3],
                                                   coords[4],
                                                   coords[5]))

                out['latitude'] = latitude
                out['longitude'] = longitude
            elif len(coords) == 4:
                latitude = ll_parse("%s %s" % (coords[0],
                                               coords[1]))

                longitude = ll_parse("%s %s" % (coords[2],
                                                coords[3]))

                out['latitude'] = latitude
                out['longitude'] = longitude

    return out
When a destination list gives an airport as a destination, occasionally multiple airports are given with their passenger counts aggregated. In this case, I'll assign the passenger count to the first one. Airports are identified by their Wikipedia article titles.
def parse_traffic(rec):
    out = []

    def use_regex(input_text):
        pattern = re.compile(r"([0-9,]+)", re.IGNORECASE)
        return pattern.match(input_text)

    if len(rec) < 2:
        return out

    for line in rec[1:]:
        airport, n_passengers = None, None

        # {{flagdeco|Portugal}} [[Lisbon Airport|Lisbon]]
        resp = [re.sub(r'\{\{.*\|.*\}\}', '', x).strip()
                for x in line
                if x and 'airport' in x.lower()]

        if resp:
            airport = resp[0]

            if ']] and [[' in airport:
                airport = airport.split(']] and [[')
            else:
                airport = [airport,]

            airport = [x.replace('[', '').replace(']', '').split('|')[0]
                       for x in airport]

        for ceil in line:
            if ceil:
                resp = use_regex(ceil)

                if resp:
                    n_passengers = int(resp[0].replace(',', ''))

        if airport and n_passengers:
            out.append({'airports': airport,
                        'passengers': n_passengers})

    return out
Below I'll take a JSONL file with the airport details in JSON format and build a pairs list for the two airports. I also use Shapely to identify the country and part of the world each airport is located in based on their longitude and latitude.
def get_locations_and_pairs(parsed_file:     str,
                            boundaries_file: str):
    recs = [json.loads(line) for line in open(parsed_file)]

    countries = [(shape(x['geometry']), x['properties'])
                 for x in json.loads(open(boundaries_file).read())['features']]

    locations = {rec['title']: (rec['longitude'],
                                rec['latitude'],
                                [properties
                                 for geom, properties in countries
                                 if intersection(geom,
                                                 Point(rec['longitude'],
                                                       rec['latitude']))])
                 for rec in recs
                 if 'longitude' in rec.keys()}

    pairs = []

    for rec in recs:
        if 'parsed_traffic' in rec:
            for pt in rec['parsed_traffic']:
                for pt2 in pt['parsed_traffic']:
                    pairs.append({
                        'pair': sorted([rec['title'], pt2['airports'][0]]),
                        'passengers': pt2['passengers']})

    return locations, pairs
Below will produce a GeoJSON file with the airport pairs and their passenger volumes. The file produced will be rendered in QGIS later on.
@app.command()
def parsed_to_geojson(
        parsed_file: str = 'parsed.jsonl',
        boundaries_file: str = 'world-administrative-boundaries.geojson'):
    locations, pairs = get_locations_and_pairs(parsed_file, boundaries_file)

    fc = FeatureCollection([
            Feature(geometry=LineString(
                                [locations[rec['pair'][0]][0],
                                 locations[rec['pair'][0]][1]],
                                [locations[rec['pair'][1]][0],
                                 locations[rec['pair'][1]][1]]),
                    properties={'passengers': rec['passengers']})
            for rec in pairs
            if rec['pair'][0] in locations.keys() and \
               rec['pair'][1] in locations.keys()])

    print(dumps(fc))
Below will parse out statistics on passenger counts between regions of the world. I've done this in two stages for clarity.
@app.command()
def parsed_to_jsonl(
        parsed_file: str = 'parsed.jsonl',
        boundaries_file: str = 'world-administrative-boundaries.geojson'):
    locations, pairs = get_locations_and_pairs(parsed_file, boundaries_file)

    for rec in pairs:
        if rec['pair'][0] in locations.keys() and \
           rec['pair'][1] in locations.keys():
           print(json.dumps({'passengers': rec['passengers'],
                             'first': locations[rec['pair'][0]],
                             'second': locations[rec['pair'][1]]},
                            sort_keys=True))


@app.command()
def jsonl_to_csv(stats_file: str = 'stats.jsonl'):
    print('passengers,first_country,first_region,second_country,second_region')
    for line in open(stats_file):
        rec = json.loads(line)
        if len(rec['first'][2]) and rec['second'][2]:
            print('%d,%s,%s,%s,%s' % (rec['passengers'],
                                      rec['first'][2][0]['iso3'],
                                      rec['first'][2][0]['region'],
                                      rec['second'][2][0]['iso3'],
                                      rec['second'][2][0]['region']))
Below will call Typer to produce a CLI when this script is run.
if __name__ == "__main__":
    app()
Running the Extracting & Parsing
This is the first and most lengthy stage where airport articles are extracted from the 21 GB Wikipedia dump. It produced 38,450 records.
$ python extract.py bz2-to-jsonl \
    enwiki-20230701-pages-articles-multistream.xml.bz2 \
    > extracted.jsonl
As the output is being produced, I was able to watch the articles appear in real-time in another terminal window.
$ tail -f extracted.jsonl | jq -c .title
...
"Airport (1970 film)"
"Mexico City International Airport"
"Madrid–Barajas Airport"
"Ezeiza International Airport"
"Croydon Airport"
"Gatwick Airport"
"Tocumen International Airport"
"Jorge Chávez International Airport"
...
The following will extract the airport information and destinations list from the above and produce an 11,031-record JSONL file. 502 of these records contain passenger destination counts.
$ python extract.py markdown-to-jsonl extracted.jsonl \
    > parsed.jsonl
I was able to find the latitude and longitude for 10,160 airports.
$ jq -c '[.title,.latitude,.longitude]' parsed.jsonl \
    | grep -v ',null' \
    | sort \
    > locations.jsonl
I was able to find at least one airport code in 4,617 records.
$ jq -c '[.title,.airport_codes]' parsed.jsonl \
    | grep -v ',null' \
    | sort \
    > codes.jsonl
The following will produce a GeoJSON file containing LINESTRINGs and their respective passenger counts.
$ python extract.py parsed-to-geojson parsed.jsonl > passengers.geojson
Rendering in QGIS
I'll start a new project in QGIS and drop the passengers.geojson file onto the blank map. I'll then select that layer's simple line style and enter the following expression so that lines are coloured based on the number of passengers they represent. The colour format is #AARRGGBB with the first 2 characters representing the alpha channel.
CASE
  WHEN "passengers" >= 2373529 THEN '#ffe93a27'
  WHEN "passengers" >= 237352  THEN '#ccef684b'
  WHEN "passengers" >= 23735   THEN '#99ed8d75'
  WHEN "passengers" >= 2373    THEN '#66f7c4b1'
  ELSE                              '#33e5cccf'
END
I'll use the following expression for the stroke widths so that more popular routes have a thicker line than less popular routes.
CASE
  WHEN "passengers" >= 2373529 THEN 0.5
  WHEN "passengers" >= 237352  THEN 0.2
  WHEN "passengers" >= 23735   THEN 0.1
  WHEN "passengers" >= 2373    THEN 0.05
  ELSE 0.05
END
I'll change the simple line's parent transparency to 50% so more of the map is visible. You might need to adjust this both for taste and that Europe and the US hardly have an inch of land showing due to the clustering of flight paths.
I'll drag NASA's Night Black Marble GeoTIFF file onto the map and make sure it's the bottom layer so the flight paths can be seen above it.
In the bottom right of the QGIS UI, there is a projection for that map that I'll change to EPSG:9840.
I'll then click the "passengers" layer with the right mouse button in the layers panel and select "Zoom to layer(s)" so that the flight paths take up as much of the screen as possible.
The result should be a rendering like the following.
A Focus on Europe
In the above map, it's obvious Europe is a major market but it's completely covered in lines. To bring out some of the details and contrast the routes against one another, make the following changes to the map.
Go to the settings menu and click "Custom Projections". Click The plus icon and create a new projection with the "Proj String (Legacy - Not Recommended)" format. Paste in the following projection configuration:
+proj=ortho +ellipse=sphere +lat_0=40 +lon_0=40
Name the projection "Europe" and hit "OK".
In the bottom right of the QGIS Interface, click the current projection and search for the new "Europe" projection. It should appear at the bottom of the search results as a user-defined projection.
Then, rotate the map -30 degrees in the bottom right of the QGIS UI.
Replace the 4 MB NASA map with the 64 MB version.
The Simple line colour expression in the passengers should be changed to the following:
CASE
  WHEN "passengers" >= 800000 THEN '#ffe93a27'
  WHEN "passengers" >= 600000 THEN '#ccef684b'
  WHEN "passengers" >= 400000 THEN '#99ed8d75'
  WHEN "passengers" >= 200000 THEN '#66f7c4b1'
  ELSE                             '#33e5cccf'
END
The Stroke width expression should be changed to the following:
CASE
  WHEN "passengers" >= 800000 THEN 0.5
  WHEN "passengers" >= 600000 THEN 0.2
  WHEN "passengers" >= 400000 THEN 0.1
  WHEN "passengers" >= 200000 THEN 0.05
  ELSE 0.05
END
You should then see a much clearer image of the most popular passenger routes over Europe and their connections to the Gulf States and other parts of the Middle East.
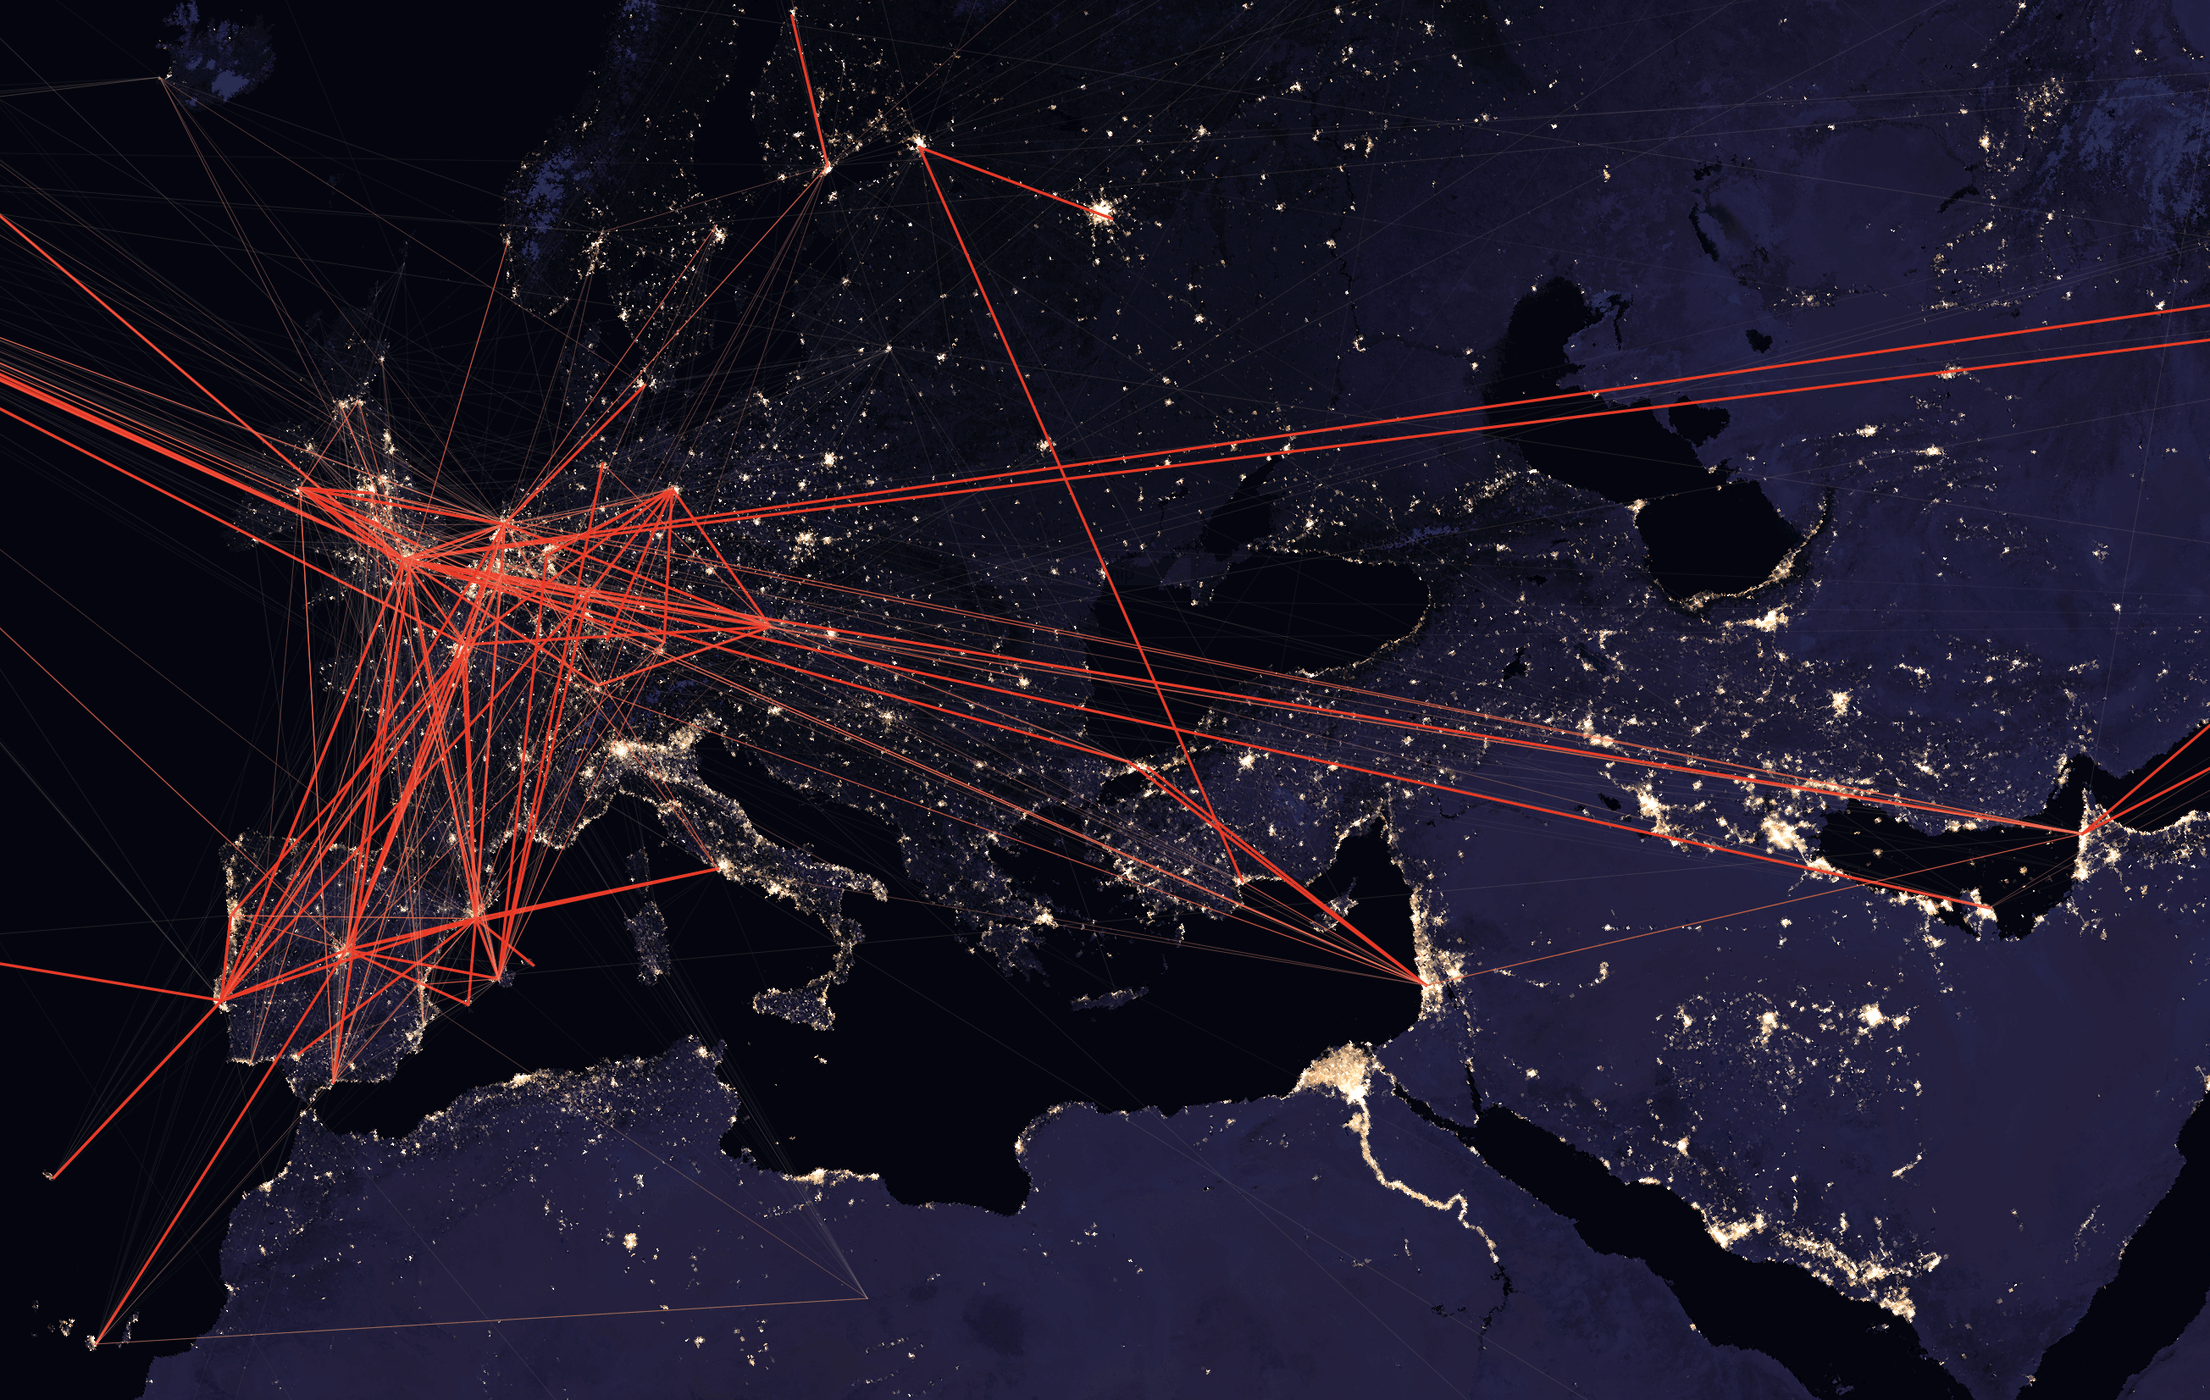
Thank you to svg for the idea of using this projection.
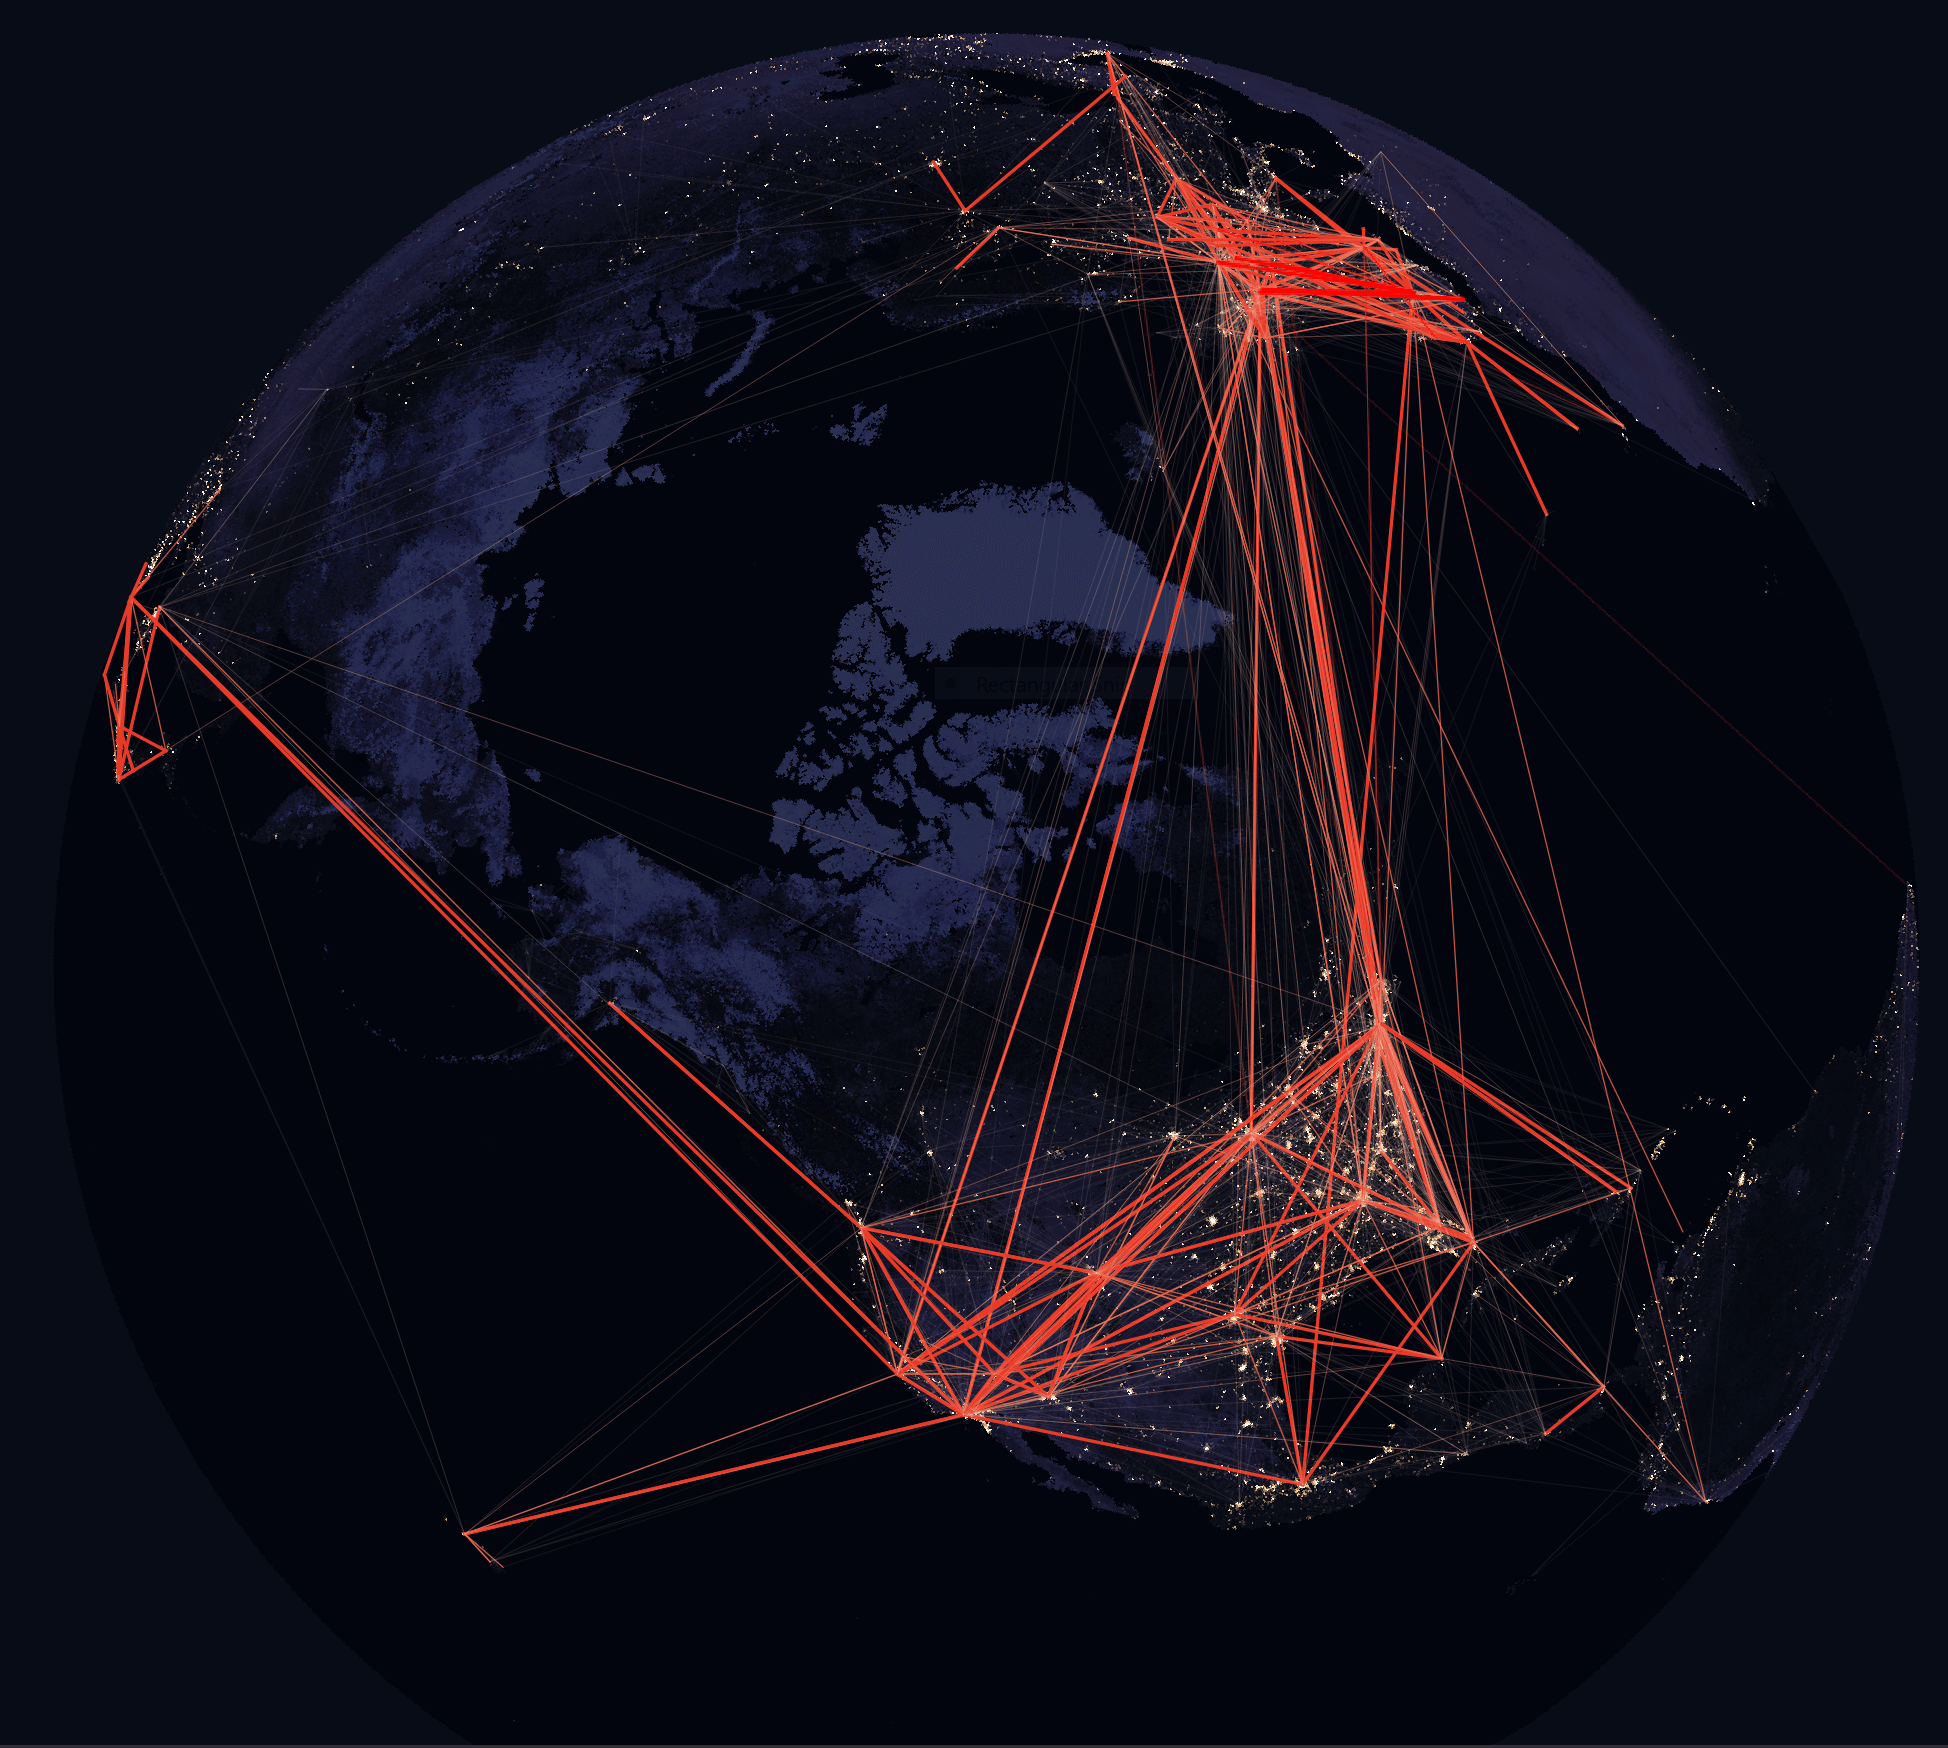
The Polar Route
Making the above changes and using the following North America-centric projection will render a clearer view of the US routes and their connections to Asia and Europe.
+proj=ortho +ellipse=sphere +lat_0=60 +lon_0=-100
Popular Region Pairings
Below I'll extract the passenger counts by region and examine them in DuckDB.
$ python extract.py parsed-to-jsonl > stats.jsonl
$ python extract.py jsonl-to-csv > stats.csv
$ duckdb
Below are the top 3 destination regions for each region in our dataset that has at least 100K passengers in the latest year statistics are available.
WITH a AS (
    SELECT first_region,
           second_region,
           sum(passengers) passengers,
           row_number() over (partition by first_region
                              order by sum(passengers) desc) AS rank
    FROM 'stats.csv'
    group by 1, 2
    ORDER BY 1, 2)
SELECT first_region,
       second_region,
       passengers,
       rank
FROM a
WHERE rank < 4
AND passengers > 100000
ORDER BY 1, 4;
┌───────────────────────────┬───────────────────────────┬────────────┬───────┐
│       first_region        │       second_region       │ passengers │ rank  │
│          varchar          │          varchar          │   int128   │ int64 │
├───────────────────────────┼───────────────────────────┼────────────┼───────┤
│ Australia and New Zealand │ Australia and New Zealand │   39637911 │     1 │
│ Australia and New Zealand │ Western Asia              │     715586 │     2 │
│ Australia and New Zealand │ South-Eastern Asia        │     664622 │     3 │
│ Caribbean                 │ Northern America          │    2662948 │     1 │
│ Caribbean                 │ Central America           │    1247948 │     2 │
│ Central America           │ Northern America          │   16661085 │     1 │
│ Central America           │ Central America           │    3161101 │     2 │
│ Central Asia              │ Eastern Europe            │     261031 │     1 │
│ Eastern Africa            │ Northern America          │     207337 │     1 │
│ Eastern Asia              │ Eastern Asia              │   17549947 │     1 │
│ Eastern Asia              │ South-Eastern Asia        │    3814851 │     2 │
│ Eastern Asia              │ Western Europe            │     351264 │     3 │
│ Eastern Europe            │ Eastern Europe            │    6814239 │     1 │
│ Eastern Europe            │ Northern Europe           │    2266776 │     2 │
│ Eastern Europe            │ Western Europe            │     634044 │     3 │
│ Northern Africa           │ Southern Europe           │     706778 │     1 │
│ Northern Africa           │ Northern Europe           │     335302 │     2 │
│ Northern America          │ Northern America          │  211093903 │     1 │
│ Northern America          │ Central America           │   10970055 │     2 │
│ Northern America          │ Caribbean                 │    5330424 │     3 │
│ Northern Europe           │ Northern Europe           │   37859704 │     1 │
│ Northern Europe           │ Southern Europe           │   26060129 │     2 │
│ Northern Europe           │ Northern America          │   14899641 │     3 │
│ South America             │ Central America           │    1535577 │     1 │
│ South America             │ South America             │    1056733 │     2 │
│ South America             │ Southern Europe           │     689453 │     3 │
│ South-Eastern Asia        │ South-Eastern Asia        │   50156640 │     1 │
│ South-Eastern Asia        │ Eastern Asia              │    9275602 │     2 │
│ South-Eastern Asia        │ Australia and New Zealand │    2873690 │     3 │
│ Southern Asia             │ South-Eastern Asia        │    1686304 │     1 │
│ Southern Asia             │ Northern America          │     707087 │     2 │
│ Southern Europe           │ Southern Europe           │   40373138 │     1 │
│ Southern Europe           │ Northern Europe           │   10562031 │     2 │
│ Southern Europe           │ Western Europe            │   10300926 │     3 │
│ Western Africa            │ Western Europe            │     109803 │     1 │
│ Western Asia              │ Northern Europe           │    7036563 │     1 │
│ Western Asia              │ Northern America          │    3612566 │     2 │
│ Western Asia              │ Western Europe            │    3573017 │     3 │
│ Western Europe            │ Southern Europe           │   24845545 │     1 │
│ Western Europe            │ Western Europe            │   24499609 │     2 │
│ Western Europe            │ Northern Europe           │   21940289 │     3 │
├───────────────────────────┴───────────────────────────┴────────────┴───────┤
│ 41 rows                                                          4 columns │
└────────────────────────────────────────────────────────────────────────────┘
Keep in mind the above was collected out of "top x destinations" lists so the sums of passengers will only be from those top records. There could be popular destinations long tails that add up to a meaningful sum that the above would miss. I suspect the rankings are correct but I wouldn't read much into the passenger counts.