The Apache ECharts project is a web-based charting library. It was started in 2013 and built using 77.5K lines of TypeScript. It is well documented and has over 200 examples of its API's usage. The examples allow you to toggle between light/dark mode and there is a cheat sheet and a theme builder with several tasteful presents to choose from.
Few of the major contributors maintain flashy public profiles but many of them state they live and work in China. Yi Shen has contributed the largest number of commits and works for Baidu. Lin Feng has the 3rd highest number of commits and is employed by Alipay.
A few of the examples that stand out to me include:
- a stock price candle sticks chart, complete with trading volumes and a MACD indicator.
- an animating pie chart with a timeline playback mechanism.
- a chart comparing volume over time.
- a polar angle chart.
In this post, I'll explore rendering ECharts using a Python wrapper and converting them into static images using Chromium.
ECharts, Up & Running
The system I'm using is a 13" 2020 MacBook Pro running macOS 12.5. It has an Intel Core i5 quad-core locked at 1.4 GHz with a turbo boost speed of up to 3.9GHz, 8 GB of 2133 MHz LPDDR3 RAM and 250 GB of SSD capacity.
I'll install Python 3.9 and a few other dependencies used in this post via Homebrew.
$ brew install \
    exiftool \
    git \
    jq \
    virtualenv \
    wget
I'll then set up a virtual environment that will be used to contain pyecharts, a Python wrapper for ECharts.
$ virtualenv ~/.ec
$ source ~/.ec/bin/activate
$ python3 -m pip install \
    pyecharts
Work started on pyecharts back in 2017. It's made up of 6,379 lines of Python and has seen a little under 50K downloads off of PyPI in the past month. The author of this library also ported it to GoLang.
Rendering ECharts
I'll pull down a 6KB, JSON-formatted dataset from the ECharts project. It lists several energy sources and describes their lifecycles.
$ wget https://echarts.apache.org/examples/data/asset/data/energy.json
There are two sections of interest in this file. The first is the nodes section which lists each energy source. There are 48 in total. Below are a few examples.
$ jq .nodes[:3] energy.json
[
  {
    "name": "Agricultural 'waste'"
  },
  {
    "name": "Bio-conversion"
  },
  {
    "name": "Liquid"
  }
]
The second is the links section which describes the relationship between each of the nodes. There are 68 links in total. Below are a few examples.
$ jq .links[:3] energy.json
[
  {
    "source": "Agricultural 'waste'",
    "target": "Bio-conversion",
    "value": 124.729
  },
  {
    "source": "Bio-conversion",
    "target": "Liquid",
    "value": 0.597
  },
  {
    "source": "Bio-conversion",
    "target": "Losses",
    "value": 26.862
  }
]
I'll build an HTML file using ECharts' Python wrapper. It'll contain the above dataset and a call out to the ECharts JavaScript library being hosted by the pyecharts project. The following code was fashioned from pyechart's documentation.
$ python3
import json

import pyecharts.options as opts
from pyecharts.charts import Sankey


data = json.loads(open('energy.json', 'r').read())

Sankey(init_opts=opts.InitOpts(width="800px", height="600px")).add(
    series_name="",
    nodes=data["nodes"],
    links=data["links"],
    itemstyle_opts=opts.ItemStyleOpts(border_width=1,
                                      border_color="#aaa"),
    linestyle_opt=opts.LineStyleOpts(color="source",
                                     curve=0.5,
                                     opacity=0.5),
    tooltip_opts=opts.TooltipOpts(trigger_on="mousemove"),
)\
.set_global_opts(title_opts=opts.TitleOpts(title="Sankey Diagram"))\
.render("sankey_diagram.html")
Below is a screenshot of the chart produced.
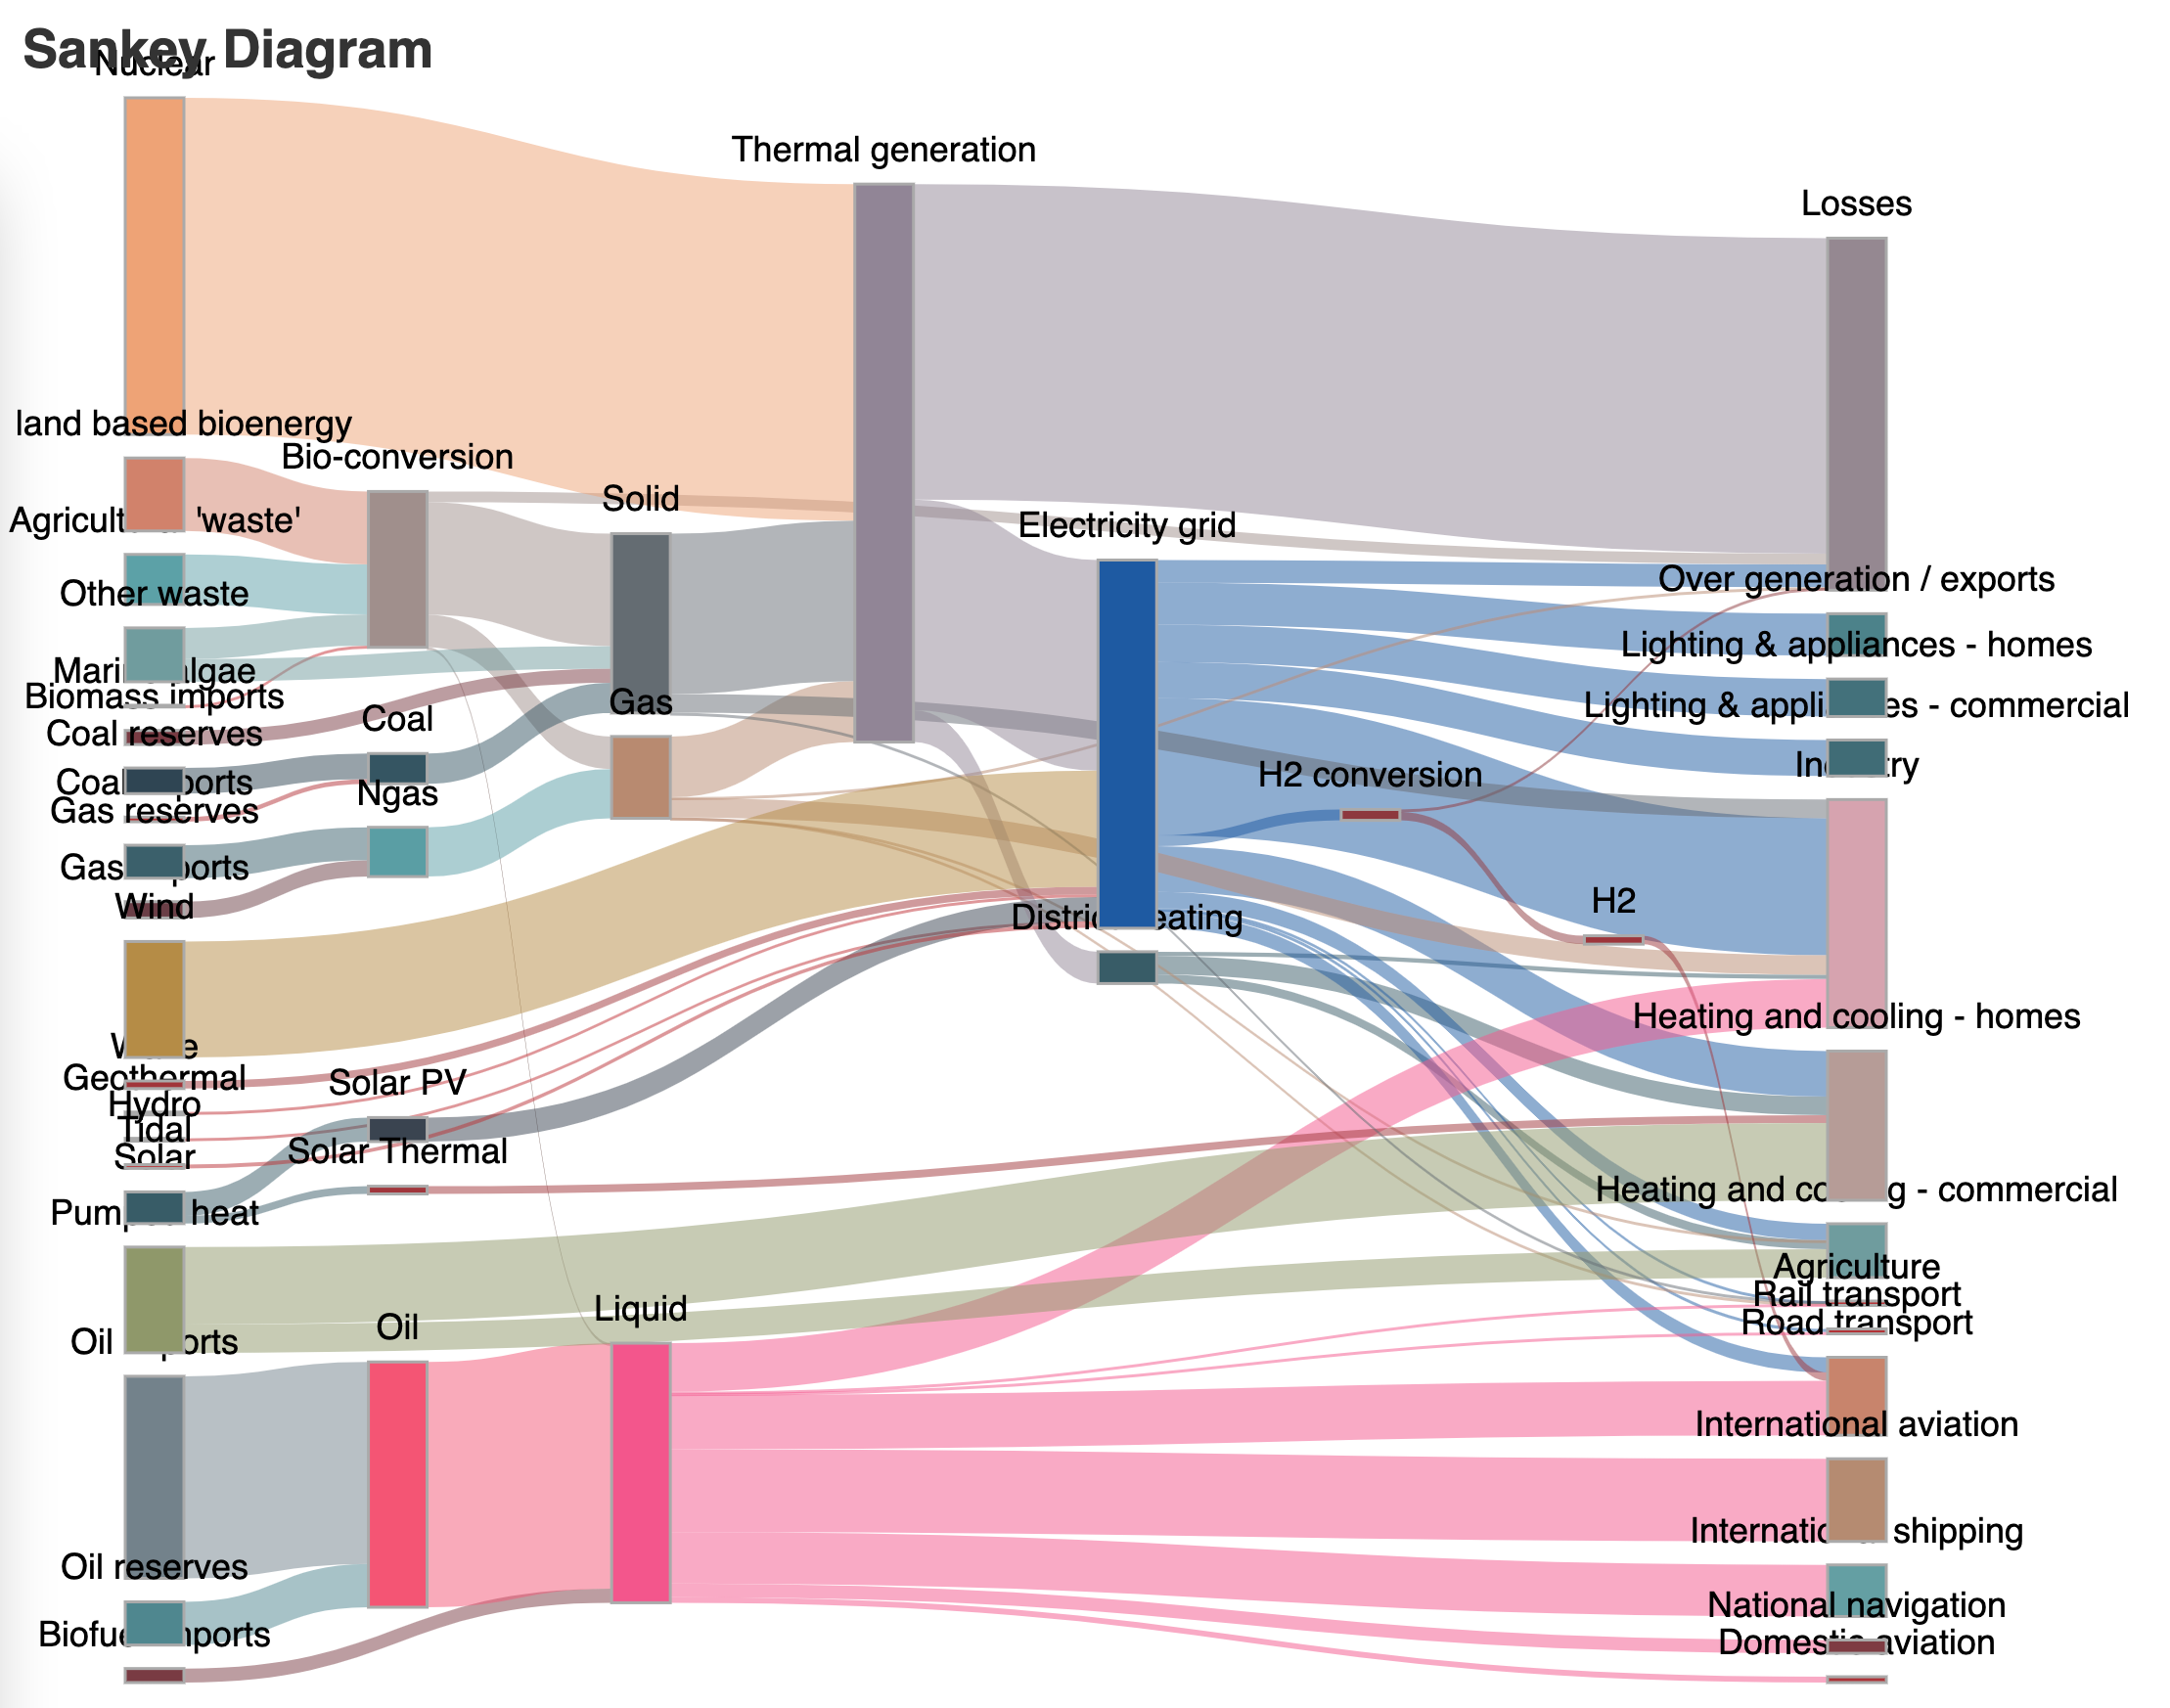
The chart's HTML file can compress down to 2 KB with GZIP. The chart is rendered on a canvas element and supports tooltips. If it's opened with Chrome, the chart can be saved to a 439 KB PNG with a transparent background directly from the browser. Canvas renderings are pixel-based so if you Zoom into the chart you will start to see artefacts.
Converting ECharts to PNG
There is a snapshot library for pyecharts that allows you to convert the HTML produced by the library into formats like JPEG, PNG, PDF and SVG. The library hasn't been updated in two years and I discovered it to be broken with Python 3.9. I've raised a pull request with a fix but until that code makes its way to PyPI I'll install my fork of the library.
$ python3 -m pip install git+https://github.com/marklit/pyecharts-snapshot.git
$ ipython3
import asyncio

from pyecharts_snapshot.main import make_a_snapshot


job = make_a_snapshot('sankey_diagram.html', 'sankey_diagram.png')
asyncio.run(job)
The above produced a PNG that is twice the height and width of the original chart specified. I'm not exactly certain of the reason behind this but the image renders nicely on my MBP.
$ exiftool sankey_diagram.png
ExifTool Version Number         : 12.30
File Name                       : sankey_diagram.png
Directory                       : .
File Size                       : 429 KiB
File Modification Date/Time     : 2022:08:03 22:39:47+03:00
File Access Date/Time           : 2022:08:03 22:39:48+03:00
File Inode Change Date/Time     : 2022:08:03 22:39:47+03:00
File Permissions                : -rw-r--r--
File Type                       : PNG
File Type Extension             : png
MIME Type                       : image/png
Image Width                     : 1600
Image Height                    : 1200
Bit Depth                       : 8
Color Type                      : RGB with Alpha
Compression                     : Deflate/Inflate
Filter                          : Adaptive
Interlace                       : Noninterlaced
Image Size                      : 1600x1200
Megapixels                      : 1.9
The snapshot library contains 687 lines of Python and wraps the ~10K-line pyppeteer project. This is a headless Chromium automation library. When it is called, it'll download Chromium if it isn't already installed. I examined the distributable it pulled down onto my MBP and it was a little under 87 MB.
$ curl -sI https://storage.googleapis.com/chromium-browser-snapshots/Mac/588429/chrome-mac.zip \
    | grep '^content-length'
content-length: 86759503